Poultry by Stable Isotope Analysis
Mail Address
Keywords
Authentication, carbon-13, isotopic determination, nitrogen-15, tracer.
Carrijo AS1 Pezzato AC2 Ducatti C3 Sartori JR2 Trinca L4 Silva ET5
1 Professor, Departamento de Produção Animal - UFMS. Campo Grande, MS. 2 Professor, Departamento de Melhoramento
e Nutrição Animal - FMVZ/UNESP. Botucatu, SP.
3 Professor, Departamento de Física e Biofísica - IB/UNESP. Botucatu, SP.
4 Professor, Departamento de Bioestatística - IB/UNESP. Botucatu, SP.
5 Technician, Centro de Isótopos Estáveis - IB/ UNESP. Botucatu, SP.
Alfredo Sampaio Carrijo
Universidade Federal de Mato Grosso do Sul Departamento de Produção Animal Caixa Postal 549
79.070-900. Campo Grande, MS, Brazil Phone: 55 67 3345 3580
E-mail: [email protected] Author(s)
Arrived: October / 2004 Approved: December / 2005
ABSTRACT
Bovine meat and bone meal (MBM) was widely used in animal diets until outbreaks of Bovine Spongiform Encefalopathy (BSE) occurred in some countries. It has not been confirmed yet whether or not BSE may be transmitted to man through chicken meat originated from poultry that had been fed diets containing MBM. Therefore, consumers nowadays express preference for meat originated from birds fed exclusively vegetable diets. This study analyzed samples of major breast muscle (Pectoralis major) using mass spectrometry of stable isotopes (carbon and nitrogen) as a means to assess the presence of MBM in broiler diets, a technique that might be used in the certification of poultry quality. A total of 150 day-old chicks were reared in five randomized treatments with increasing MBM dietary inclusion levels (0, 1, 2, 4 and 8%). On day 42, breast muscle samples were collected from three birds per treatment and used in the determination of 13C/12C and 15N/14N isotope ratios. The breast muscle isotope values were expressed as delta in parts per thousand (δ). The following carbon isotope values (13C) were found: -18.74±0.11, -18.51±0.19, -18.24±0.10, -17.79 ±0.12, and 17.15±0.15 for 0, 1, 2, 4 and 8% MBM dietary levels,
respectively. Nitrogen isotope values (15N) were 1.65±0.14,
1.65±0.28, 1.72±0.08, 1.95±0.16, and 2.52 ± 0.09 for 0, 1, 2, 4 and 8% MBM dietary levels, respectively. This study showed important differences in δ13C and δ15N values in breast meat, evidencing a simultaneous enrichment of this isotopic pair, which allowed tracing MBM in bird diets. Analysis of carbon and nitrogen stable isotopes may be used to ensure feeding with exclusively vegetable diets, and might also be used as a reliable evaluation tool in broiler meat certification. The diet with 1% inclusion level of MBM and the exclusively vegetable diet showed similar results.
INTRODUCTION
Bovine meat and bone meal (MBM) was widely used in animal diets until the occurrence of outbreaks of Bovine Spongiform Encefalopathy (BSE) in Europe, Japan, and, more recently, Canada. Nowadays, the use of MBM is prohibited in ruminant feeding as a means to prevent new cases of BSE, although it is still used in broiler feeding as a substitute for soybean meal, a high-cost protein source of vegetable origin. As a result, sanitary authorities worldwide are increasingly concerned with quality control and certification of origin of fresh meat and animal products. Recently, authentication and objective feed information have been the main objectives of consumers (Monin, 1998).
also helped to reconstruct the dietary history of animals through the analysis of different tissues (De Niro & Epstein, 1978; Merve van der, 1982). Less scrupulous producers commonly adulterate food products by substituting high-cost ingredients for less expensive ones, or by omitting/including some ingredients (Silva
et al., 1999). The 13C/12C isotope ratio has been used to test the authenticity, quality, and geographical origin of several products such as orange juice (Bricout & Koziet, 1987), honey (Brookes et al., 1991), and vegetable oils (Kelly et al., 1997). Analysis of meat, liver and fat samples using 13C stable isotope technique has also been used to characterize and differentiate the dietary regimen of Iberian swine, and it has enabled classification of animals according to the type of food given during the fattening period (González-Martin et al., 1999; Gonzáles-Martin et al., 2001).
Piasentier et al. (2003) demonstrated that it is possible to certify the geographical origin and food regimen of lamb by analyzing carbon and nitrogen isotope levels in muscle and fat using mass spectrometry.
It has not been confirmed whether or not BSE in humans may be caused by the consumption of poultry originated from birds fed diets containing MBM. Therefore, consumers nowadays show preference for chicken meat from birds fed an exclusively vegetable-based diet.
The objective of this study was to trace the presence of MBM in broiler diets. Breast muscle (Pectoralis major) was analyzed by mass spectrometry, evaluating stable carbon (13C/12C) and nitrogen (15N/14N) in dual isotope ratio analysisin the certification of poultry quality.
MATERIAL AND METHODS
General management of birds
The experiment was performed in the Laboratory of Avian Nutrition FMVZ/ UNESP, Botucatu-SP, Brazil. One hundred and fifty one-day-old Cobb broiler chicks were housed in cages and raised until 42 days old under similar conditions and standard management procedures. Isoprotein and isocaloric diets were provided. Water and food were supplied ad libitum
using nipple drinkers and automatic feeders. Birds were given 24 hours of continuous light supplied by incandescent 60W light bulbs.
The birds were distributed into 5 treatments of 30 birds each, according to a completely randomized experimental design. Experimental corn and soybean meal-based diets were formulated according to
Rostagno et al. (2000). Tables 1 and 2 show the
percentage composition of the diets. Inclusion levels of MBM were 0% in the control treatment (MBM 0), 1% (MBM 1), 2% (MBM 2), 4% (MBM 4), and 8% (MBM 8). Isotopic values of the MBM included in experimental diets were 12.97 and 8.06 for carbon and nitrogen, respectively.
Isotope ratio measurement by mass spectrometry
At 42 days of age, three birds were randomly taken from each treatment and sacrificed by cervical dislocation. Samples of approximately 20g were collected medially at the proximal third of the left breast muscle. Samples were identified and frozen at -20oC for isotopic analyses.
Breast muscle samples were thawed, washed in distilled water, and dried at 56oC for 48h in a forced ventilation oven (MA 035, Marconi, Piracicaba, Brazil). All samples were ground in a cryogenic grinder with liquid nitrogen (Spex 6700-230 freezer/mill Spex Industries, Edison, USA) at -196oC for 3 minutes. Individual tubes were used to avoid contamination between samples (Ducatti, 2000).
The samples were analyzed at the Center of Stable Isotopes IB/UNESP, Botucatu-SP, Brazil. Approximately 0.35mg and 0.45mg of each sample were used for 13C/
12C and 15N/14N isotopic ratio measurements,
respectively. They were weighed inside metal capsules and placed into a Multi-element analyzer (EA 1108 CHN Fisons Instruments, Rodano, Italy) by automatic sampler. The samples were quantitatively burned in the presence of oxygen (O2) and copper oxide (CuO) to obtain CO2 and NOx that was then reduced to N2 in the presence of copper. The gases formed were separated in a gas chromatograph column and analyzed in an isotope ratio mass spectrometer (Delta S Finnigan MAT, Bremen, Germany).
Isotope ratio values were expressed as delta per thousand(δ) in relation to Pee Dee Belemnite (PDB) international standards for δ13C and atmospheric air for δ15N, according to the following equation:
δ (sample, standard) = [(Rsample Rstandard)/Rstandard] x 1000
where R represents the ratio between the least and most abundant isotopes, in particular 13C/12C and 15N/ 14N. Each sample was analyzed twice to obtain mean
Results were statistically analyzed using General Linear Models (SAS, 1996), and multivariate analysis for the isotopic pair. Confidence intervals (95%) were obtained by the difference between each treatment and the control treatment using joint variance matrix and discriminant analysis with further analysis of variance in the discriminating function.
RESULTS AND DISCUSSION
The results of the isotopic analysis for d13C and d15N of initial (1 21 days) and final diets (22 42 days) of each treatment are shown in Table 3. The isotope signature of the exclusively vegetable diet was -17.47 for 13C in the starter diet, and 17.03 in the final diet. These are characteristic values of corn and soybean meal-based diets used by the poultry industry in Brazil. The use of MBM instead of soybean meal changes these values and the diets are expected to become heavier in both 13C and 15N. Isotopic enrichment in both carbon-13 and nitrogen-15 was observed due to the increase in MBM inclusion levels in the diets. Carbon-13 enrichment might be explained by the origin of MBM Table 1 Percentage composition of starter diets (1 to 21 days).
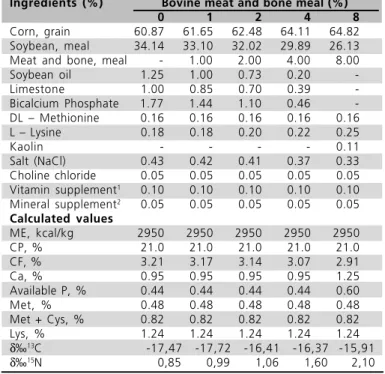
Ingredients (%) Bovine meat and bone meal (%)
0 1 2 4 8
Corn, grain 60.87 61.65 62.48 64.11 64.82 Soybean, meal 34.14 33.10 32.02 29.89 26.13 Meat and bone, meal - 1.00 2.00 4.00 8.00 Soybean oil 1.25 1.00 0.73 0.20 -Limestone 1.00 0.85 0.70 0.39 -Bicalcium Phosphate 1.77 1.44 1.10 0.46 -DL Methionine 0.16 0.16 0.16 0.16 0.16 L Lysine 0.18 0.18 0.20 0.22 0.25 Kaolin - - - - 0.11 Salt (NaCl) 0.43 0.42 0.41 0.37 0.33 Choline chloride 0.05 0.05 0.05 0.05 0.05 Vitamin supplement1 0.10 0.10 0.10 0.10 0.10 Mineral supplement2 0.05 0.05 0.05 0.05 0.05 Calculated values
ME, kcal/kg 2950 2950 2950 2950 2950 CP, % 21.0 21.0 21.0 21.0 21.0 CF, % 3.21 3.17 3.14 3.07 2.91 Ca, % 0.95 0.95 0.95 0.95 1.25 Available P, % 0.44 0.44 0.44 0.44 0.60 Met, % 0.48 0.48 0.48 0.48 0.48 Met + Cys, % 0.82 0.82 0.82 0.82 0.82 Lys, % 1.24 1.24 1.24 1.24 1.24 δ13C -17,47 -17,72 -16,41 -16,37 -15,91 δ15N 0,85 0,99 1,06 1,60 2,10 1- Initial vitamin supplement Vaccinar (levels per kg of product): Vit. A, 14,000,000 IU; Vit. D3, 2,500,000 IU; Vit. E, 25,000mg; Vit K3, 3,000mg; Vit. B1, 2,000mg; Vit. B2, 5,000mg; Vit. B6, 4,000mg; Vit. B12, 25,000mcg; Niacin, 35,000mg; Pantothenic acid, 12,000mg; Biotin, 100mg; Folic acid, 1,000mg; Vit C, 50,000mg; antioxidant (BHT), 125mg.2- Mineral supplement Vaccinar (per kg of product): Selenium, 360mg; Iron, 96,000mg; Manganese, 156,000mg; Iodine, 1,400mg; Copper, 20,000mg; Zinc, 110,000mg.
produced in Brazil. Tropical pastures consist of C4 -photosynthetic grasses. Nitrogen-15 enrichment in diets is in agreement with Delgado & Garcia (2001), who showed the importance of animal by-products in order to enrich diets with 15N.
Table 3 - Values of δ13C and δ15N in initial (121 days) and
final (22-42 days)diets containing different levels of bovine
meat and bone meal (MBM).
MBM level* Initial Diet Final Diet % δ13C δ15N δ13C δ15N
0 - 17.47 0.85 - 17.03 1.09 1 - 17.77 0.99 - 16.86 1.37 2 - 16.41 1.06 - 16.57 1.29 4 - 16.37 1.60 - 16.49 1.49 8 - 15.91 2.10 - 16.25 2.24 *Levels in MBM: δ13C = -12.97; δ15N = 8.06
Hobson & Clark (1992) reported that the choice of tissue type for isotopic analysis depends on the speed with which the different tissues reflect the isotopic signature. Therefore, it depends on the metabolism rate of the tissue. Since the turnover rate in breast muscle of growing broiler chickens is very high and Table 2 - Percentage composition of final diets (22 to 42 days).
Ingredients (%) Bovine meat and bone meal (%)
0 1 2 4 8
Corn, grain 63.75 64.52 65.31 66.91 67.00 Soybean, meal 29.83 28.77 27.71 25.59 21.95 Meat and bone, meal - 1.00 2.00 4.00 8.00 Soybean oil, 2.96 2.71 2.45 1.95 1.95 Limestone 0.92 0.77 0.60 0.32 -Bicalcium Phosphate 1.62 1.30 1.00 0.31 -DL Methionine 0.15 0.15 0.15 0.15 0.16 L Lysine 0.21 0.22 0.23 0.25 0.27 Kaolin - - - - 0.21 Salt (NaCl) 0.37 0.36 0.35 0.32 0.26 Choline chloride 0.05 0.05 0.05 0.05 0.05 Vitamin supplement1 0.10 0.10 0.10 0.10 0.10 Mineral supplement2 0.05 0.05 0.05 0.05 0.05 Calculated values
1.6 1.7 1.8 1.9 2.0 2.1 2.2 2.3 2.4 2.5 2.6 -17.0
-17.2 -17.4 -17.6 -17.8 -18.0 -18.2 -18.4 -18.6 -18.8 -19.0
8 % 4 %
2 % 1 % 0 %
δ
‰
13 C
(
m
u
scl
e)
δ ‰ 15
N (m u scle) 99% of the tissue carbon is replaced in approximately
17 days (Cruz, 2002; Carrijo et al., 2000; Ducatti et al., 2002), the isotopic signature should safely represent the diets given to birds. Therefore, breast muscle was chosen for analysis due to the higher commercial value of this cut, the low fat levels in the tissue, and mainly the higher turnover rate.
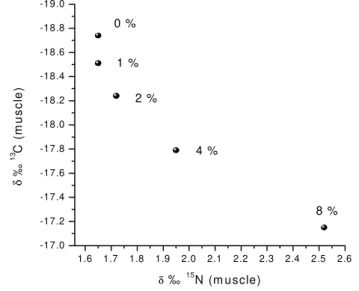
The mean 13C/12C and 15N/14N isotopic ratios in breast muscle of broiler chickens fed an exclusively vegetable-based diet (MBM 0) were 18.74 ± 0.11 and 1.56 ± 0.14, respectively. The values obtained for δ13C corroborate a previous study with birds fed a vegetable diet (Cruz, 2002). This evidenced that the turnover rate in the breast muscle of growing broiler chickens is much higher than the same tissue in adult Japanese quails (Hobson & Clark, 1992) and gerbils (Tieszen et al., 1983).
The mean results for 13C and 15N isotopic pair in the breast muscle of birds fed 1% MBM (MBM 1) were 18.51 ± 0.19 and 1.65 ± 0.28, respectively. This isotopic pair was not significantly different (p>0.05) from the control diet (MBM 0%). However, 2%, 4%, 8% inclusion levels of MBM resulted in values significantly different from those of birds fed an exclusively vegetable-based diet (p<0.05). Values of δ13C and δ15N for MBM 2, MBM 4, and MBM 8 were respectively 18.24±0.10 and 1.72±0.08; 17.79±0.12 and 1.95± 0.16; 17.15±0.15 and 2.52±0.09.
Figure 1 shows simultaneous isotopic enrichment for both 13C and 15N with the increasing MBM levels in the diets. This enrichment demonstrated that the turnover rate of breast muscle in growing broilers is very high and actually represents the recent dietary regimen to which the birds have been submitted. The difference between the isotope values in the diets and the muscular tissue is due to isotopic fractioning; this is in accordance with DeNiro & Epstein (1976), who reported that an isotopic signature of the animal represents what was consumed until ± 2 for 13C and 3 for 15N.
In addition, considering that the different links in the food chain are normally accompanied by enrichment with heavy isotopes (DeNiro & Epstein, 1978), it is possible that mean δ13C and δ15N values in muscular tissue are higher in birds fed MBM enriched diets than in birds fed an exclusively vegetable-based diet. The variability of delta values between diets and muscle is also due to isotopic fractioning during nutrient assimilation.
Isotope enrichment of the muscular tissue in birds fed higher levels of MBM is in agreement with Delgado & Garcia (2001), who emphasized the role of protein
of animal origin as a source of relatively high levels of
15N in animal feeds. These authors showed that
carnivores are richer in 15N than omnivores, which in turn have higher levels than herbivores, and finally local plants. This demonstrates that the inclusion of animal by-products in feeds would enrich these with nitrogen-15 and thus change the isotopic signature of animals that have been fed the 15N enriched diet.
Figure 1 - Mean values of δ13C and δ15N at 42 days in breast
muscle of broiler chickens submitted to diets with different levels of bovine meat and bone meal (n=3).
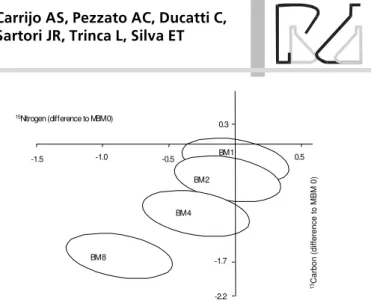
A multivariate analysis was used to simultaneously assess δ13C and δ15N results of the different treatments. Figure 2 shows the confidence interval (95%) for the differences between each MBM level and MBM 0 using a joint covariance matrix. The regions that do not include the intercept (0,0) indicate significant difference between the isotopic pairs.
Piasentier et al. (2003) reported that it was possible to certify the geographical origin of lamb and dietary regimen of sheep by means of δ13C and δ15N analysis in meat and fat. Similar results have been found for other species (Gonzalez-Martin et al., 1999). Carrijo (2003) found similar results of 13C and 15N isotopic enrichment in the breast muscle of broilers fed diets containing different animal by-products, such as poultry offal meal and/or blood and feather meal.
15Nitrogen (difference to MBM 0)
13Carbon (difference to MBM 0
)
BM 8
BM 4 BM 2
BM 1
-1.5 -1.0 -0.5 0.5
-2.2 -1.7 0.3
Figure 2 - Confidence intervals for the difference between the control treatment (MBM 0) and treatments with different inclusion levels of bovine meat and bone meal (levels assessed in breast muscle).
CONCLUSIONS
This study showed important differences in the values of δ13C and δ15N in the breast meat of broiler chickens. There was a simultaneous enrichment of the isotopic pair, allowing to trace the addition of bovine meat and bone meal in bird diets. Multivariate analysis followed by establishment of confidence intervals indicated that the analysis of carbon and nitrogen stable isotopes might be used as a reliable evaluation tool for certification of poultry from birds fed exclusively vegetable-based diets. It is important to consider that there were no differences between the groups fed the exclusively vegetable-based diet and 1% MBM in the diet. Studies should be performed to improve the technique and reinforce its applicability, since nitrogen sources might show higher variability than sources with carbon isotopes.
REFERENCES
Bricout J, Koziet J. Control of the authenticity of orange juice by
isotopic analysis.Journal of Agricultural Food Chemistry 1987; 35:
758-760.
Brookes ST, Barrie A, Davies JE. A rapid 13C/12C test for determination of corn-syrups in honey. Journal of the Association
of Official Analytical Chemists 1991;74:627-629.
Carrijo AS. Técnica dos isótopos estáveis do carbono (13C/12C) e
nitrogênio (15N/14N) em frangos de corte [tese]. Botucatu (SP):
Universidade Estadual Paulista; 2003.
Carrijo AS, Pezzato AC, Ducatti C. Avaliação do metabolismo nutricional em poedeiras pela técnica dos isótopos estáveis do
carbono (13C/12C). Revista Brasileira de Ciência Avícola 2000; 2(3):
209-218.
Cruz VC. Livre escolha de alimentos dos ciclos fotossintéticos C3 e
C4, fracionamento e turnover dos isótopos estáveis do carbono
nos tecidos de frango de corte [dissertação]. Botucatu (SP): Universidade Estadual Paulista; 2002.
Delgado A, Garcia N. δ15N and δ13C analysis to identify cattle fed on
feed containing animal proteins: a safety/quality index in meat, milk and cheese. In:6 International Symposium on Food Authenticity and Safety; 2001; Nantes. France. p. 28-30.
DeNiro MJ, Epstein S. You are what you eat (plus a few ) the carbon isotope cycle in food chains. Geological Society of America (Abstract) 1976; 6:834.
DeNiro MJ, Epstein S. Influence of diet on the distribution of carbon
isotopes in animals.Geochimica et Cosmichimica Acta1978;42:
495-506.
Ducatti C. Isótopos estáveis ambientais[apostila]. Botucatu (SP):
Instituto de Biociências-UNESP; 2000. p. 65.
Ducatti C, Carrijo AS, Pezzato AC, Mancera PFA. Modelo teórico e experimental da reciclagem do carbono-13 em tecidos de mamíferos e aves. Scientia Agricola 2002; 59(1):29-33.
Gannes LZ, Del-Rio CM, Koch P. Natural abundance variations in stable isotopes and their potential uses in animal physiological
ecology.Comparative Biochemistry and Physiology 1998; 119(3):
725-737.
Gonzalez-Martin I, Gonzáles-Pérez C, Hernández-Méndez J, Marqués-Macias E, Sanz- Poveda F. Use of isotope analysis to characterize meat from Iberian-breed swine. Meat Science 1999; 52:437-441.
González-Martin I, González-Pérez C, Hernández-Méndez J, Sánchez-González C. Differentiation of dietary regimen of Iberian swine by means of isotopic analysis of carbon and sulphur in hepatic tissue. Meat Science 2001; 58:25-30.
Hobson KA, Clark RG. Assessing avian diets using stable isotopes
I: turnover of 13C in tissues. The Condor 1992; 94:181-188.
Kelly S, Parker I, Sharman M, Dennis J, Goodall I. Assessing the authenticity of single seed vegetable oils using fatty acid stable
carbon isotope ratios (13C/12C). Food Chemistry 1997;
59(2):181-186.
Merve van der NJ. Carbon isotopes, photosynthesis and archaeology. American Scientist 1982; 70:596-606.
Monin G. Recent methods for predicting quality of whole meat. Meat Science 1998; 49:S231-S243.
Piasentier E, Valusso R, Camin F, Versini G. Stable isotope ratio analysis for authentication of lamb meat. Meat Science 2003; 64: 239-247.
SAS-Statistical Analysis System. Users guide: statistics. Cary: SAS Institute; 1996..
Silva MBM, Seabra RM, Andrade PB, Oliveira MB, Ferreira MA. Adulteração por adição de açúcares a sumos de frutos: Uma revisão. Ciência e Tecnologia Alimentar 1999; 2(4):184-191.
Tieszen LL, Boutton TW, Tesdahl KG, Slade NA. Fractionation and turnover of stable carbon isotopes in animal tissues: Implications