1155 Semina: Ciências Agrárias, Londrina, v. 36, n. 2, p. 1155-1168, mar./abr. 2015
Recebido para publicação 04/04/14 Aprovado em 28/08/14 DOI: 10.5433/1679-0359.2015v36n2p1155
Assessment of low amounts of meat and bone meal in the diet of
laying hens by using stable isotopes
Determinação de baixa inclusão de FCOB em dietas de poedeiras
por isótopos estáveis
Luciene Aparecida Madeira
1; Juliana Célia Denadai
1; Carlos Ducatti
2;
Antonio Celso Pezzato
1; Priscila Cavalca de Araujo
1*; Maria Márcia Pereira Sartori
3;
Carla Cachoni Pizzolante
4; José Roberto Sartori
1Abstract
The aim of this study was to assess whether the inclusion of low amounts of ingredients such as wheat bran, corn gluten and yeast in the diet of laying hens can interfere with the traceability of meat and bone meal (MBM) in eggs and its fractions (albumen and yolk). We used 256 laying hens distributed across eight treatment groups, which consisted of a diet based on corn-soybean-wheat (CSW) bran meal and other diets that had additions comprising gluten and/or (MBM) and/or yeast. To analyse the isotopic ratios (13C:12C and 15N:14N), on the 28th and 56th days, 16 eggs were randomly taken for each treatment (four for each repetition), where eight eggs (two for each repetition) were used to harvest yolk and albumen samples and the remaining eight (two for each repetition) were used to analyse the whole egg. We concluded that detection of 2.0% MBM in the egg and its fractions is possible; however, the results for treatments containing gluten and yeast were not different from those containing MBM. Therefore, the inclusion of 3.0% gluten and/or yeast does not result in different δ13C and δ15N isotopic values in the egg and its fractions compared to the values obtained with the addition of 2.0% MBM in the diet. Key words: Carbon-13, corn gluten, yeast, nitrogen-15
Resumo
O objetivo foi verificar se a baixa inclusão de outros ingredientes, como farelo de trigo, glúten de milho e levedura na dieta de poedeiras, pode interferir na rastreabilidade da farinha de carne e ossos bovinos (FCOB) em ovos e suas frações (albúmen e gema). Foram utilizadas 256 galinhas poedeiras distribuídas em oito tratamentos, no qual, foram compostos de uma dieta MST a base de milho, farelo de soja e farelo de trigo e as demais dietas foram acrescidos de glúten e/ou (FCOB) e/ou levedura. Para análise da razão isotópica (13C/12C e 15N/14N), nos 28º e 56º dias foram tomados aleatoriamente 16 ovos por tratamento (quatro por repetição), onde oito ovos (dois por repetição) serviram para colheitas de amostras de gema e albúmen e os outros oito (dois por repetição) para ovo total. Pode-se concluir que,
1 Profs., Deptº de Melhoramento e Nutrição Animal, Universidade Estadual Paulista, UNESP, Faculdade de Medicina Veterinária
e Zootecnia, Distrito de Rubião Júnior, Botucatu, SP, Brasil. E-mail: [email protected]; [email protected]; [email protected]; [email protected]; [email protected]
2 Profs., UNESP, Instituto de Biociências, Centro de Isótopos Estáveis, Distrito de Rubião Júnior, Botucatu, SP, Brasil. E-mail:
3 Pesquisadora, UNESP, Faculdade de Ciências Agronômicas, Departamento de produção e Melhoramento Vegetal, Fazenda
Lageado, Botucatu, SP, Brasil. E-mail: [email protected]
4 Pesquisadora, Unidade de Pesquisa e Desenvolvimento de Brotas, UPD, Brotas, Agência Paulista de Tecnologia dos Agronegócios,
Brotas, SP, Brasil. E-mail: [email protected]
1156
Semina: Ciências Agrárias, Londrina, v. 36, n. 2, p. 1155-1168, mar./abr. 2015 Madeira, L. A. et al.
a detecção de 2,0% de FCOB no ovo e suas frações é possível, porém, os tratamentos com inclusão de glúten e levedura não foram diferentes dos tratamentos com inclusão da FCOB. Portanto, a inclusão de 3,0% de glúten e ou levedura na ração, não permite a diferenciação dos valores isotópicos de δ13C e δ15N do ovo e suas frações destes grupos dos que possuem 2,0% FCOB.
Palavras-chave: Carbono-13, glúten de milho, levedura, nitrogênio-15
Introduction
The use of flour containing meat, viscera and
feathers as protein sources as a substitute for soy bran in the diet of monogastric animals is very common in the Brazilian poultry industry. This
flour is relatively low cost and is a good source of nutrients when well processed (MOURA et al., 1994; PEREIRA et al., 1994; BELLAVER
et al., 2001). However, the addition of some ingredients with high protein content may disturb
the traceability of animal-derived flour in the feed
of broilers as detected by stable isotopes.
According to Bellaver et al. (2001), several
important markets such as the European Union and Middle East request that poultry are not fed
with animal-derived products, antibiotics or growth promoting factors. Poultry grown under these restrictions are denoted organic, green and alternative (or natural), and, for this reason, the sugar-cane yeast (Saccharomyces cerevisiae) is widely used in animal feed due to its high protein content and nutraceutical properties.
According to Gottmann et al. (2008), the addition of high amounts of yeast and wheat bran to the feed of broilers disturbs the traceability
of animal-derived flour as measured by stable
isotopes. Kanayama et al. (2012) observed that the use of carbon and nitrogen isotope ratios to trace
animal-derived flours in broiler carcasses may
be affected by the addition of sugar-cane yeast, because, in the case of a 6% supplement, the yeast isotope signature cannot be discriminated from
that of flour made from viscera and meat.
Denadai et al. (2011) detected the addition of 1.5% meat and bone meal in the albumen of
eggs from poultry fed with this ingredient. In this experiment only corn, soy bran and increasing
levels of MBM were used as the main components of the diets. This was to prevent any interference from the addition of more ingredients, even though it is known that other components such as wheat bran, gluten, corn gluten and yeast can be added to the diet of laying hens.
Furthermore, to assess whether the addition of other ingredients affects the detection of MBM,
Denadai et al. (2009) who used 4.5% meat flour
with the addition of 3.0% wheat bran, broken rice, cotton bran, corn gluten, sugar-cane and brewers yeast concluded that the use of stable carbon and nitrogen isotopes allows their detection in eggs and its fractions (yolk and albumen) obtained from laying hens fed with an MBM-containing diet, even after the addition of other vegetal components and yeast. Therefore, the aim of this work was to assess whether the addition of other ingredients such as wheat bran, corn gluten and yeast can affect the traceability of a lower amount (2.0%) of MBM in the diet of laying hens.
Material and Methods
The experiment was performed at the
Aviculture Sector of the Brotas Research and
Development Unit, Department of Development Decentralization, São Paulo’s Agency for
Agribusiness Technology, Secretariat for
1157
Semina: Ciências Agrárias, Londrina, v. 36, n. 2, p. 1155-1168, mar./abr. 2015
Assessment of low amounts of meat and bone meal in the diet of laying hens by using stable isotopes
Twenty-seven-week-old poultry (Bovans White strain) purchased from the Kakimoto aviary in
the city of Alambari/SP (Itapetininga area) were
subjected to an acclimatisation period of 28 days.
The aviary consisted of 40 metallic cages, arranged in two double rows, and a 4.0 m wide,
12.0 m long service corridor specific for egg
production, with galvanized wire screens along the sides equipped with curtains, closed gables and a French tile roof with clerestories.
The cages measured 1.00 × 0.45 × 0.40 m (width × depth × height) and consisted of two internal compartments, with four hens in each,
for a total of eight hens per cage. Each cage was
equipped with a Plasson drinking water dispenser and a gutter feeder was placed in front of the cage. Both water and feed were available ad libitum, and
the artificial lighting program was set as 17 hours
light/day.
We used 256 laying hens randomly distributed among eight treatments, with four repetitions, considering one cage containing eight hens as one repetition.
The treatments consisted of a controlled diet based on corn-soybean-wheat bran meal, and the other diets added consisted of corn gluten and/ or MBM and/or yeast according to the following
specifications:
CSW: Feed based on corn-soybean-wheat;
GLUTEN: Feed based on corn-soybean-wheat
+ corn gluten;
MBM: Feed based on corn-soybean-wheat + 2.0% MBM;
GLUTEN + MBM: Feed based on
corn-soybean-wheat + corn gluten + 2.0% FCOB;
YEAST: Feed based on corn-soybean-wheat +
yeast;
YEAST + MBM: Feed based on
corn-soybean-wheat + yeast + 2.0% MBM;
GLUTEN + YEAST: Feed based on
corn-soybean-wheat + corn gluten + yeast;
GLUTEN + YEAST + MBM: Feed based on
corn-soybean-wheat + corn gluten + yeast + 2.0% MBM.
The additions of corn gluten (3.0%) and yeast (3.0%) were determined following consultations with farmers who currently use these ingredients. Thus, the percentages of these ingredients in the feed were as close as possible to the percentages normally used in the egg industry (Brunelli et al., 2012). The amount of MBM (2.0%) added was slightly higher than the minimum detectable amount, which according to Denadai et al. (2011) is 1.5%.
The protein, calcium, phosphorus, metabolisable energy and amino acid content of
the ingredients used to prepare the experimental
1158
Semina: Ciências Agrárias, Londrina, v. 36, n. 2, p. 1155-1168, mar./abr. 2015 Madeira, L. A. et al.
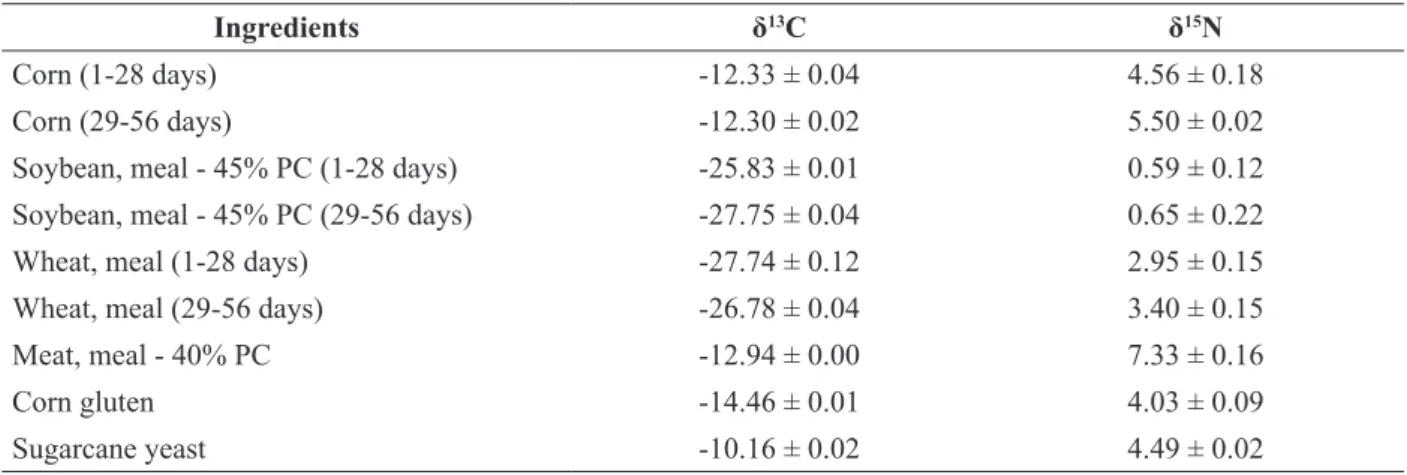
Table 1. Average δ13C and δ15N values with the respective standard deviation (n = 2) of the ingredients used in the experimental diets.
Ingredients δ13C δ15N
Corn (1-28 days) -12.33 ± 0.04 4.56 ± 0.18
Corn (29-56 days) -12.30 ± 0.02 5.50 ± 0.02
Soybean, meal - 45% PC (1-28 days) -25.83 ± 0.01 0.59 ± 0.12 Soybean, meal - 45% PC (29-56 days) -27.75 ± 0.04 0.65 ± 0.22
Wheat, meal (1-28 days) -27.74 ± 0.12 2.95 ± 0.15
Wheat, meal (29-56 days) -26.78 ± 0.04 3.40 ± 0.15
Meat, meal - 40% PC -12.94 ± 0.00 7.33 ± 0.16
Corn gluten -14.46 ± 0.01 4.03 ± 0.09
Sugarcane yeast -10.16 ± 0.02 4.49 ± 0.02
Two distinct lots of corn-soybean-wheat bran
meals were purchased so that the experimental
conditions were as close as possible to those in the aviary, that is, continuous delivery of ingredients obtained from several producers, likely leading to variation in the isotope signature, especially for
the δ15N (‰) values, due to fertilization and soil
conditions. Two rounds of each diet were supplied,
one to feed hens between the 1st and 28th days with
the first lot of corn-soybean-wheat bran meal, and
a second round with the second lot of ingredients between the 29th and 56th days.
1159
Semina: Ciências Agrárias, L
ondrina, v
. 36, n. 2, p. 1155-1168, mar
./abr
. 2015
Assessment of low amounts of meat and bone meal in the diet of laying hens by using stable isotopes
Table 2. Percentage of the ingredients used and calculated nutritional levels of the experimental diets.
Ingredients
Dietas (%)
MST Gluten FCOB Gluten +
FCOB Yeast
Yeast + FCOB
Gluten + Yeast
Gluten + Yeast + FCOB
Corn, grain 58.87 61.33 60.28 59.61 58.19 60.99 60.64 60.99
Soybean, meal (45% PC) 27.35 22.93 25.14 22.83 25.06 18.60 20.63 18.60
Wheat, meal 1.00 1.00 1.00 1.00 1.00 1.00 1.00 1.00
Meat, meal (45% PC) 0.00 0.00 2.00 2.00 0.00 2.00 0.00 2.00
Corn gluten 0.00 3.00 0.00 0.00 0.00 3.00 3.00 3.00
Sugarcane yeast 0.00 0.00 0.00 3.00 3.00 3.00 3.00 3.00
Soybean. oil 1.90 0.84 1.37 1.37 1.90 0.67 0.84 0.00
Limestone 8.70 8.72 8.54 8.55 8.70 8.56 8.72 8.56
Dicalcium phosphate 1.53 1.55 1.02 1.00 1.51 1.02 1.54 1.02
DL-Methionine 0.15 0.13 0.15 0.14 0.14 0.13 0.13 0.13
l-Lysine 0.00 0.00 0.00 0.00 0.00 0.00 0.00 0.00
Choline chloride 0.05 0.05 0.05 0.05 0.05 0.05 0.05 0.05
Salt 0.30 0.30 0.30 0.30 0.30 0.30 0.30 0.30
Vitamin-supplement1 0.10 0.10 0.10 0.10 0.10 0.10 0.10 0.10
Mineral-supplement2 0.05 0.05 0.05 0.05 0.05 0.05 0.05 0.05
Caulim 0.00 0.00 0.00 0.00 0.00 0.53 0.00 0.53
TOTAL 100.00 100.00 100.00 100.00 100.00 100.00 100.00 100.00
Calculated Nutritional Levels
Metabolizable energy (kcal/kg) 2799.95 2800.14 2800.08 2800.00 2799.99 2800.10 2800.10 2800.10
Crude protein (%) 17.50 17.50 17.51 17.50 17.50 17.50 17.50 17.50
Calcium (%) 3.80 3.80 3.80 3.80 3.80 3.80 3.80 3.80
Available phosphorus (%) 0.38 0.38 0.38 0.38 0.38 0.38 0.38 0.38
Crude fiber (%) 2.59 2.43 2.50 2.38 2.47 2.21 2.31 2.21
Methionine (%) 0.43 0.42 0.43 0.42 0.42 0.43 0.43 0.43
Methionine + Cystine (%) 0.71 0.72 0.71 0.70 0.70 0.71 0.72 0.71
Lisina (%) 0.91 0.82 0.89 0.92 0.93 0.83 0.84 0.83
1- Vitamin supplement per kg feed: Vitamin A: 7.000 UI; Vitamin D3: 2.000 UI; Vitamin E: 5 mg; Vitamin K3: 1.6 mg; Vitamin B2: 3 mg; Vitamin B12: 8 µg; Calcium pantothenate:
1160
Semina: Ciências Agrárias, Londrina, v. 36, n. 2, p. 1155-1168, mar./abr. 2015 Madeira, L. A. et al.
Immediately before the experiment was initiated,
16 eggs were sampled, of which eight were used to measure the average isotope signature of the egg
(δ13C = -17.97 ± 0.20 and δ15N = 5.21 ± 0.08) and eight for the isotope signatures of the yolk (δ13C = -17.99 ± 0.11 and δ15N = 4.87 ± 0.15) and albumen (δ13C = -17.96 ± 0.10 and δ15N = 5.28 ± 0.12).
The laying hens received the experimental diet
for 56 days, to substitute the carbon and nitrogen in the tissues responsible for egg production with those
of the new diet. On days 28 and 56t, 16 eggs per
treatment (four for each repetition) were randomly taken, of which eight eggs (two per repetition) were used to harvest yolk and albumen samples, and the remaining eight (two per repetition) were used for total egg sampling. The purpose of performing two samplings (one on day 28 and the other on day 56) was to determine the best day of isotope substitution in the eggs.
The yolks were separated manually from the albumen and the total egg samples (yolk + albumen)
were homogenised using a mixer. Once properly identified, the samples were placed in plastic bags
and frozen at -20°C for subsequent processing.
The samples were prepared at the Stable
Isotope Centre of the UNESP Biosciences Institute,
Botucatu Campus.
The egg, yolk and albumen samples were dried in a ventilation incubator at 56°C for 48 h. Then,
egg and yolk samples were subjected to lipid
extraction in ethylic ether in a Soxhlet instrument
for 4 h. All samples were ground in a cryogenic mill
(Spex-modo 6750 freezer/mill, Metuchen, EUA) at
-196°C for 5 min, with rotation at 920 rpm to obtain
a homogenous material, was a fine powder.
To determine the carbon and nitrogen isotope ratios of the samples (albumen, egg and yolk),
50-60 μg material was weighed inside tin capsules on
a high-sensitivity analytical scale to ascertain the
δ13C, and 500-600 μg for the δ15N measurement.
For the feed, the utilized amount of material
was 60-70 μg and 2100-2200 μg, respectively.
To determine the isotope composition of more naturally abundant samples, we used an isotope-ratio mass spectrometer (Delta V Advantage Isotope
Ratio MS, Thermo Scientific, Germany) coupled
to an Elemental Analyser (Flash 2000 Organic
Elemental Analyzer EA for IRMS), in which, in the
presence of oxygen (O2) and copper oxide (CuO),
the sample is quantitatively burned to obtain CO2.
The gases produced were then separated on a gas chromatography column and analysed using a mass spectrometer.
The isotope ratio values were expressed as the delta (δ) value relative to the Pee Dee Belemnite
(PDB) international standards for 13C and to
atmospheric nitrogen for 15N, according to the
following general equation (1):
δ (sample, standard) = [(Rsample - Rstandard)/Rstandard] × 1000 (1)
Where R represents the ratio between the less abundant and more abundant isotopes, in particular
13C:12C and 15N:14N. Dimensionless.
The isotope data obtained were subjected to
multivariate analysis of variance (MANOVA)
and principal component analysis (PCA) with the
statistics software Minitab 16 (2010), as confirmed
by Sartori et al. (2012) who showed the need to analyse the isotope pair.
Isotopic fractionation was calculated according
to Hobson and Clark (1992) by using the difference
between the δ of the tissue and the diet (equation 2), both for δ13C and δ15N:
∆ = δ tissue - δ diet (2) The negative value in the unit delta (D) indicates
that the tissue is low in 13C compared to the diet
1161
Semina: Ciências Agrárias, Londrina, v. 36, n. 2, p. 1155-1168, mar./abr. 2015
Assessment of low amounts of meat and bone meal in the diet of laying hens by using stable isotopes
The calculated fractionations were subjected
to MANOVA using the statistics package of the
Minitab 16 (2010) software to verify the differences in isotope incorporation between the sampling days (28th and 56th days).
Results and Discussion
The results of the isotope analysis (δ13C and
δ15N) of the feed utilised in this study are shown
in Table 3. It was possible to observe a difference in the values of δ13C and δ15N between the diets
formulated for feed in the periods ranging from
1 to 28 and 29 to 56 experimental days, resulting
from isotope variation in the feed ingredients (Table 1), since two food lots were used. This difference between evaluation days was also seen in eggs and their fractions (Table 3), showing that, isotopically, the animal is consuming, with a variation of around
2‰ for 13C and 3‰ for 15N (DeNIRO; EPSTEIN,
1978).
Furthermore, due to the inclusion of
corn-soybean-wheat (CSW), enrichment in the 13C and
15N isotope values in the diets, as well as in the
eggs and fractions, was seen. This observation
is consistent with other experiments in poultry (ARAUJO et al., 2011; OLIVEIRA et al., 2010; DENADAI et al., 2009; DENADAI et al., 2008; GOTTMANN et al., 2008; MÓRI et al., 2008; CARRIJO et al., 2006).
In the same way that the δ13C value varies,
δ15N in the feed also varies according to the
percentage composition of the ingredients of the diet. The isotope signature of nitrogen in plants
varies depending on how it is fixed. The soybean
has a d15N value close to the standard value of
atmospheric N2 (d15N @ 0.0 ± 1.0‰), as they fix
nitrogen from the air and have a d15N fractionation
value around one unit, being usually below 1.003‰
(KOHL; SHEARER, 1980; HANDLEY; RAVEN, 1992; WERNER; SCHMIDT, 2002). On the other
hand, the d15N value in plants that are not able to
fix atmospheric N2, which is the case for corn, greatly depend on the abundance of this isotope in
the soil, as well as that added to fertilizers (CHOI
et al., 2002).
The isotope fractionation factor for tissue - diet
was calculated in an attempt to find the best day,
after changing the diet, to collect the samples for traceability analysis. The isotope fractionation factor of the eggs and their fractions (Table 4) was different between the collection days (1-28 days and 29-56 days). The difference may have been caused by changing the diet on day 28 and not by the lack of time to allow a new isotopic signature, since Denadai et al. (2006) analysed the isotopic turnover in 120-week-old laying hens and found
that the values of total isotopic exchange of δ13C
varied between 29 and 35 days, depending on the treatment.
As the analysed tissues had low isotope
fractionation, they were a good reflection of the food
1162
Semina: Ciências Agrárias, L
ondrina, v
. 36, n. 2, p. 1155-1168, mar
./abr
. 2015
Madeira, L
. A. et al.
Table 3. Average δ13C and δ15N isotope values (average + SD) of diets (n = 2), eggs, yolks, and albumens (n = 8).
Treatments
Diet Eggs Yolks Albumens
δ13C δ15N δ13C, ‰ δ15N, ‰ δ13C, ‰ δ15N,‰ δ13C,‰ δ15N, ‰
28 days
MST -17.02 ± 0.03 1.91 ± 0.17 -18.59± 0.13 5.05± 0.27 -18.96 ± 0.14 4.89 ±0.18 -18.24 ±0.10 5.06 ±0.09
GLUTEN -15.93 ± 0.11 2.69 ± 0.19 -17.19± 0.11 4.78± 0.13 -17.54 ± 0.19 4.99 ±0.15 -17.08± 0.12 5.35 ±0.19
YEAST -16.27 ± 0.07 2.44 ± 0.08 -17.86± 0.13 5.05± 0.13 -18.57 ±0.14 5.82 ±0.07 -17.82 ±0.16 5.28 ±0.12
GLUTEN + YEAST -16.40 ± 0.18 2.75 ± 0.06 -16.68± 0.16 5.17± 0.13 -16.10 ±0.19 4.91 ±0.16 -16.87 ±0.12 5.58 ±0.12
FCOB -16.50 ± 0.10 2.17 ± 0.03 -18.25± 0.12 4.84± 0.19 -18.47± 0.17 5.44 ±0.18 -17.98 ±0.09 5.40 ±0.09
GLUTEN + FCOB -15.25 ± 0.03 2.76 ± 0.03 -16.86± 0.11 5.63± 0.21 -17.31 ±0.09 5.07 ±0.18 -16.95 ±0.10 5.56 ±0.15
YEAST + FCOB -15.86 ± 0.09 2.72 ± 0.24 -17.23± 0.14 5.24± 0.18 -18.09 ±0.12 5.34 ±0.08 -17.43 ±0.11 5.49 ±0.08
GLUTEN + YEAST + FCOB -15.63 ± 0.04 2.82 ± 0.06 -15.99± 0.22 5.63± 0.19 -17.33 ±0.19 5.66 ±0.14 -16.34 ±0.10 5.42 ±0.14
56 days
CONTROL -17.70± 0.11 1.96 ± 0.13 -18.68± 0.11 4.60± 0.09 -19.26± 0.16 5.45 ±0.10 -18.30 ±0.21 4.33 ±0.12
GLUTEN -16.34 ± 0.09 2.47 ± 0.13 -17.37± 0.15 5.17± 0.18 -17.91± 0.12 5.77 ±0.12 -17.06± 0.13 4.80± 0.10
YEAST -16.53 ± 0.05 2.34 ± 0.04 -18.31 ± 0.11 4.99± 0.09 -18.63 ±0.12 5.75 ±0.14 -18.10 ±0.13 4.53 ±0.08
GLUTEN + YEAST -15.97 ± 0.15 2.47 ± 0.11 -17.31± 0.17 5.20± 0.09 -17.58 ±0.18 5.95 ±0.21 -16.99 ±0.15 4.87 ±0.12
FCOB -16.74 ± 0.15 2.62 ± 0.15 -18.04± 0.12 5.14± 0.12 -18.86 ±0.16 5.97 ±0.09 -18.34 ±0.14 4.92 ±0.09
GLUTEN + FCOB -16.01 ± 0.03 2.90 ± 0.08 -16.86± 0.18 5.52± 0.14 -17.58 ±0.13 6.15 ±0.05 -16.84 ±0.21 5.09 ±0.08
YEAST + FCOB -15.95 ± 0.04 3.23± 0.08 -17.98± 0.24 5.23± 0.09 -18.10 ±0.13 6.17± 0.23 -17.61 ±0.14 4.99 ±0.15
1163
Semina: Ciências Agrárias, Londrina, v. 36, n. 2, p. 1155-1168, mar./abr. 2015
Assessment of low amounts of meat and bone meal in the diet of laying hens by using stable isotopes
Table 4. Isotope fractionation factor between eggs, yolk, and albumen and diet, in laying hens subjected to experimental diets for 1–28 days and 29–56 days.
Treatments
Fracionamento (Δ)
Egg - diet Yolk - diet Albumen - diet
13C 15N 13C 15N 13C 15N
28 days
MST -1.57 3.14 -1.94 2.98 -1.22 3.15
GLUTEN -1.27 2.09 -1.62 2.3 -1.15 2.66
YEAST -1.59 2.61 -2.30 2.47 -1.55 2.84
GLUTEN + YEAST -0.28 2.42 0.29 3.24 -0.47 2.84
FCOB -1.75 2.67 -1.97 2.90 -1.48 3.23
GLUTEN + FCOB -1.61 2.87 -2.06 2.58 -1.70 2.80
YEAST + FCOB -1.37 2.52 -2.24 2.43 -1.57 2.77
GLUTEN + YEAST + FCOB -0.37 2.81 -1.7 3.29 -0.72 2.6
56 days
MST -0.53 2.65 -1.12 3.49 -0.15 2.37
GLUTEN -0.99 2.70 -1.53 3.31 -0.68 2.34
YEAST -1.78 2.65 -2.10 3.42 -1.57 2.19
GLUTEN + YEAST -1.34 2.73 -1.61 3.48 -1.02 2.40
FCOB -1.30 2.52 -2.12 3.35 -1.60 2.30
GLUTEN + FCOB -0.85 2.62 -1.58 3.25 -0.83 2.19
YEAST + FCOB -2.04 2.00 -2.15 2.94 -1.67 1.76
GLUTEN + YEAST + FCOB -1.34 2.45 -1.69 3.91 -1.10 2.43
In the egg, the effect of YEAST treatment was significant according to MANOVA at p < 0.05, and the effects of the other treatments
and fractions were significant at p < 0.01.
The average values of δ13C and δ15N found
in eggs (yolk + albumen), yolk and albumen on day 28 and 56 were statistically analysed and plotted in the graphs shown in Figures 1, 2 and 3, respectively.
The analysis of egg factors on day 28 (Figure 1A) indicated that the CSW treatment was in the same response group as the MBM treatment, and
the latter was in the same group as the YEAST treatment. The group supplied with GLUTEN, YEAST + MBM, GLUTEN + MBM, and GLUTEN + YEAST integrated the undefined response groups.
However, only the treatment consisting of MBM
+ GLUTEN + YEAST did not overlap with the
other treatments, forming a response group with its own samples. Therefore, in this period, three large response groups were formed.
On day 56 (Figure 1B), only the CSW treatment and its respective samples formed a response
group, without being influenced by other groups.
The remaining response groups showed an overlap between the treatments. Consequently, a difference between the groups was observed, thus forming three groups: the CSW group, treatments with
addition of MBM and/or yeast (MBM, YEAST, YEAST + MBM, and GLUTEN + YEAST), and the
treatments with inclusion of meat and bone meal
and/or gluten (GLUTEN, MBM + GLUTEN, and GLUTEN + YEAST + MBM).
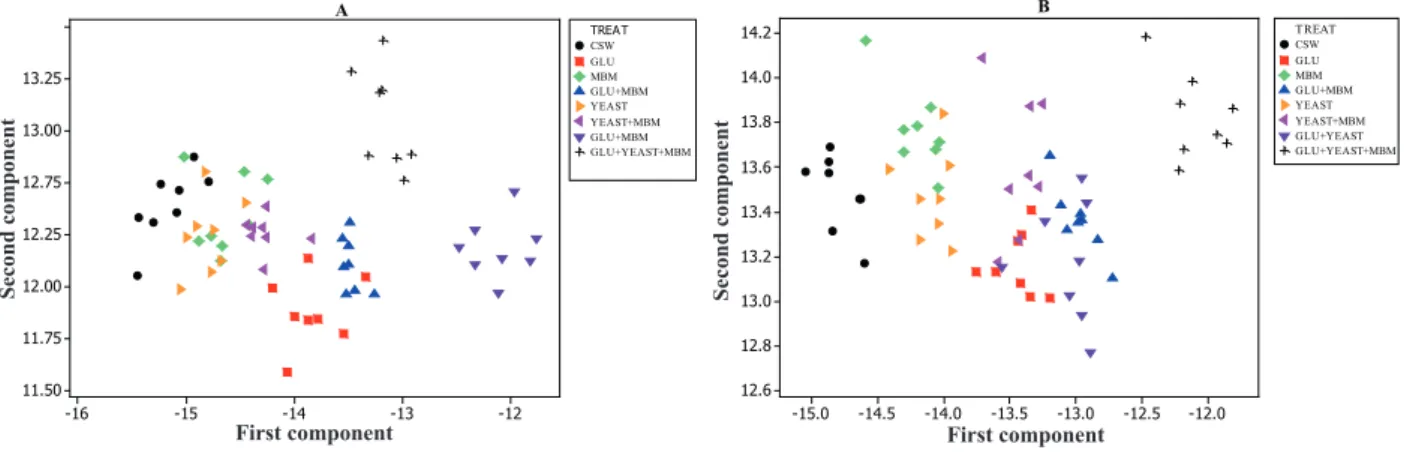
The analysis of yolk collected on day 28 (Figure 2A) resulted in the formation of four response
groups. The first and second groups were formed
by samples from the treatment groups receiving
1164
Semina: Ciências Agrárias, Londrina, v. 36, n. 2, p. 1155-1168, mar./abr. 2015 Madeira, L. A. et al.
possible that the addition of 3% gluten prevented the detection of 2.5% MBM. However, Denadai et al. (2011), when using MBM in the feed of laying hens, were able to detect the addition of 3.0% MBM in the yolk, however a lower level was detected in the albumen (1.5% MBM).
On day 56, the yolk analysis showed more uniform grouping (Figure 2B), in which the
treatments CSW and MBM + GLUTEN + YEAST
and their respective samples formed response groups with no interference from other treatments.
The remaining groups showed the influence of more
than one treatment.
For the albumen collected on day 28 (Figure
3A), the treatments CSW and GLUTEN + YEAST + MBM were not influenced by other
treatments, forming a response group only with their respective samples. The remaining treatments
formed undefined response groups, with significant
interference between each other.
However, on day 56 (Figure 3B), CSW and MBM did not interfere with other treatments, forming a response group with their respective samples. The response group that had received
YEAST was influenced by CSW treatment; however, GLUTEN treatment overlapped with
those including MBM, thus preventing their discrimination. This is consistent with Denadai et
al. (2009), who affirmed that the addition of C4, corn gluten, and yeast led to higher enrichment in the feed, causing the isotope values of the eggs and their fractions to be even more different from the values for the CSW group.
However, Kanayama et al. (2012) observed that the inclusion of 6% sugar-cane yeast in broiler feed containing corn and soybean might interfere with
the traceability of animal-derived flours in the case
of carbon- and nitrogen-stable isotypes. The authors
have also discussed studies involving the detection of 4% to 6% yeast inclusion in the feed.
Gottmann et al. (2008) showed that the
traceability of animal-derived flours in the pectoral
muscle of the broilers, determined by stable isotopes, was disturbed by the presence of yeast and wheat bran.
The analysis of principal components in the albumen fraction, both at 28 and 56 days, led to
the formation of more defined response groups, corroborating the findings of Denadai et al. (2008, 2009), who confirmed that albumen comprised the
fraction that allowed the best detection of MBM additions to plant-derived components and yeast.
However, both in the egg and in its fractions
(albumen and yolk), each group was more defined
at 56 days. The discrepancy in the results between the evaluation days suggests that feeding for only
28 days may not be sufficient for the complete
integration of the diet isotope signature into eggs. This is not consistent with the results of Carrijo et al.
(2000), who concluded that a maximum of 28 days is sufficient to alter the isotope signatures in eggs
from laying hens when using two distinct dietary
components (C3 and C4 grains). Analysing the
pectoral muscle of 42-day-old broilers, Gottmann
et al.(2008) detected the inclusion of 1.5% viscera
flour using discriminating multivariate statistical
analysis, while Oliveira et al. (2010) detected the
inclusion of 8% viscera flour in the feed of 42-day-old broilers by MANOVA analysis.
1165
Semina: Ciências Agrárias, Londrina, v. 36, n. 2, p. 1155-1168, mar./abr. 2015
Assessment of low amounts of meat and bone meal in the diet of laying hens by using stable isotopes
Figure 1. Graph showing the 13C and 15N principal components of egg after 28 (A) and 56 experimental days (B).
-13 -14 -15 -16 -17 10.2 10 9.8 9.6 9.4 9.2 9 First component Se co nd co mp on en t CSW GLU MBM GLU+MBM YEAST YEAST+MBM GLU+YEAST GLU+YEASR+MBM TREA T A -13.5 -14.0 -14.5 -15.0 -15.5 -16.0 -16.5 11.3 11.2 11.1 11.0 10.9 10.8 10.7 10.6 10.5 10.4 First component Se co nd co mp on en t CSW GLU MBM GLU+MBM YEAST YEAST+MBM GLU+YEAST GLU+YEAST+MBM TREA T B
Figure 2. Graph showing the 13C and 15N principal components of yolk after 28 (A) and 56 experimental days (B).
-12 -13 -14 -15 -16 13.25 13.00 12.75 12.25 12.00 11.75 11.50 First Component Se co nd Co mp on en t CSW GLU MBM GLU+MBM YEAST YEAST+MBM GLU+MBM GLU+YEAST+MBM TREA T A -12.0 -12.5 -13.0 -13.5 -14.0 -14.5 -15.0 14.2 14.0 13.8 13.6 13.4 13.2 13.0 12.8 12.6 First Component Se co nd Co mp on en t CSW GLU MBM GLU+MBM YEAST YEAST+MBM GLU+YEAST GLU+YEAST+MBM T REAT B
Figure 3. Graph showing the 13C and 15N principal components of albumen after 28 (A) and 56 experimental days (B).
-15.0 -15.5 -16.0 -16.5 -17.0 -17.5 9.0 8.8 8.6 8.4 8.2 8.0 First Component Se co nd Co mp on en t CSW GLU MBM GLU+MBM YEAST YEAST+MBM GLU+YEAST GLU+YEAST+MBM TREA T A -14.5 -15.0 -15.5 -16.0 -16.5 -17.0 9.50 9.25 9.00 8.75 8.50 First Component Se co nd Co mp on en t CSW GLU MBM GLU+MBM YEAST YEAST+MBM GLU+YEAST GLU+YEAST+MBM TREA T B
Second component Second component
1166
Semina: Ciências Agrárias, Londrina, v. 36, n. 2, p. 1155-1168, mar./abr. 2015 Madeira, L. A. et al.
Conclusions
The detection of 2.0% MBM in the egg and its fractions (albumen and yolk) was possible. However, the effect of corn gluten and yeast addition to the diet of lying hens was not different from that obtained with the addition of MBM.
The addition of 3.0% corn gluten and/or yeast to the diet of laying hens did not allow for the
differentiation of the isotope values of δ13C and δ15N
in the egg and its fractions (albumen and yolk) for the groups in which 2.0% MBM was included.
Acknowledgements
To FAPESP Thematic Project 2008/57411-4.
Referências
ARAUJO, P. C.; SARTORI, J. R.; CRUZ, V. C.; PEZZATO, A. C.; DUCATTI, C.; STRADIOTTI, A. C.; PELICIA, V. C. Rastreabilidade de farinha de vísceras de aves por isótopos estáveis em penas de frangos de corte.
Pesquisa Agropecuária Brasileira, Brasília, v. 46, n. 5, p. 538-545, 2011.
BELLAVER, C.; BRUM, P. A. R.; LIMA, G. M. M.; BOFF, J.; KERBER, J. Substituição parcial do farelo de soja pela farinha de vísceras de aves em dietas balanceadas com base na proteína e em aminoácidos totais ou digestíveis para frangos de corte. Revista Brasileira de Ciência Avícola, Campinas, v. 3, n. 3, p. 233-240, 2001.
BRUNELLI, S. R.; PINHEIRO, J. W.; FONSECA, N. A. N.; SILVA, C. A. Efeito de diferentes níveis de farelo de gérmen de milho desengordurado em dietas suplementadas com fitase para poedeiras comerciais.
Semina: Ciências Agrarias, Londrina, v. 33, n. 5, p. 1068-1063, 2012.
CARRIJO, A. S.; PEZZATO, A. C.; DUCATTI, C. Avaliação do metabolismo nutricional em poedeiras pela técnica dos isótopos estáveis do carbono (13C/12C).
Revista Brasileira de Ciência Avícola, Campinas, v. 2, n. 3, p. 209-218, 2000.
CARRIJO, A. S.; PEZZATO, A. C.; DUCATTI, C.; SARTORI, J. R.; TRINCA, L.; SILVA, E. T. Traceability of bovine meat and bone meal in poultry by stable isotope analysis. Revista Brasileira de Ciência Avícola, Campinas, v. 8, n. 1, p. 37-42, 2006.
CHOI, W. J.; LEE, S. M.; RO, H. M.; KIM, K. C.; YOO, S. H. Natural 15N abundances of maize and soil amended with urea and composted pig manure. Plant and Soil, The Hague, v. 245, n. 2, p. 223-232, 2002.
DENADAI, J. C.; DUCATTI, C.; PEZZATO, A. C.; CARRIJO, A. S.; CALDARA, F. R.; OLIVEIRA, R. P. Studies on carbon-13 turnover in eggs and blood of commercial layers. Revista Brasileira de Ciência Avícola, Campinas, v. 8, n. 1, p. 251-256, 2006.
DENADAI, J. C.; DUCATTI, C.; SARTORI, J. R.; PEZZATO, A. C.; MORI, C.; GOTTMANN, R. Rastreabilidade da farinha de carne e ossos bovinos em ovos de poedeiras comerciais pela técnica dos isótopos estáveis do carbono e nitrogênio. Revista Brasileira de Zootecnia, Viçosa, MG, v. 40, n. 6, p. 2760-2766, 2011.
DENADAI, J. C.; DUCATTI, C.; SARTORI, J. R.; PEZZATO, A. C.; MÓRI, C.; GOTTMANN, R.; MITUO, M. A. O.; BORDINHON, A. M. The traceability of animal meals in layer diets as detected by stable carbon and nitrogen isotope analysis of eggs. Brazilian Journal of Poultry Science, Campinas, v. 10, n. 2, p. 189-194, 2008. DENADAI, J. C.; DUCATTI, C.; SARTORI, J. R.; PEZZATO, A. C.; MÓRI, C.; GOTTMANN, R.; MITUO, M. A. O. Rastreabilidade da farinha de carne e ossos bovinos em ovos de poedeiras alimentadas com ingredientes alternativos. Pesquisa Agropecuária Brasileira, Brasília, v. 44, n. 9, p. 1-7, 2009.
DeNIRO, M. J.; EPSTEIN, S. Influence of diet on the distribution of carbon isotopes in animals. Geochimica et Cosmichimica Acta, London, v. 42, n. 2, p. 495-506, 1978.
GOTTMANN, R.; PEZZATO, A. C.; DUCATTI, C.; DENADAI, J. C.; MITTUO, M. A. O.; MÓRI, C.; SARTORI, J. R. Rastreabilidade de subprodutos de origem animal em dietas com levedura e trigo para frangos. Pesquisa Agropecuária Brasileira, Brasília, v. 43, n. 12, p. 1641-1647, 2008.
HANDLEY, L. L.; RAVEN, J. A. The use of natural abundance of nitrogen isotopes in plant physiology and ecology. Plant, Cell and Environment, Malden, v. 15, n. 4, p. 965-985, 1992.
HOBSON, K. A.; CLARK, R. G. Assessing avian diets using stable isotopes I: turnover of 13C in tissues. The
1167
Semina: Ciências Agrárias, Londrina, v. 36, n. 2, p. 1155-1168, mar./abr. 2015
Assessment of low amounts of meat and bone meal in the diet of laying hens by using stable isotopes
KOHL, D. H.; SHEARER, G. Isotopic fractionation associated with symbiotic N2 fixation and uptake of NO3 by plants. Plant Physiology, Illinois, v. 66, n. 1, p. 51-56,
1980.
MINITAB Statistical Software [computer program], version 16. State College, PA: Minitab Inc, 2010. MÓRI, C.; GARCIA, E. A.; DUCATTI, C.; DENADAI, J. D.; PELICIA, K.; GOTTMANN, R.; MITUO, M. A. O. Poultry offal meal traceability in meat quail tissues using the technique of stable carbon (13C/12C) and nitrogen (15N/14N) isotopes. Brazilian Journal of Poultry Science, Campinas, v. 10, n. 1, p. 45-52, 2008.
MOURA, C. C.; DONZELE, J. L.; MELLO, H. V.; COSTA, P. M. A.; TAFURI, M. L. Farinha de penas e sangue em rações para suínos em crescimento. Revista Brasileira de Zootecnia, Viçosa, MG, v. 23, n. 4, p.
632-641, 1994.
OLIVEIRA, R. P.; DUCATTI, C.; PEZZATO, A. C.; DENADAI, J. C.; CRUZ, V. C.; SARTORI, J. R.; CARRIJO, A. S.; CALDARA, F. R. Traceability of poultry offal meal in broiler feeding using isotopic analysis (δ13C and δ15N) of different tissues. Brazilian Journal of Poultry
Science, Campinas, v. 12, n. 5, p. 13-20, 2010.
ROSTAGNO, H. S.; ALBINO, L. F. T.; DONZELE, J. L.; GOMES, P. C.; OLIVEIRA, R. F.; LOPES, D. C.; FERREIRA, A. S.; BARRETO, S. L. T. Tabelas brasileiras para aves e suínos: composição de alimentos
e exigências nutricionais. Viçosa: UFV, 2005. 186 p. SARTORI, M. M. P.; DENADAI, J. C.; LIMA, G.; AMÉLIA, M.; CARRIJO, A. S.; DUCATTI, C. Multivariate analysis of stable isotope data in the traceability process for birds. Acta Scientiarum Animal Science, Maringá, v. 34, n. 4, p. 437-442, oct./dec. 2012.
WERNER, R. A.; SCHMIDT, H. L. The in vivo nitrogen isotope discrimination among organic plant compounds.
1168