* Corresponding author:
E-mail: patricia_pertile@hotmail. com
Received: August 25, 2015
Approved: January 15, 2016
How to cite: Pértile P, Reichert JM, Gubiani PI, Holthusen D, Costa A. Rheological Parameters
as Affected by Water Tension in
Subtropical Soils. Rev Bras Cienc Solo. 2016;40:e0150286.
Copyright: This is an open-access article distributed under the
terms of the Creative Commons Attribution License, which permits
unrestricted use, distribution, and reproduction in any medium, provided that the original author and source are credited.
Rheological Parameters as
Affected by Water Tension in
Subtropical Soils
Patricia Pértile(1)*
, José Miguel Reichert(1)
, Paulo Ivonir Gubiani(1)
, Dörthe Holthusen(2) and André da Costa(3)
(1) Universidade Federal de Santa Maria, Centro de Ciências Rurais, Departamento de Solos, Santa Maria, Rio Grande do Sul, Brasil.
(2) Christian-Albrechts-Universitä zu Kiel, Institute of Plant Nutrition and Soil Science, Kiel, Schleswig-Holstein, Germany.
(3) Instituto Federal de Educação, Ciência e Tecnologia,
Campus Rio do Sul, Santa Catarina, Brasil.
ABSTRACT: Rheological parameters have been used to study the interaction between particles and the structural strength of soils subjected to mechanical stresses, in which soil composition and water content most strongly affect soil resistance to deformation. Our objective was to evaluate the effect of water tension on rheological parameters of soils with different mineralogical, physical, and chemical composition. Surface and subsurface horizons of four Oxisols, two Ultisols, one Alfisol, and one Vertisol were physically and chemically characterized; their rheological parameters were obtained from amplitude sweep tests under oscillatory shear on disturbed soil samples that were saturated and subjected to water tension of 1, 3, 6, and 10 kPa. In these samples, the rheological parameters linear viscoelastic deformation limit (γL), maximum shear stress (τmax), and integral z were determined. By simple regression analysis of the rheological parameters as a function of soil water tension, we observed increased mechanical strength with increasing water tension up to at least 6 kPa, primarily due to increased capillary forces in the soil. However, increased elasticity assessed by γL was not as expressive as the increase in structural rigidity assessed by τmax and integral z. Elastic deformation of the soil (γL) increases with the increase in the number of bonds among particles, which depend on the clay, total carbon, expansive clay mineral, and cation contents; however, maximum shear resistance (τmax) and structural stiffness (integral z) mainly increase with clay, kaolinite, and oxide content by increasing the strength of interparticle bonds. A decrease in mechanical strength occurs for water tension of 10 kPa (the lowest water content evaluated) in sandy horizons or in horizons with a high proportion of resistant microaggregates (pseudosand), when associated with low bulk density, due to fewer points of contact between soil particles and therefore lower capillary force.
INTRODUCTION
Soil physical degradation from external stresses increases with decreasing structural strength of soil (Horn, 2003). Traditional techniques such as direct shear and static compressibility are widely used for determining mechanical parameters by stress-strain relations correlated with structural properties on the scale of aggregates, such as soil density and porosity and aggregate stability. As these properties depend on soil composition, such as particle size distribution, mineralogy, and organic matter content (Horn and Peth, 2011), the traditional techniques are limited in their ability to clearly determine soil behavior caused by mechanisms acting on a particle scale (Markgraf et al., 2006).
Rheometry is a technique that has been used to access soil reaction to external stress derived from intergranular bonds, quantifying soil structural strength with stress-strain relationships (Markgraf and Horn, 2006, 2007; Khaydapova et al., 2015). Thus, rheometry allows soil deformation to be related to particle size and mineralogy, concentration and type of ions, soil organic matter (SOM), and water content (Markgraf and Horn, 2009). Particle arrangement during soil deformation is affected primarily by water content. At high water content, friction between soil particles is reduced and the stresses applied first overcome cohesion among water molecules and then the stronger cohesion that exists among solid constituents (Ghezzehei and Or, 2001; Markgraf et al., 2006). A decrease in soil water content strengthens the bonds among soil particles by an increase in cohesive forces, friction between particles, and capillary forces (adhesion) due to water surface tension and the number and curvature of menisci (Kemper and Rosenau, 1984; Gallipoli et al., 2003; Mitchell and Soga, 2005; Lourenço et al., 2012).
Soil water tension (suction) is the manifestation of these capillary forces (Santamarina, 2003). As the soil dries, water recedes in capillaries between particles and aggregates, and adhesion forces and surface tension on water menisci pull adjacent particles at high force (Kemper and Rosenau, 1984; Lourenço et al., 2012). However, capillary force depends on soil composition. In clay soils, which have smaller diameter pores, adhesion forces and capillarity are higher (Horn and Peth, 2011; Lourenço et al., 2012), while in very coarse soils, the number of menisci, and thus capillary force, can decline sharply at water tension higher than 6 kPa (Holthusen et al., 2012b), due to larger pore size. With reduction in soil water content, there is an increase in cohesion due to an increase in concentration of soluble constituents in the liquid phase, such as carbonates and organic molecules, which may precipitate between particles and aggregates as semi-crystalline inorganic compounds or organic amorphous compounds (Kemper and Rosenau, 1984; Kemper et al., 1987; Mitchell and Soga, 2005). Soils display cohesion because of connections of particles through cations bridges, electrostatic attraction among clay particles, and attraction between soil particles and between water and soil particles by van der Waals forces (Kemper and Rosenau, 1984; Libardi, 2010), as well as the cementing effects of organic substances and iron and aluminum oxides (Reichert et al., 2010; Kämpf et al., 2012). Therefore, soil cohesiveness increases mainly due to decreasing particle size and increasing content of expansive clay minerals (Kemper and Rosenau, 1984; Kemper et al., 1987), SOM content, and contact area between particles (Reichert et al., 2010).
2012; Baumgarten et al., 2012). The increase in water tension from 0 to 3 kPa is sufficient to significantly increase soil shear strength as a result of stabilization of menisci, salt precipitation, and increased friction between particles (Holthusen et al., 2010).
All these factors and processes intervene in the links between particles and aggregates (Mitchell and Soga, 2005), modifying soil structural strength. However, for different Brazilian soils, little has been investigated about microstructural resistance based on rheometry. Thus, we aimed to assess the effect of water tension on rheological parameters of soils from southern Brazil with different mineralogical, physical, and chemical composition.
MATERIALS AND METHODS
Study areaThe study was conducted with samples of eight soils of different classes from southern Brazil, with a humid subtropical climate according to the Köppen classification system. Soils widely varying in particle size and mineralogy were chosen, belonging to the orders Latossolo/Oxisol (four soils), Argissolo/Ultisol (two soils), Planossolo/Alfisol (one soil) and Vertissolo/Vertisol (one soil), as described in table 1.
Table 1. Classification, symbol, coordinates, horizons, depth, and physical and chemical characterization of eight studied soils SiBCS/USDA(1)
Symbol Coordinates Horizons(2) Depth Sand Silt Clay TC Al3+ Ca2+ Mg2+ PL LL PI ρs (5)
m g kg-1
cmolc kg -1
Mg m-3
Latossolo Vermelho
Distrófico típico/Oxisol
LVd1 28°58’43,81”S
53°38’38,11”W Ap 0.00-0.35 774 71 155 11.0 0.3 1.1 1.9 16 21 4 1.33
Bw1 1.05-1.52 649 77 274 4.2 1.2 0.5 1.1 18 25 7 1.43
Latossolo Vermelho
Distrófico típico/Oxisol
LVd2 28°38’17,83”S
53°5’6,91”W A1 0.00-0.26 160 237 603 23.2 1.6 2.4 1.8 38 48 10 0.91 Bw1 1.00-1.38 84 114 802 6.4 1.0 2.2 1.3 41 54 13 1.18
Latossolo Bruno
Distroférrico rúbrico/Oxisol
LBdf1 28°22’34,00”S
51°4’52,43”W Ap 0.00-0.30 63 232 705 34.4 1.3 4.6 3.2 37 54 16 0.98 Bw1 0.95-1.50 48 143 809 5.0 0.8 0.7 1.2 50 62 12 1.08
Latossolo Bruno
Distroférrico típico/Oxisol
LBdf2 28°30’38,09”S
50°52’46,15”W A1 0.00-0.26 70 381 549 33.6 0.2 6.4 4.9 41 56 16 1.10 Bw1 0.80-1.00 39 178 783 11.4 1.4 0.5 0.9 40 51 11 1.13
Argissolo Vermelho
Distrófico típico/Ultisol
PVd1 29°51’59,41”S
52°50’23,13”W A 0.00-0.40 671 170 159 5.7 1.0 0.6 1.5 14 18 4 1.62
Bt 1.10-1.55 429 146 425 5.4 1.6 1.4 2.0 24 34 10 1.48
Argissolo Vermelho
Distrófico arênico/Ultisol
PVd2 30°41’25,23”S
55°7’50,11”W A1 0.00-0.20 844 99 57 6.2 0.1 1.1 0.8 - 13 - 1.66 Bt1 0.77-0.98 507 73 420 5.0 1.4 2.9 1.3 23 38 14 1.67
Planossolo
Háplico Eutrófico êndico/Alfisol
SXe 30°15’44,10”S
54°32’23,89”W A1 0.00-0.30 624 267 109 9.5 3.1 1.6 1.3 16 18 2 1.50 Btg 0.70-1.20 417 188 395 4.5 0.7 8.1 2.7 24 41 17 1.48
Vertissolo
Ebânico Órtico típico/Vertisol
VEo 30°43’9,00”S
55°47’38,56”W A 0.00-0.30 41 406 553 44.1 0.1 33.8 8.6 49 90 41 0.94 Biv 0.30-1.15 28 305 667 32.1 0.1 47.8 8.5 42 98 56 1.06
(1)
Classification by the Sistema Brasileiro de Classificação de Solos (Brazilian Soil Classification System) - SiBCS (Santos et al., 2013) and by Soil Taxonomy (USDA, 2010). (2)
Sample collection and preparation
Soil samples were collected in profiles described in other studies. The samples were collected in the middle of the A and B horizons, air-dried, ground, and sieved through a 2 mm mesh. With this soil fraction, analyses were performed to characterize chemical and physical properties (Table 1) and execute rheological analysis, as described below.
Rheometry
Rheological analyses were performed by the amplitude sweep test with controlled deformation using a compact modular rheometer (Anton Paar MCR 102, Austria) fitted with a parallel plate measuring device: a fixed roughened bottom plate of 50 mm diameter and a top roughened rotating plate of 25 mm diameter (model PP25/P2).
The soil samples for testing were prepared by moistening the soil to between 10 and 30 % of gravimetric water content and keeping them in a sealed bag for about 16 h. Moist soil was compacted into rings of approximately 3.6 cm diameter and 1.0 cm height so that the bulk density (ρs) of the samples (15 for each horizon) equaled the average of ρs observed in the field (Table 1). The samples were then saturated with destilled water by capillarity. Three samples from each horizon (group 1) remained saturated and the other samples formed groups 2, 3, 4, and 5, each with three samples, which were drained to the water tensions (wt) of 1, 3, 6, and 10 kPa, respectively, on a sand tension table (Reinert and Reichert, 2006). Samples were only drained to tensions of up to 10 kPa because in rheological tests if the soil water content is small, the sample cannot deform homogeneously, which can introduce errors in the parameters obtained (Mezger, 2014). The samples were subsequently placed on the lower plate of the rheometer, extracted from the ring, and cut horizontally and vertically to an approximate height of 4.5 mm and diameter of 25 mm. This procedure was performed immediately before the test to adjust the sample diameter to the diameter of the top plate and the gap (space between the measuring plates) and avoid possible effects from the surrounding soil (Holthusen et al., 2010).
The amplitude sweep tests were performed under the following conditions: constant temperature = 20 °C; sample height (gap) = 4 mm; rest period before beginning the test = 30 s; variation of amplitude of deformation = 0.0001 at 100 %; angular frequency = 0.5 Hz; and number of measuring points = 30. The normal force does not exceed 12 N at the beginning of the test (for obtaining a soil-to-plate contact) and tends to 0 N at the end of the test. The test duration is about 14 min, which leads to low water loss of the sample. Samples with water loss greater than 10 % gravimetric water content, measured as water loss from before to after testing, were disposed. Furthermore, the first three points of the 30 measurement points where the deflection angle (φ) is less than 1 μrad were excluded due to the lack of sensitivity of the rheometer used.
Rheological tests were controlled and executed automatically by the software Rheoplus/32 V3.62 Anton Paar. Deformation (γ, %) was determined by the relationship between the deflection (s, m) in the outer edge and height of the sample (h, m) (Equation 1); shear stress (τ, Pa) was calculated using the torque (M, m N) measured in each γ and the radius of the upper plate (r, m) (Equation 2); and phase shift angle (δ, °) was determined by displacement of the τ response curve in relation to the γ curve.
γ = s 100
h Eq. 1
τ = 2 Mπ r3 Eq. 2
G' = τ cosδ
γ Eq. 3
G'' = τ senδ
γ Eq. 4
tan δ = G''
G' Eq. 5
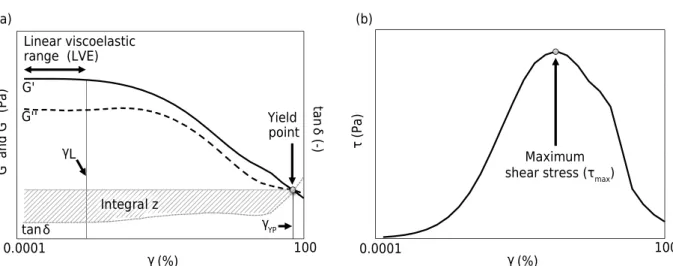
The G’ and G” moduli, tan δ, and τ can be presented graphically as a function of γ (Figure 1), where the maximum τ during the test (τmax) is obtained from the γ versus τ curve (Figure 1b). The deformation limit (γL) was calculated as the γ in which a difference of 5 % occurs in G’ with respect to their values in the linear viscoelastic range (LVE range) (Figure 1a). The integral z (dimensionless) was calculated as the sum of the area defined, in the lower limit, by the tan δ curve from the lower applied deformation (here γ ≈ 0.0001%) until the yield point where tan δ = 1 and, in the upper limit, by the line parallel to the abscissa and with ordered tan δ = 1 (Figure 1a).
Other rheological parameters obtained from the amplitude sweep test, such as the τ at γL, and the γ and the value of G’= G” at the yield point – described by Markgraf and Horn (2007) and Holthusen et al. (2010) – were not used in this study due to high collinearity with the parameters γL, τmax, and integral z.
Statistical analyses
The set of rheological data was analyzed separately for each horizon, resulting in 16 experiments (16 horizons) in a completely randomized design, with water tension (wt) as the quantitative factor with levels 0, 1, 3, 6, and 10 kPa. The results of these experiments were subjected to normality analysis by the Shapiro-Wilk test (p<0.05), to homogeneity of error variances by the Bartlett test (p<0.05), and to variance by the F test (p<0.05). When the F test was significant, simple regression analysis was performed. These analyses were performed using SAS 9.2 software (SAS, 2010). Variables without normal distribution or homogeneity of variance were subjected to the Box-Cox transformation using Action software (Equipe Estatcamp, 2014). Spearman correlation analysis (p<0.05) between the rheological parameters and plastic limit (PL), liquid limit (LL), and plasticity index (PI) was also performed using the SAS 9.2 software (SAS, 2010).
Figure 1. Representative illustration of information obtained from the amplitude sweep test: storage modulus (G’), loss modulus (G”), and loss factor (tan δ) versus deformation (γ), plotted on a logarithmic scale (a), and shear stress (τ) versus deformation (γ) (b). Source: adapted from Horn and Peth (2011) (a) and Holthusen et al. (2012b) (b).
γ (%)
tan
δ
(-)
G' and G" (Pa)
G'' G'
tan
Yield point
0.0001 100
Linear viscoelastic range (LVE)
L (a)
Integral z
γ
YP
γ (%)
τ
(Pa)
0.0001 100
Maximum shear stress (τmax) (b)
γ
RESULTS AND DISCUSSION
Soil water tension (wt) did not affect the linear viscoelastic deformation limit (γL) of most horizons. There was a linear increase in γL, with increasing wt only for the LVd2 A1, LBdf1 Ap, PVd1 Bt, SXe Btg, and VEo A horizons (Figure 2); i.e., the decrease in water content retained in the soil increased the range of elastic deformation of these horizons, where the most intense effect was for LBdf1 Ap. This result is partly due to the higher clay content of these horizons (Table 1). The greater the clay content and activity (such as smectite), the greater the expression of cohesion and adhesion forces (Reichert et al., 2010), increasing the contacts and linkages between particles with increasing wt (Kemper and Rosenau, 1984). Furthermore, the increase in clay-water attraction by van der Waals forces decreases the contact angle of water menisci with clay particles to near zero, thus increasing wetting and capillary forces (Lourenço et al., 2012; Amarasinghe et al., 2014). In sandy soils, such as in the top (A) horizons of LVd1, PVd1, PVd2, and SXe (Table 1), this phenomenon is less pronounced (Lourenço et al., 2012).
The highest values of γL were observed in LVd2 A1, LBdf1 Ap, LBdf2 A1 (without significant increase with increasing wt in the last horizon), and VEo A and Biv (Figure 2), which are associated with greater total carbon (TC) content (23 to 44 g kg-1) (Table 1). Organic compounds increase soil aggregation and resistance (Zhang and Hartge, 1990; Markgraf et al., 2012; Buchmann et al., 2015) by augmenting cohesion and number of menisci in unsaturated conditions (Zhang and Hartge, 1990; Bachmann and Zhang, 1991). Furthermore, with increasing wt, organic compounds and salts are precipitated in contact areas between particles and aggregates, increasing soil resistance to deformation (Soulié et al., 2007; Holthusen et al., 2010). The increase in soil mechanical stability with increasing SOM is in accordance with the findings of Markgraf and Horn (2007), who observed a decrease in γL after removal of SOM by oxidation of Oxisols from RS. In the same horizons (LVd2 A1, LBdf1 Ap, LBdf2 A1, and VEo A and Biv), higher γL (Figure 2) are also associated with greater cation content (Table 1), corroborating results of Holthusen et al. (2010). An increase in polyvalent cations such as Al3+
, Ca2+, and Mg2+
decreases the repulsive forces between negatively charged particles by reducing the diffuse double layer (Singh and Uehara, 1998), bringing clay particles, oxides, and organic molecules to link and forming bridges that bond silt and sand particles (Bronick and Lal, 2005). Furthermore, with decreasing soil moisture, cations are strongly held in negatively charged clay particles and cations in excess or associated with anions may precipitate as salts (Baumgarten and Horn, 2013), which increases the number of bonds between soil particles.
Higher γL also occurred in both horizons of VEo because of the significant presence of smectite (Albuquerque et al., 2000), an expansive 2:1 lattice type clay mineral that increases soil plasticity (Table 1), which allowed the soil to resist greater deformations (Khaydapova et al., 2015). In contrast, the kaolinite predominant in the clay fraction in the others soils of this study (445 to 638 g kg-1
of clay fraction, data not shown) collapses already at lower deformations (Khaydapova et al., 2015), although it establishes stronger links between particles (Kämpf et al., 2012). The results of Markgraf and Horn (2007), indicating higher γL in a Vertisol compared to Oxisols, also show the collapse of structure at lower deformations of kaolinitic soils. In VEo, the adsorbed water and the cations in the soil solution, and on surfaces and in the interlayer of expansive clays increase soil elasticity (Mitchell and Soga, 2005; Markgraf et al., 2006), represented by γL (Figure 2), due to the increase in capillary forces and electrostatic and molecular forces (Mitchell and Soga, 2005; Markgraf and Horn, 2006). According to Kemper et al. (1987), smectite particles saturated with Ca2+
Figure 2. Deformation limit (γL) as a function of soil water tension (wt) for A horizons (black symbols) and B horizons (red symbols)
of Latossolos/Oxisols (LVd1, LVd2, LBdf1, LBdf2), Argissolos/Ultisols (PVd1, PVd2), Planossolo/Alfisol (SXe), and Vertissolo/Vertisol (VEo). *, ** and ***: significant at 5, 1 and 0.1 %, respectively; ns: not significant.
ns ns
ns ns LVd1
ŷ = 0.0081 + 0.0004*** x (R2 = 0.73) ns
ŷ = 0.0102 + 0.0031*** x (R2 = 0.83) ns
ns ns ns
ŷ = 0.0050 + 0.0002*** x (R2 = 0.88)
ns
ŷ = 0.0078 + 0.0003*** x (R2 = 0.53)
ŷ = 0.0408 + 0.0010*** x (R2 = 0.74) ns
LVd2
LBdf1 LBdf2
PVd1 PVd2
SXe
wt (kPa) wt (kPa)
0 1 3 6 10 0 1 3 6 10
wt (kPa) wt (kPa)
0 1 3 6 10 0 1 3 6 10
wt (kPa) wt (kPa)
0 1 3 6 10 0 1 3 6 10
wt (kPa) wt (kPa)
0 1 3 6 10 0 1 3 6 10
VEo 0.00 0.01 0.02 0.03 0.04 0.05 0.06 0.00 0.01 0.02 0.03 0.04 0.05 0.06 0.00 0.01 0.02 0.03 0.04 0.05 0.06
уL (%
)
уL (%
) 0.00 0.01 0.02 0.03 0.04 0.05 0.06
уL (%
)
уL (%
) 0.00 0.01 0.02 0.03 0.04 0.05 0.06 0.00 0.01 0.02 0.03 0.04 0.05 0.06 0.00 0.01 0.02 0.03 0.04 0.05 0.06 уL (%
)
уL (%
) 0.00 0.01 0.02 0.03 0.04 0.05 0.06
уL (%
)
уL (%
(Table 1). These results are similar to those obtained by Holthusen et al. (2010), who suggest that the increase in effective stress of the menisci, the cemented bonds due to precipitation of salts, and the number of contact areas between particles resulting from soil water drainage are mechanisms responsible for increase in τmax. Thus, besides the existence of adhesion forces on the particle-water-air interface, the water strongly adsorbed on the surfaces of minerals by hydrogen bonds or held by osmotic forces associated with cations in the diffuse layer tends to maintain the mineral particles in direct contact (Kemper et al., 1987), increasing the cohesive forces. This increase in cohesion with increasing wt tends to be higher in clayey soils than in silty and sandy soils, corroborating the results of Kemper and Rosenau (1984). As observed in our soils (Figure 3), increased mechanical strength with increasing depth in different soils is due to greater clay content in subsurface horizons compared to surface horizons (Table 1); this was also observed by Markgraf and Horn (2006) and Baumgarten et al. (2012).
For the LBdf1 Bw1 and LBdf2 A1 horizons, however, τmax increases until wt of 6 kPa and decreases for wt of 10 kPa. The point of maximum τmax at 6 kPa in these soils is possibly due to the combination of low ρs (Table 1) with the occurrence of a strong and resistant granular microstructure, whose aggregates have a diameter similar to the diameter of the sand fraction particles, called pseudosand (visually observed and checked by tactile sensation according to Santos et al., 2005). This combination reduces the number of contact points within a given volume of soil and, consequently, reduces the number of menisci and the effective stress (Horn, 2003; Gallipoli et al., 2003; Reichert et al., 2010). The effective stress defines the forces that can stabilize the soil particles against deformations (Horn and Peth, 2011). In spherical particles, like sand and pseudosand aggregates, the capillary force is smaller than in colloidal particles (Chatterjee et al., 2012), because there is no continuous water film with a predominantly concave shape (negative water pressure) responsible for particles binding (Lourenço et al., 2012). A large formation of pseudosand in the Latossolos Brunos (Typic Hapludox) in this study is derived from high Fe oxide content, predominantly goethite (data not shown).
In structured samples of coarse texture (≈650 g kg-1 of sand), Holthusen et al. (2012b) observed an increase in τmax with an increase in wt up to 3 kPa and a subsequent decrease at 6 kPa, whereas in homogenized samples, the τmax of the same substrate increased from 0 to 6 kPa. According to the authors, the substrate aggregation formed pseudosand particles and, thus, greater drainage reduced the number of menisci more than the increase in the individual forces of the menisci. Similarly, Zhang and Hartge (1990) observed an increase in cohesion of a sandy soil with different SOM contents in the wt range of 4 to 7 kPa, and a decrease in cohesion occurred with the additional increase in wt up to 30 kPa. Greater resistance is observed when the soil is at intermediate water contents because the wt is sufficient to approximate particles and there is still water to displace ions and molecules for low-energy binding sites on the surface of the particles (Kemper et al., 1987). Among these forces, the stabilizing forces depend mainly on the water menisci between particles instead of electrostatic forces (Holthusen et al., 2010).
Figure 3. Maximum shear stress (τmax) as a function of soil water tension (wt) for A horizons (black symbols) and B horizons (red symbols)
of Latossolos/Oxisols (LVd1, LVd2, LBdf1, LBdf2), Argissolos/Ultisols (PVd1, PVd2), Planossolo/Alfisol (SXe), and Vertissolo/Vertisol (VEo). *, ** and ***: significant at 5, 1 and 0.1 %, respectively; ns: not significant.
LVd1
ŷ = 310 + 261*** x (R2 = 0.69) ŷ = 632 + 460*** x (R2 = 0.95)
LVd2
ŷ = 405 + 271*** x (R2 = 0.88) ns
wt (kPa)
0 1 3 6 10 0 1 3 6 10
SXe
ŷ = -40 + 300*** x (R2 = 0.91) ŷ = 1072 + 625*** x (R2
= 0.81)
VEo
0 1 3 6 10 0 1 3 6 10
ŷ = -45 + 510*** x (R2 = 0.96) ŷ = 72 + 502*** x (R2
= 0.93)
0 1 3 6 10 0 1 3 6 10
PVd1 ns
ŷ = 2286 + 1000** x - 58* x2 (R2 = 0.75)
PVd2
ŷ = 510 + 156** x (R2 = 0.51) ns
LBdf2
0 1 3 6 10 0 1 3 6 10
LBdf1 τma x (Pa ) τma x (Pa ) 0 2000 4000 6000 8000 10000 2000 4000 6000 8000 10000 0 τma x (Pa ) 0 2000 4000 6000 8000 10000 τma x (Pa ) 0 2000 4000 6000 8000 10000 τma x (Pa ) τma x (Pa ) 0 2000 4000 6000 8000 10000 2000 4000 6000 8000 10000 0 0 τma x (Pa ) 2000 4000 6000 8000 10000 τma x (Pa ) 0 2000 4000 6000 8000 10000 ŷ = 373 + 876** x - 42ns
x2 (R2
= 0.81) ŷ = 2572 + 1563** x - 120* x2 (R2 = 0.58)
ŷ = 913 + 1130** -93* x2 (R2
= 0.56) ns
wt (kPa)
wt (kPa) wt (kPa)
wt (kPa) wt (kPa)
curvature of menisci, which reduces the force of each menisci and, consequently, the capillary forces (Amarasinghe et al., 2014).
A linear increase in τmax up to the wt of 10 kPa occurs in the sandier horizons of LVd1 Ap and Bw1, PVd2 A1 and SXe A1 (Figure 3, Table 1); however, this seems contradictory to the process described before. A decline in shear strength would be expected with higher wt, but even sandy soils may exhibit increased cohesive force due to the surface tension of convex menisci formed in larger quantities in these soils (Lourenço et al., 2012). Higher ρs (Table 1), predominance of fine sand followed by very fine to medium sand for all these horizons (data not shown), and some clay or silt content may justify the maintenance of capillary forces and the increase in τmax even with a suction of 10 kPa in these sandy horizons. LVd1 and PVd2 also have small amounts of Fe oxides (data not shown), which act as cementing agents (Six et al., 2004), increasing the rigidity of the links between soil particles. Furthermore, it is possible that increased friction between sand particles compensates the loss of capillary force in mechanical strength, although the effect of wt in sandy soil explains most of the variance in τmax (Holthusen et al., 2012b). Friction is an important part of shear strength for sandy soils due to high tensions at contact points between particles; whereas, for clay soils, the resulting cohesion of the interparticle attractive forces increases shear resistance (Reichert et al., 2010).
Integral z, like τmax, increased linearly or quadratically with increasing wt (Figure 4). In most horizons, including LBdf2 A1 and Bw1 (no statistical difference), structural rigidity increases up to at least the wt of 6 kPa. An increase in integral z in drained samples at wt up to 15 kPa, mainly in soils with finer texture, was reported by Baumgarten et al. (2012). Higher integral z values generally occur with increasing wt, and indicate a more elastic and rigid microstructure by considering the rheological curves as a whole, and is a parameter influenced by many soil properties (Baumgarten et al., 2012; Markgraf et al., 2012). The decline in integral z in the quadratic regressions at wt of 10 kPa in the LVd1 Ap, LVd2 A1 and Bw1, LBdf1 Ap and Bw1, and PVd2 A1 horizons (Figure 4) seems to be related to particle size distribution and ρs, similar to the observations made for τmax. Horizons with higher sand content (LVd1 Ap and PVd2 A1) or pseudosand (LBdf1 Ap and Bw1, and LBdf2 A1 and Bw1), as well as the horizons with low ρs – compared to the usual values of their textural class – (LVd1 Ap, LVd2 A1 and Bw1, LBdf1 Ap and Bw1, LBdf2 A1, and Bw1) (Table 1) show a decrease in structural rigidity when increasing the wt from 6 to 10 kPa, probably due to a decrease in the number of contact points between particles and capillary forces. In both horizons of VEo, however, there was a decrease in integral z up to the wt of 6 kPa. This behavior, which is contrary to the results of γL and τmax for VEo (Figures 2 and 3, respectively), do not show greater adhesion and cohesion forces expected in this soil with decreasing water content. Thus, additional studies to understand the causes of this behavior are necessary. The LBdf2 A1 and Bw1, PVd2 Bt1, and SXe Btg horizons showed no significant regression of integral z with increasing wt (Figure 4), probably due to the sigmoidal behavior in the LBdf2 horizons and the small variations in water content between the wt evaluated for PVd2 Bt1 and SXe Btg (data not shown).
Based on the consistency limits, most samples were in the plastic range (between LL and PL) (data not shown). There was a high positive correlation (Spearman r) between γL (at all wt) and PL, LL, and PI (from 0.63 to 0.85); and for τmax there was no significant correlation (data not shown). The correlation was positive with integral z and PL (0.71), LL (0.71), and PI (0.52) at saturated conditions, but was negative with PI at wt of 10 kPa (-0.69) (data not shown).
Figure 4. Integral z as a function of soil water tension (wt) for A horizons (black symbols) and B horizons (red symbols) of
Latossolos/Oxisols (LVd1, LVd2, LBdf1, LBdf2), Argissolos/Ultisols (PVd1, PVd2), Planossolo/Alfisol (SXe), and Vertissolo/Vertisol (VEo).
*, ** and ***: significant at 5, 1 and 0.1 %, respectively; ns: not significant; Ø: yield point not detected.
Ø Ø Ø Ø LBdf1 Ø Ø Ø Ø Ø LBdf2 Ø Ø
Integral z
(-) 0 20 40 60 80 100
Integral z
(-) 0 20 40 60 80 100
Integral z
(-) 0 20 40 60 80 100
Integral z
(-) 0 20 40 60 80 100
Integral z
(-) 0 20 40 60 80 100
Integral z
(-) 0 20 40 60 80 100 PVd1 Ø Ø PVd2 Ø
0 1 3 6 10
0 1 3 6 10 0 1 3 6 10
0 1 3 6 10 0 1 3 6 10
0 1 3 6 10 0 1 3 6 10
Integral z
(-) 0 20 40 60 80 100 SXe LVd1 LVd2
ŷ = 10.4 + 11.9** x - 0.8* x2
(R2
= 0.74) ŷ = 15.9 + 5.0*** x (R2
= 0.85)
ŷ = 32.0 + 8.8**x - 0,8**x2
(R2
= 0.56) ŷ = 23.6 + 9.4*** x - 0.9 *** x2
(R2
= 0.73)
ŷ = 12.1 + 7.6*** x (R2
= 0.82) ŷ = 17.7 + 3.8*** x (R2
= 0.87)
ŷ = 15.4 + 6.9* x - 0.5ns
x2
(R2
= 0.58) ns
ŷ = 15.4 - 0.9ns x + 0.4** x2 (R2 = 0.90) ns
ŷ = 31.2 + 5.2* x - 0.3ns
x2
(R2
= 0.68) ŷ = 23.7 + 12.9*** x - 1.0*** x2
(R2
= 0.91)
ns ns
wt (kPa) wt (kPa)
wt (kPa) wt (kPa)
wt (kPa) wt (kPa)
wt (kPa)
0 1 3 6 10
Integral z
(-) 0 20 40 60 80 100
wt (kPa) VEo
ŷ = 36.8 - 7.7***x + 0.7***x2 (R2 = 0.86) ŷ = 22.0 - 4.2***x + 0.3***x2
(R2
= 0.91) Ø
indicates that the increased number of bonding points between particles and aggregates increases soil elasticity (γL); and shear strength (τmax) and soil structural stiffness (integral z) increase with increasing strength or rigidity of these bonds, which are mainly dependent of the clay content and of the kaolinite and oxide content.
For our soils, rheological parameters indicating elasticity and structural strength, assessed with respect to wt, are largely in agreement with those observed in published studies. Increased soil structural strength with increasing wt occurs due to the decrease in the number of water molecule layers coating particles and aggregates, reducing their mobility and promoting additional resistance to deformation by increasing solid-solid interactions – i.e., greater cohesion (Ghezzehei and Or, 2001). Moreover, as a result of reduced water content, the menisci exhibit stronger contraction force – greater effective stress – even though the number of menisci decreases progressively (Gallipoli et al., 2003; Peth and Horn, 2011; Holthusen et al., 2010, 2012b). This is in accordance with the increase in structural strength in most horizons (Figures 2, 3, and 4), with increasing wt in this study, up to at least 6 kPa.
There is, however, some variation between different horizons, and soil resistance does not always increase with increasing wt, as was also observed by Holthusen et al. (2010). This suggests that clayey and sandy soils with high pseudosand content and, or low bulk density lose mechanical resistance through loss of capillary forces at wt above 10 kPa (field capacity). Given the importance of rheological parameters for assessment of changes in volume relationships and the functionality of soils under application of external loads as well as assessment of the risk of erosion and landslides, among other phenomena (Horn and Peth, 2011), more studies should be conducted to ascertain the decline in mechanical shear strength (τmax) of clay soils at higher wt.
CONCLUSIONS
Soil mechanical strength increased with increasing water tension up to 6 kPa, primarily due to increased capillary forces in the soil. With increasing water tension, the increase in structural strength, as measured by τmax and integral z, was more pronounced than the increase in elasticity, measured by γL.
Increased bonding between particles promotes soil elastic (or recoverable) deformation (γL), and γL increased with higher amounts of clay, total carbon, expansive clay, and cations. Higher friction and strength of interparticle bonds increase shear strength (τmax) and structural stiffness of the soil (integral z), and τmax and integral z mainly increased with increasing clay, kaolinite, and oxide content.
A decrease in mechanical strength of some soils at the highest water tension evaluated (10 kPa) was observed in the sandy horizons and horizons with a high proportion of very resistant microaggregates (pseudosand), particularly when such soils are associated with low bulk density. Thus, it is believed that this decrease in mechanical strength is caused by a smaller number of contact points between particles and consequent reduction in capillary forces. However, more studies are needed to evaluate the strength of granular soils with low bulk density and soils with expansive clay under the influence of water tension in the soil.
REFERENCES
Albuquerque JA, Cassol EA, Reinert DJ. Relação entre a erodibilidade em
entressulcos e estabilidade dos agregados. Rev Bras Cienc Solo. 2000;24:141-51. doi: 10.1590/S0100-06832000000100016
Bachmann J, Zhang H. The stability of sandy soils and its dependence on humification degree and content of organic matter. Z Pflanz Bodenkunde. 1991;154:47-52.
Baumgarten W, Horn R. Assessing soil degradation by using a scale-spanning soil mechanical approach: a review. In: Krümmelbein J, Horn R, Pagliai M, editors. Advances in GeoEcology. Cremlingen: Catena Verlag; 2013. v. 42. p.1-61.
Baumgarten W, Neugebauer T, Fuchs E, Horn R. Structural stability of marshland soils of the riparian zone of the tidal Elbe River. Soil Till Res. 2012;125:80-8. doi:10.1016/j.still.2012.06.002 Blake GR, Hartge KH. Bulk density. In: Klute A, editor. Methods of soil analysis: Physical and mineralogical methods. 2nd. ed. Madison: American Society of Agronomy; 1986. Pt 1. p.363-75. Bronick CJ, Lal R. Soil structure and management: a review. Geoderma. 2005;124:3-22. doi:10.1016/j.geoderma.2004.03.005
Buchmann C, Bentz J, Schaumann GE. Intrinsic model polymer hydrogel-induced soil structural stability of a silty sand soil as affected by soil moisture dynamics. Soil Till Res. 2015;154:22-33. doi:10.1016/j.still.2015.06.014
Chatterjee N, Lapin S, Flury M. Capillary forces between sediment particles and an air-water interface. Environ Sci Technol. 2012;46:4411-8. doi:10.1021/es2038933
Donagema GK, Campos DVB, Calderano SB, Teixeira WG, Viana JHM, organizadores. Manual de
métodos de análise do solo. 2a
. ed. rev. Rio de Janeiro: Embrapa Solos; 2011.
Equipe Estatcamp, Estatcamp - Consultoria em estatística e qualidade. Software Action [internet]. São Carlos, SP: Estatcamp; 2014 [acesso em 04 Dezembro 2014]. Disponível em: http://www.portalaction.com.br.
Gallipoli D, Gens A, Sharma R, Vaunat J. An elastoplastic model for unsaturated soil including the effect of saturation degree on mechanical behaviour. Geotechnique. 2003;53:123-36. doi:10.1680/geot.53.1.123.37251
Ghezzehei TA, Or D. Rheological properties of wet soils and clays under steady and oscillatory stresses. Soil Sci Soc Am J. 2001;65:624-37. doi: 10.2136/sssaj2001.653624x
Holthusen D, Jänicke M, Peth S, Horn R. Physical properties of a Luvisol for different long-term fertilization treatments: II. Microscale behavior and its relation to the mesoscale. J Plant Nutr Soil Sci. 2012a;175:14-23. doi:10.1002/jpln.201100076
Holthusen D, Peth S, Horn R, Kühn T. Flow and deformation behavior at the microscale of soils from several long-term potassium fertilization trials in Germany. J Plant Nutr Soil Sci. 2012c;175:535-47. doi:10.1002/jpln.201100073
Holthusen D, Peth S, Horn R. Impact of potassium concentration and matric potential on soil stability derived from rheological parameters. Soil Till Res. 2010;111:75-85. doi:10.1016/j.still.2010.08.002
Holthusen D, Reeb D, Horn R. Influence of potassium fertilization, water and salt stress, and their interference on rheological soil parameters in planted containers. Soil Till Res. 2012b;125:72-9. doi:10.1016/j.still.2012.05.003
Horn R, Peth S. Mechanics of unsaturated soils for agricultural applications. In: Huang PM, Li Y, Sumner ME, editors. Handbook of soil sciences. 2nd ed. Boca Raton: CRC Press; 2011. p.3.1-30. Horn R. Stress-strain effects in structured unsaturated soils on coupled mechanical and hydraulic processes. Geoderma. 2003;116:77-88. doi:10.1016/S0016-7061(03)00095-8 Kämpf N, Marques JJ, Curi N. Mineralogia de solos brasileiros. In: Ker JC, Schaefer, CE, Vidal Torrado P, editores. Pedologia: Fundamentos. Viçosa, MG: Sociedade Brasileira de Ciência do Solo; 2012. p.207-302.
Kemper WD, Rosenau RC, Dexter AR. Cohesion development in disrupted soils as affected by clay and organic matter content and temperature. Soil Sci Soc Am J. 1987;51:860-7. doi:10.2136/sssaj1987.03615995005100040004x
Khaydapova D, Milanovskiy E, Shein E. Rheological properties of different minerals and clay soils. Eur J Soil Sci. 2015;4:198-202. doi:10.18393/ejss.2015.3.198-202
Libardi PL. Água no solo. In: Jong van Lier Q, editor. Física do solo. Viçosa, MG: Sociedade Brasileira de Ciência do Solo; 2010. p.103-52.
Lourenço SDN, Gallipoli D, Augarde CE, Toll DG, Fisher PC, Congreve A. Formation and evolution of water menisci in unsaturated granular media. Geotechnique. 2012;62:193-9. doi:10.1680/geot.11.P.034
Markgraf W, Horn R, Peth S. An approach to rheometry in soil mechanics-Structural changes in bentonite, clayey and silty soils. Soil Till Res. 2006;91:1-14. doi:10.1016/j.still.2006.01.007 Markgraf W, Horn R. Rheological investigations in soil micro mechanics: Measuring stiffness degradation and structural stability on a particle scale. In: Gragg LP, Cassell JM, editors. Progress in management engineering. New York: Nova Science Publishers; 2009. p.237-79.
Markgraf W, Horn R. Rheological strength analysis of K+
-treated and of CaCO3
rich soils. J Plant Nutr Soil Sci. 2006;169:411-9. doi:10.1002/jpln.200521934
Markgraf W, Horn R. Scanning electron microscopy-energy dispersive scan analyses and rheological investigations of South-Brazilian soils. Soil Sci Soc Am J. 2007;71:851-9. doi:10.2136/sssaj2006.0231
Markgraf W, Watts CW, Whalley WR, Hrkac T, Horn R. Influence of organic matter on rheological properties of soil. Appl Clay Sci. 2012;64:25-33. doi:10.1016/j.clay.2011.04.009
Mezger TG. The rheology handbook. 4th ed. Hannover: Vincentz Network GmbH & Co KG; 2014.
Mitchell JK, Soga K. Fundamentals of soil behavior. 3rd ed. New Jersey: John Wiley & Sons; 2005.
Reichert JM, Reinert DJ, Suzuki LEAS, Horn R. Mecânica do solo. In: Jong van Lier Q, editor. Física do solo. Viçosa, MG: Sociedade Brasileira de Ciência do Solo; 2010. p.30-102.
Reinert DJ, Reichert JM. Coluna de areia para medir a retenção de água no solo - protótipos e teste. Cienc Rural. 2006;36:1931-5. 10.1590/S0103-84782006000600044
Santamarina JC. Soil behavior at the microscale: Particle forces. In: Germaine JT, Sheahan TC, Whitman RV, editors. Soil behavior and soft ground construction. New York: American Society of Civil Engineers; 2003. p.25-56. doi:10.1061/40659(2003)2
Santos HG, Jacomine PKT, Anjos LHC, Oliveira VA, Oliveira JB, Coelho MR, Lumbreras JF, Cunha TJF. Sistema brasileiro de classificação de solos. 3ª. ed. Rio de Janeiro: Embrapa Solos; 2013. Santos RD, Lemos RC, Santos UG, Ker JC, Anjos LHC. Manual de descrição e coleta de solo no campo. 5ª. ed. Rio de Janeiro: Embrapa Solos; 2005.
SAS Institute Inc. SAS/STAT® 9.22 User’s guide. Cary: SAS Institute; 2010.
Singh U, Uehara G. Electrochemistry of the double layer: principles and applications to soils. In: Sparks DL, editor. Soil physical chemistry. 2nd. ed. Boca Raton: CRC Press; 1998. p.1-46. Six J, Bossuyt H, Degryze S, Denef K. A history of research on the link between (micro) aggregates, soil biota, and soil organic matter dynamics. Soil Till Res. 2004;79:7-31. doi:10.1016/j.still.2004.03.008
Soulié F, El Youssoufi MS, Delenne JY, Voivret C, Saix C. Effect of the crystallization of a solute on the cohesion in granular materials. Powder Technol. 2007;175:43-47. doi:10.1016/j.powtec.2007.01.025
Suzuki LEAS, Reichert JM, Albuquerque JA, Reinert DJ, Kaiser DR. Dispersion and flocculation of Vertisols, Alfisols and Oxisols in Southern Brazil. Geoderma Regional. 2015;5:64-70. doi:10.1016/j.geodrs.2015.03.005
United States Department of Agriculture - USDA. Keys to soil taxonomy. 11th. ed. Washington,
DC: Government Printing Office; 2010.