Food Science and Technology ISSN 0101-2061
DI:
D http://dx.doi.org/10.1590/1678-457X.6560
1 Introduction
The food industry is aware of growing consumer demand for healthy products (Hellyer et al., 2012), with added dietary fiber (Vuholm et al., 2014) and low in calories (Heiman & Lowengart, 2014). Including whole grains in one’s diet, for instance, can positively impact health and lifestyle.
Wheat is a unique grain because of its functional components. Dnly wheat flour can form a viscoelastic dough with rheological properties (Goesaert et al., 2005). However, combining nutritional value and organoleptic quality in bread recipes is a challenge.
Fat intake is scientifically linked to increased risk of developing chronic noncommunicable diseases, which affects morbidity and mortality rates (Brasil, 2005). Dne way of reducing calories in food products is the use of fat replacers (Zahn et al., 2010). Enzymatically modified starches have functional benefits and can be used specifically as a fat substitute in bread (Scheuer et al., 2014).
The cellular crumb structure of cereal-based products, such as bread, is an important contributing factor to their textural properties (Zghal et al., 1999) and to the determination and quantification of sensory quality (Mondal & Datta, 2008). Therefore, knowledge of the structure of breads may help predict
many of their quality-related properties (Dzkoc et al., 2009), particularly in whole-wheat breads, which are known to be less appealing to consumers in terms of quality than are breads made with refined wheat flour (Dro, 2013).
The effects of relative variation in components or processing parameters of a food product can be evaluated using response surface methodology (Collar et al., 2007; Flander et al., 2007). Furthermore, the structural elements of food products such as breads (Kihlberg et al., 2004), starch (Wu et al., 2012), fruits and vegetables (Qing-Guo et al., 2006) can be quantified by image analysis (Jackman & Sun, 2013), contributing to the understanding of quality-related properties such as texture (Qing-Guo et al., 2006).
In the search for improved bread formulations, image processing is a useful tool to investigate, approximate and predict many properties, such as texture (Pourfarzad et al., 2013), by assessing cell size, cell size distribution, number of cells per unit area, cell wall thickness, void fraction and shape factor (Gonzales-Barron & Butler, 2006). The accuracy of a digital image analysis system for crumb grain measurement can be evaluated based on its capability to predict crumb density from directly computed structural parameters (Zghal et al., 1999),
Optimization of image analysis techniques for quality assessment
of whole-wheat breads made with fat replacer
Patrícia Matos SCHEUER1*, Jorge Augusto Sandoval FERREIRA2, Bruna MATTIDNI1,
Martha Zavariz de MIRANDA3, Alicia de FRANCISCD1
Received 11 Nov., 2014 Accepted 25 Feb., 2015
1Cereal Laboratory, Federal University of Santa Catarina – UFSC, Florianópolis, SC, Brazil 2Federal Institute of Santa Catarina, Campus Florianópolis-Continente, Florianópolis, SC, Brazil
3Grain Quality Laboratory, Brazilian Corporation of Agricultural Research – Embrapa Wheat, Passo Fundo, RS, Brazil
*Corresponding author: [email protected] Abstract
The cellular structure of healthy food products, with added dietary fiber and low in calories, is an important factor that contributes to the assessment of quality, which can be quantified by image analysis of visual texture. This study seeks to compare image analysis techniques (binarization using Dtsu’s method and the default ImageJ algorithm, a variation of the iterative intermeans method) for quantification of differences in the crumb structure of breads made with different percentages of whole-wheat flour and fat replacer, and discuss the behavior of the parameters number of cells, mean cell area, cell density, and circularity using response surface methodology. Comparative analysis of the results achieved with the Dtsu and default ImageJ algorithms showed a significant difference between the studied parameters. The Dtsu method demonstrated the crumb structure of the analyzed breads more reliably than the default ImageJ algorithm, and is thus the most suitable in terms of structural representation of the crumb texture.
Keywords: Dtsu and default algorithms; binarization; ImageJ.
such as number of cells, mean cell area, cell density, circularity, and minimum and maximum cell area. Crumb cell structure can be commonly described by the parameters mean cell area and cell density, and quantified by image analysis systems to determine the visual texture (Scanlon & Zghal, 2001), which, alongside mouthfeel perception, is significantly impacted by the cell size of the crumb (Skendi et al., 2010).
Although a standard procedure does not yet exist, several studies have used image analysis to assess bread loaves made with refined wheat flour (Zghal et al., 1999; Gonzales-Barron & Butler, 2006) and some made using whole grains, as soy (Lodi & Vodovotz, 2008), β-glucan (Skendi et al., 2010), chia (Farrera-Rebollo et al., 2012), amaranth (Sanz-Penella et al., 2013) and whole wheat (Torri et al., 2013).
Dne of the most common analytical actions performed on any image is descriptive analysis, which seeks to assess the relationships between the color and/or textural features of the image, find distinct patterns in the image, determine the presence of different types of objects, or study the statistical distribution of the pixels and different clusters related to the different phenomena appearing in the image (Prats-Montalbán et al., 2011). The success of the chosen analysis technique depends on the structure of interest occupying a range of grey levels distinct from that of the background (Ridler & Calvard, 1978). Several approaches are available for this purpose: an image acquisition method that reveals more information or is less confounded by background noise (Prats-Montalbán al., 2011); homogenization of lighting to eliminate irregularities; hither resolution; better sample preparation to ensure minimum data corruption; and the search for a better image segmentation algorithm that can provide a more accurate region of interest (Jackman & Sun, 2013). The term segmentation refers to the isolation of one or various objects from the background of an image to enable feature characterization of the image (Prats-Montalbán et al., 2011).
Many automated thresholding algorithms are available (Gonzales-Barron & Butler, 2006), including Dtsu’s method and the default ImageJ algorithm, a variation of the iterative intermeans method; both provide robust and efficient data partitioning (Dtsu, 1979; Herbert, 2014). The aim of this study was to compare two different image thresholding techniques and quantify the differences in crumb structure features of 14 different types of whole-wheat breads made with fat replacer, as a means of proposing simple procedures for quantification of structural changes (viewed from a response surface methodology perspective) that could have an effect on bread quality.
2 Materials and methods 2.1 Material
Commercially refined wheat flour and whole-wheat flour for bread making, milled from wheat harvested in 2012 and stored at -18 ºC, were provided by Cooperativa Agrária Agroindustrial, Guarapuava, state of Paraná, Brazil. A representative sample of whole-wheat flour (reconstituted whole-wheat flour) and white wheat flour (refined flour), both from the same batch of grain, was used to ensure standardization of variable parameters. Different blends of whole wheat flour (WF) and refined wheat flour (RF) were prepared and encoded: 95.35WF (95.35%WF+4.65%RF);
85WF (85%WF+15%RF); 60WF (60%WF+40%RF); 35WF (35%WF+65%RF); and 24.64WF (24.64%WF+75.36%RF). These levels were determined by means of response surface methodology, as described in the Methods section.
The enzymatically modified cornstarch used in this study as a fat replacer (FR) was provided by Dutch Starches International, Netherlands, and is commercially available as Selectamyx C 150.
2.2 Bread samples
Bread loaves were baked and randomly selected in duplicate according to the optimized straight-dough bread-making method (10-10B) (American Association of Cereal Chemists, 2000), with a 60 min fermentation, using the following formulation: wheat flour (100%), sucrose (6%), instant active dry yeast (1.8%), sodium chloride (1.5%), fat (3%), and tap water (Flander et al., 2007). Instead of fat, the aforementioned fat replacer was used in gel form according to manufacturer instructions. The amount of water used corresponded to 86% of the water absorption content as determined by Farinograph analysis (method adapted from Seyer & Gélinas, 2009). The ingredients were mixed at speed setting 2 for 6 min (Flander et al., 2007; Dro, 2013) in a commercial mixer (RPD 25, Líder, Brazil). The temperature of the dough was kept at 28-29 °C after mixing. Subsequently, 500-g pieces of dough were placed in a proofing cabinet (CFC20, Perfecta, Brazil) at 30 °C and 85% relative humidity for 35 min. The dough was then kneaded once, fermented for 17 min, kneaded again, and fermented for a further 8 min. The dough was sheeted manually, placed into a rectangular mold (9.5 cm x 20 cm x 4.5 cm), and fermented for 24 min. Finally, the dough was baked in a revolving oven (Ventile, Líder, Brazil) for 24 min at 180 °C. After cooling for 1 hour at room temperature on metal racks, 1-cm-thick longitudinal and cross-sections of each loaf were sliced and scanned for crumb cell analysis (Pourfarzad et al., 2013).
2.3 Experimental design
Using the rotatable central composite design of response surface methodology, with the percentage of whole wheat flour (%WF) and the percentage of fat replacer (%FR) as independent variables, 14 different loaves were baked (Table 1).
The rotatable central composite design yielded 14 experiments, as follows: four factorial treatments, in which the two factors were %WF (%whole wheat flour) and %FR (% fat replacer), each with two levels coded to -1 and +1; four axial treatments including minimum and maximum level of each factor coded as -α and +α, where α=(22)1/4 = 1.414; and one central treatment repeated six times, to estimate the pure experimental error and calculate the reproducibility of the method, in which all factors are coded as zero (Table 1).
The second-order regression model is represented by Equation 1 (Montgomery, 1991).
z = b0+b1x+b11(x)2+b 2y+b22(y)
2+b 12xy (1) Where:
value and computing averages for the pixels at or below the threshold and for those above. The averages of those two values are computed, the threshold is incremented and the process repeated until the threshold is higher than the composite average (threshold = (average background + average objects)/2) (Gonzales-Barron & Butler, 2006).
The following crumb grain properties were extracted and calculated: number of cells (objects); mean cell area (mm2); cell density (cells/mm2), circularity, and maximum and minimum cell area (mm2) (Esteller & Lannes, 2005). Cell density was calculated by dividing the number of cells by the mean cell area. Cell shape was analyzed using a shape factor to measure circularity.
The cell size frequency distribution (Sturges, 1926) was also calculated for both methods (Dtsu and default). According to Polaki et al. (2010), the cell distribution reveals information about the crumb structure of the bread. Cells can be classified as small (area < 4 mm2), medium (4-8 mm2) or large (> 8 mm2), as all cell sizes coexist in the matrix.
2.5 Analysis of results
Analysis of variance (ANDVA) and Tukey’s test (significance level p≤0.05) were used to determine the significance of the data. All statistical analyses and graphical representations were performed in STATISTICA 7.0®.
3 Results and discussion
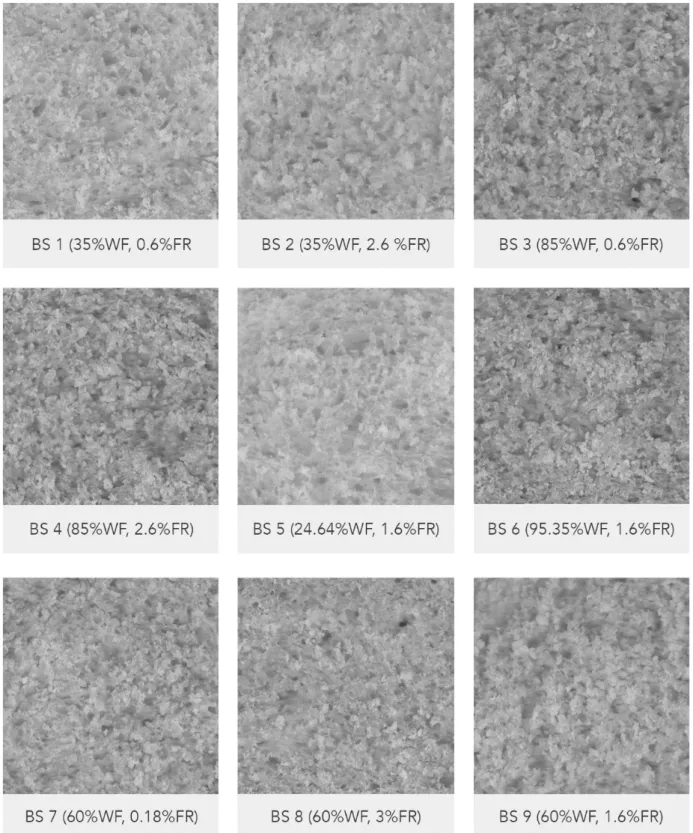
Bread samples 9 to 14 comprised the central points treatments, and are thus represented by a single image.
Image analysis was performed on each of three scanned bread slices to provide a more detailed view of the bread texture, as shown in Figure 1.
Figure 2 shows the binary images processed by the two thresholding techniques (Dtsu and default). Figures 2a, b show a basic figure constructed from circles. Figures 2c, d show bread sample 5 (24.64%WF+1.6%FR) and Figures 2e, f show bread sample 6 (95.35%WF+1.6%FR), the loaves baked with the lowest and highest whole-wheat flour content respectively.
For the basic image constructed from circles (Figures 2a, b), neither visual nor statistical differences were found between the thresholding techniques; all parameters were identical with both algorithms: number of cells (three objects), mean cell area (29.946 mm2), cell density (0.100 cells/mm2), and circularity (0.918). For bread samples 5 and 6 (Figures 2c, d) and (Figures 2e, f), respectively), differences between the thresholding techniques are apparent. Visually, a larger black area is seen in the image generated by the Dtsu method (Figures 2c, e) as compared with the default algorithm (Figures 2d, f). As described by Gonzales-Barron & Butler (2006), in similar applications of different thresholding instances, the Dtsu method overestimated the void fraction, whereas the default algorithm appeared to underestimate this fraction. Statistically significant differences (p≤0.05) are shown in Table 2.
As Table 2 shows, significant differences (p≤0.05) between the Dtsu and default ImageJ methods were found for the parameters
2.4 Scanning resolution settings
Images of three slices were acquired using the flatbed scanner of an all-in-one printer (DCP-7065DN Monochrome Laser Multi-Function Copier, Brother, Japan). Brightness and contrast were set to the default software values (zero) for all samples. The images were saved as bitmap files at a resolution of 300 dots per inch (dpi) in the red-green-blue (RGB) color space. Measurements were obtained in pixels and converted into millimeters by using known length values. A single 40 mm x 40 mm square field of view was evaluated in each image. The free GNU Image Manipulation Program (GIMP) software, version 2.6, was used to obtain the two measurements of interest. After cropping, the images were pre-processed and converted to 8-bit greyscale. Pre-processing (levels adjustment), segmentation (thresholding) and crumb grain measurements (extraction of parameters) were carried out in the ImageJ-based Fiji 1.46 software package.
Segmentation was performed manually, by binarization of greyscale images into black-and-white images using the Dtsu and default ImageJ algorithms.
Dtsu’s thresholding algorithm is a uniformity-oriented method, wherein uniformity is computed as a measure within each region independent of the surroundings and the optimal threshold is determined by minimizing the intraclass variance of the segmented region (Sahoo et al., 1988), i.e., it maximizes between-class variance’ The Dtsu method (Dtsu, 1979) has been shown to yield adequate, consistent binary images (high degree of uniformity) in terms of performance and thresholding characteristics of the analyzed figures (Gonzales-Barron & Butler, 2006).
The default ImageJ algorithm is formally known as the iterative intermeans method, a variation of the IsoData algorithm (Ridler & Calvard, 1978). The procedure divides the image into object and background by obtaining an initial threshold
Table 1. Bread composition.
Loaf Treatment
Independent variables
%WF %FR
Real value Encoded
value Real value
Encoded value 1
Factorial
35.00 -1 0.60 -1
2 35.00 -1 2.60 +1
3 85.00 +1 0.60 -1
4 85.00 +1 2.60 +1
5
Axial
24.64 - α 1.60 0
6 95.35 +α 1.60 0
7 60.00 0 0.18 -α
8 60.00 0 3.00 +α
9
Central
60.00 0 1.60 0
10 60.00 0 1.60 0
11 60.00 0 1.60 0
12 60.00 0 1.60 0
13 60.00 0 1.60 0
14 60.00 0 1.60 0
default algorithm, there was no significant difference in number of cells across any of the samples (p≤0.05) (Table 2).
With both algorithms, bread sample 5 had a similar (p≤0.05) mean cell area (Dtsu: 0.497 mm2; default: 0.532 mm2) than samples 1, 3 and 9 and a larger mean cell area (p≤0.05) than number of cells, mean cell area, cell density, and circularity. In
Dtsu-analyzed images, bread sample 1 (35%WF+0.6%FR) had a similar number of cells (752.67 objects, p≤0.05) as compared to samples 2, 5, 6, 7 and 8, and a greater number of cells (p≤0.05) than samples 3, 4 and 9 (Table 2). In images analyzed with the
50-60% whole-wheat flour and 1.5% fat replacer. With both methods, the best percentage of fat replacer is about 1.5%.
Statistically, Figure 3a (Dtsu’s method) corroborates the literature, in that mean cell area decreased with increasing percentage of whole-wheat flour, regardless of the percentage of fat replacer used, which can be contextualized by the fact that fiber disrupts the gluten–starch matrix and restricts and forces gas cells to expand in a particular dimension (Collar et al., 2006). This may have been compounded by the action of the fat replacer, as studies have indicated that the size of a hydrocolloid can influence its distribution within the gluten matrix and, therefore, influence pore size (Mandala et al., 2007). Different hydrocolloids have been included in the formulation of partially baked breads to improving quality parameters (specific volume, firmness, moisture, shelf life) (Bárcenas et al., 2009) as well as samples 2, 6 and 7 (Table 2). With Dtsu’s method, sample 5 had
a mean cell area similar (p≤0.05) to that of sample 4 and larger (p≤0.05) than that of sample 8. By other hand, with the default algorithm, sample 5 had a mean cell area larger (p≤0.05) to that of sample 4 and similar (p≤0.05) than that of sample 8 (Table 2).
The behavior of the mean cell area parameter is shown in response surface plots (Figures 3a, b), Dtsu and default methods respectively) of the effect of whole-wheat flour and fat replacer content, as the cell distribution reveals information about the crumb structure (Polaki et al., 2010).
With Dtsu’s method (Figure 3a), the greatest mean cell areas were found in samples baked with low percentages of whole-wheat flour (about 20%) and fat replacer (about 1.5%). With the default method (Figure 3b), the highest mean cell area values were observed in samples baked with approximately
by whole-wheat flour and fat replacer content, with the lowest cell density values found with approximately 40-50% whole wheat flour and 2% fat replacer. These results run counter to the mean cell area results found with both Dtsu’s (Figure 3a) and the default (Figure 3d) methods.
Using Dtsu’s method (Table 2), no differences (p≤0.05) in cell circularity were observed among the bread samples, which is consistent with the findings of Rosell & Santos (2010) in loaf formulations containing hydrocolloids. However, using the default algorithm, differences in circularity (p≤0.05) were found: bread sample 6 (0.835) had a higher value than samples 5 (0.807) and 9 (0.810); sample 5 (0.807) had a lower circularity (p≤0.05) than sample 2 (0.833). With both algorithms, circularity values exceeded 0.8, thus approaching a perfect circle.
The response surface plots shown in Figures 3e, f (Dtsu’s and default algorithms respectively) demonstrate that fat replacer content had a significant influence on pore circularity; namely, circularity varied more with changes in fat replacer content than with whole-wheat flour content.
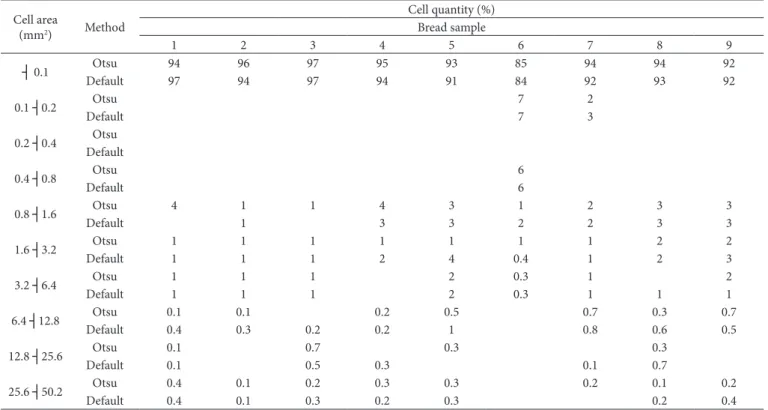
Regarding the percentage of cells in each cell area range in each sample (Table 3), both in images analyzed with Dtsu’s method and with the default algorithm, most cells were characterized as small (area < 0.1 mm2). In bread sample 6, 84-85% of cells were classified as small, versus 91-97% of cells in the other samples (Table 3). Furthermore, sample 6 is the only one in which maximum cell area was in the 3.2 ┤6.4 mm2 range. This is justified by the fact that sample 6 had a higher percentage of whole-wheat flour (95.35%WF), as the presence of fiber hinders to replace fat. As gas cells expand, the density of the dough is
reduced (Scanlon & Zghal, 2001).
Regarding cell density, in images analyzed with Dtsu’s algorithm, bread sample 6 had the highest density (4896.98 cells/mm2) (p≤0.05) among all samples. As sample 6 had the highest whole-wheat flour content (95.35%WF+1.6%FR), this can be explained by the fact that fibers can dilute and interrupt the gluten–starch matrix, thus causing a restriction in gas retention, as reported in whole-oat bread by Polaki et al. (2010). In images analyzed with the default ImageJ algorithm, sample 6 had a cell density similar (4702.27 cells/mm2, p≤0.05) to that of sample 7 and higher (p≤0.05) than that of all others (Table 2).
Both with Dtsu’s method and with the default ImageJ algorithm (Table 2), the highest cell density and lowest mean cell area values were found with the highest whole-wheat flour content, which is consistent with the results obtained by Farrera-Rebollo et al. (2012) in breads made with chia flour and by Hruskova et al. (2012) in whole-grain breads.
The response surface plots shown in Figures 3c, d (Dtsu’s and default algorithms respectively) show a similar behavior in cell density with percent changes in whole-wheat flour and fat replacer content. Cell density strongly influences the mechanical properties of bread crumb, thus allowing comparison of the analyzed food with other raw materials and processing conditions (Scanlon & Zghal, 2001).
Both in images analyzed with Dtsu’s method (Figure 3c) and with the default algorithm (Figure 3d), cell density was influenced
Table 2. Image analysis parameters of bread loaves.
Dtsu algorithm Bread samples Number of cells
(objects)
Mean cell area (mm2)
Cell density
(cells/mm2) Circularity
1 752.67a ± 84.23 0.331ab ± 0.059 2348.95bc ± 687.62 0.824a ± 0.002
2 689.00ab ± 87.93 0.285b ± 0.082 2496.81bc ± 410.10 0.837a ± 0.003
3 563.33b ± 40.13 0.346ab ± 0.029 1630.19bc ± 76.87 0.842a ± 0.006
4 562.00b ± 13.89 0.325ab ± 0.042 1747.91bc ± 220.57 0.828a ± 0.010
5 589.67ab ± 73.64 0.497a ± 0.062 1187.65c ± 96.42 0.821a ± 0.006
6 682.33ab ± 40.50 0.141c ± 0.016 4896.98a ± 668.48 0.832a ± 0.004
7 603.33ab ± 47.06 0.212b ± 0.058 3012.09b ± 979.34 0.837a ± 0.022
8 628.67ab ± 72.06 0.298b ± 0.114 2280.47bc ± 727.22 0.834a ± 0.003
9 to 14 568.33b ± 72.50 0.323ab ± 0.058 1782.57bc ± 266.18 0.815a ± 0.009
Default ImageJ algorithm Bread samples Number of cells
(objects)
Mean cell area (mm2)
Cell density
(cells/mm2) Circularity
1 793.67a ± 91.55 0.412abc ± 0.090 2009.59b ± 629.48 0.821abc ± 0.000
2 726.33a ± 100.08 0.332bcd ± 0.060 2246.91b ± 561.95 0.833ab ± 0.005
3 577.00a ± 48.59 0.397abcd ± 0.020 1455.88b ± 145.37 0.827abc ± 0.006
4 580.00a ± 23.52 0.327bc ± 0.056 1812.40b ± 338.38 0.826abc ± 0.002
5 625.67a ± 73.21 0.532a ± 0.070 1197.23b ± 259.88 0.807c ± 0.007
6 712.33a ± 23.96 0.159d ± 0.045 4702.27a ± 1223.48 0.835a ± 0.004
7 702.67a ± 72.50 0.244cd ± 0.072 3147.27ab ± 1340.16 0.826abc ± 0.019
8 759.00a ± 135.50 0.434abc ± 0.024 1740.99b ± 225.71 0.819abc ± 0.003
9 to 14 610.67a ± 86.94 0.505ab ± 0.118 1260.02b ± 352.71 0.810bc ± 0.010
content between bread samples (1 vs. 2; 3 vs. 4; 7, 8 and 9-14) while maintaining the same percentage of whole-wheat flour (Table 1) did not yield relevant differences in relative number of cells in each cell area range. This probably demonstrates that the properties of whole-wheat flour predominate over those of the fat replacer, which should act as shortening. Breads made with white flour and low fat content (0.1 and 0.3% of flour weight) resulted in soft loaves with a larger volume (Mouliney et al., 2011). This same study showed that loaf volume rises progressively the formation of air bubbles in the viscoelastic gluten network.
This is consistent with earlier studies (Pomeranz et al., 1977) showing that addition of fibrous materials to wheat flour weakens the crumb cell structure due to dilution of gluten protein network. Dubois (1978) emphasized that the gas retention of the dough is impaired largely by water-insoluble fractions, thereby changing the texture and appearance of the baked product.
As shown in Table 3, with both of the studied methods (Dtsu’s and the default ImageJ algorithm), relative variation of fat replacer
Figure 3. Effect of whole-wheat flour and fat replacer content on the mean cell area ((a) and (b)), cell density ((c) and (d)), circularity ((e) and
small differences and relative variation in the number of cells for ranges from 0.8 to 50.2 mm2.
Table 4 shows the minimum and maximum cell area values found in each bread samples using the two methods. The minimum cell area value was identical (0.007 mm2) in all bread samples and in both image analysis algorithms. The maximum cell area value did not differ significantly (p≤0.05) between the Dtsu and default methods. However, the results of samples 6 and 1 bear stressing. Bread sample 6, which was made with 95.35%WF, had a maximum cell area value of approximately 5 mm2, whereas all other samples had maximum values ranging from 31 to 72 mm2. Bread sample 1 had a maximum cell area of 31.096 mm2 with Dtsu’s method and 71.245 mm2 with the default ImageJ algorithm.
with increasing levels of shortening up to about 2% of flour weight. Thus, one important function of fat in bread-making is stabilization of gas bubbles in the dough, increasing gas retention in the oven (Goesaert et al., 2005), as added fat prevents binding of the native flour lipids to the gluten network, thereby stabilizing proteins during heating of the dough (Mouliney et al., 2011).
Regarding the distribution of the different frequency ranges, only samples 6 (7%) and 7 (2 to 3%) had cells with a mean cell area in the 0.1┤0.2 mm2 range, as determined by both methods (Table 3). Table 3 shows that no sample had pores in the 0.2 ┤ 0.4 mm2 range and that only sample 6 had pores in the 0.4 ┤0.8 mm2 range, for both methods (Dtsu’s and default). Comparison of Dtsu’s method and the default algorithm revealed
Table 3. Cell quantity in each bread sample.
Cell area
(mm2) Method
Cell quantity (%) Bread sample
1 2 3 4 5 6 7 8 9
┤ 0.1 Dtsu 94 96 97 95 93 85 94 94 92
Default 97 94 97 94 91 84 92 93 92
0.1 ┤0.2 Dtsu 7 2
Default 7 3
0.2 ┤0.4 Dtsu Default
0.4 ┤0.8 Dtsu 6
Default 6
0.8 ┤1.6 Dtsu 4 1 1 4 3 1 2 3 3
Default 1 3 3 2 2 3 3
1.6 ┤3.2 Dtsu 1 1 1 1 1 1 1 2 2
Default 1 1 1 2 4 0.4 1 2 3
3.2 ┤6.4 Dtsu 1 1 1 2 0.3 1 2
Default 1 1 1 2 0.3 1 1 1
6.4 ┤12.8 Dtsu 0.1 0.1 0.2 0.5 0.7 0.3 0.7
Default 0.4 0.3 0.2 0.2 1 0.8 0.6 0.5
12.8 ┤25.6 Dtsu 0.1 0.7 0.3 0.3
Default 0.1 0.5 0.3 0.1 0.7
25.6 ┤50.2 Dtsu 0.4 0.1 0.2 0.3 0.3 0.2 0.1 0.2
Default 0.4 0.1 0.3 0.2 0.3 0.2 0.4
Table 4. Minimum and maximum cell area.
Bread sample Minimum cell area (mm
2) Maximum cell area (mm2)
Dtsu Default Dtsu Default
1 0.007a ± 0.000 0.007a ± 0.000 31.096a ± 12.707 71.245a ± 52.213
2 0.007a ± 0.000 0.007a ± 0.000 55.852a ± 7.557 51.290a ± 11.039
3 0.007a ± 0.000 0.007a ± 0.000 53.111a ± 0.000 51.842a ± 0.000
4 0.007a ± 0.000 0.007a ± 0.000 58.236a ± 0.710 42.929a ± 18.341
5 0.007a ± 0.000 0.007a ± 0.000 53.519a ± 12.924 46.918a ± 16.268
6 0.007a ± 0.000 0.007a ± 0.000 5.622a ± 0.066 5.562a ± 0.019
7 0.007a ± 0.000 0.007a ± 0.000 39.148a ± 16.847 36.866a ± 16.020
8 0.007a ± 0.000 0.007a ± 0.000 72.320a ± 72.242 56.437a ± 14.282
9 to 14 0.007a ± 0.000 0.007a ± 0.000 46.381a ± 4.612 36.400a ± 1.971
4 Conclusion
Comparison of the parameters of interest in the studied bread samples using the two chosen algorithms showed that Dtsu’s method yielded a greater number of cells in the generated images; the number of cells parameter was significantly different; the mean cell area decreased with increasing whole-wheat flour content, regardless of the percentage of fat replacer used; and that the highest cell density parameter was found in sample 6, which was formulated with the highest relative whole-wheat flour content (95.35%WF+1.6%FR).
The results of image analysis with the chosen binarization algorithms may be used to investigate, approximate and predict different properties of breads.
In short, Dtsu’s method provided a more reliable representation of the crumb structure of bread, and is thus the most suitable in terms of structural representation of the crumb texture.
Acknowledgements
The authors thank Fundação de Amparo à Pesquisa e Inovação do Estado de Santa Catarina (FAPESC) for financial support.
References
American Association of Cereal Chemists – AACC. (2000). Approved
methods of analysis. 10th ed. St Paul: AACC.
Bárcenas, M. E., D-Keller, J. D., & Rosell, C. M. (2009). Influence of different hydrocolloids on major wheat dough components (gluten and starch). Journal of Food Engineering, 94(3-4), 241-247. http:// dx.doi.org/10.1016/j.jfoodeng.2009.03.012.
Brasil, Ministério da Saúde. (2005). Guia alimentar para população
brasileira: promovendo a alimentação saudável (Normas e Manuais
Técnicos, Série A). Brasília, DF.
Collar, C., Santos, E., & Rosell, C. M. (2006). Significance of dietary fiber on the viscometric pattern of pasted and gelled flour-fiber blends. Cereal Chemistry, 83(4), 370-376. http://dx.doi.org/10.1094/ CC-83-0370.
Collar, C., Santos, E., & Rosell, C. M. (2007). Assesment of the rheological profile of fibre-enriched Bread doughs by response surface methodology. Journal of Food Engineering, 78(3), 820-826. http://dx.doi.org/10.1016/j.jfoodeng.2005.11.026.
Dubois, D. K. (1978). Practical application of fibre materials in bread production. The Bakers Digest, 52(2), 30-33.
Esteller, M. S., & Lannes, S. C. S. (2005). Parâmetros complementares para fixação de identidade e qualidade de produtos panificados.
Ciência e Tecnologia de Alimentos, 25(4), 802-806. http://dx.doi.
org/10.1590/S0101-20612005000400028.
Farrera-Rebollo, R. R., Salgado-Cruz, M. P., Chanona-Pérez, J., Gutiérrez-Lopes, G. F., Alamilla-Beltrán, L., & Calderón-Dominguez, G. (2012). Evaluation of image analysis tools for characterization of sweet bread crumb structure. Food Bioprocess Technology, 5(2), 474-484. http:// dx.doi.org/10.1007/s11947-011-0513-y.
Flander, L., Salmenkallio-Marttila, M., Suortti, T., & Autio, K. (2007). Dptimization of ingredients and baking process for improved wholemeal oat bread quality. LWT - Food Science and Technology
(Campinas), 40, 860-870.
Goesaert, H., Brijs, K., Veraverbeke, W. S., Courtin, C. M., Gebruers, K., & Delcour, J. A. (2005). Wheat flour constituents: how they impact
bread quality, and how to impact their functionality. Trends in Food
Science & Technology, 16(1-3), 12-30. http://dx.doi.org/10.1016/j.
tifs.2004.02.011.
Gonzales-Barron, U., & Butler, F. (2006). A comparison of seven thresholding techniques with the k-means clustering algorithm for measurement of bread-crumb features by digital image analysis. Journal
of Food Engineering, 74(2), 268-278. http://dx.doi.org/10.1016/j.
jfoodeng.2005.03.007.
Heiman, A., & Lowengart, D. (2014). Calorie information effects on consumers’ food choice: sources of observed gender heterrogeneity.
Journal of Business Research, 67(5), 964-973. http://dx.doi.org/10.1016/j.
jbusres.2013.08.002.
Hellyer, N. E., Fraser, I., & Haddock-Fraser, J. (2012). Food choice, health information and functional ingredients: An experimental auction employing bread. Food Policy, 37(3), 232-245. http://dx.doi. org/10.1016/j.foodpol.2012.02.005.
Herbert, A. (2014). ImageJ colocalisation plugins. ImageJ. Retrieved from http://www.sussex.ac.uk/gdsc/intranet/pdfs/Colocalisation.pdf Hruskova, M., Svec, I., Hofmanova, T., & Dvorakova, J. (2012). Image
analysis – comparison of recipe composition effect. Procedia Engineering,
42, 955-963. http://dx.doi.org/10.1016/j.proeng.2012.07.489. Jackman, P., & Sun, D. (2013). Recent advances in image processing
using image texture features for food quality assessment. Trends in
Food Science & Technology, 29(1), 35-43. http://dx.doi.org/10.1016/j.
tifs.2012.08.008.
Kihlberg, I., Johansson, L., Kohler, A., & Risvik, E. (2004). Sensory qualities of whole wheat pan bread—influence of farming system, milling and baking technique. Journal of Cereal Science, 39(1), 67-84. http://dx.doi.org/10.1016/S0733-5210(03)00067-5.
Lodi, A., & Vodovotz, Y. (2008). Physical properties and water state changes during storage in soy bread with and without almond.
Cereal Chemistry, 110, 554-561.
Mandala, I., Karabela, D., & Kostaropoulos, A. (2007). Physical properties of breads containing hydrocolloids stored at low temperature. I. Effect of chilling. Food Hydrocolloids, 21(8), 1397-1406. http:// dx.doi.org/10.1016/j.foodhyd.2006.11.007.
Mondal, A., & Datta, A. K. (2008). Bread Baking – A Review. Journal
of Food Engineering, 86(4), 465-474. http://dx.doi.org/10.1016/j.
jfoodeng.2007.11.014.
Montgomery, D. C. (1991). Diseño y análisis de experimentos. México: Iberoamérica.
Mouliney, M., Lavery, B., Sharma, R., & Jenner, C. (2011). Waxy durum and fat differ in their actions as improvers of bread quality. Journal
of Cereal Science, 54(3), 317-323. http://dx.doi.org/10.1016/j.
jcs.2011.06.009.
Dro, T. (2013). Adaptação de métodos para avaliação da qualidade
tecnológica de farinha de trigo integral (Tese de doutorado). Federal
University of Santa Catarina, Florianópolis.
Dtsu, N. (1979). A threshold selection method from grey-level histograms.
IEEE Transactions on Systems, Man, and Cybernetics, 9(1), 62-66.
http://dx.doi.org/10.1109/TSMC.1979.4310076.
Dzkoc, S. D., Sumnu, G., & Sahin, S. (2009). The effects of gums on macro and micro-structure of breads baked in different ovens.
Food Hydrocolloids, 23(8), 2182-2189. http://dx.doi.org/10.1016/j.
foodhyd.2009.04.003.
Polaki, A., Xasapis, P., Fasseas, C., Yanniotis, S., & Mandala, I. (2010). Fiber and hydrocolloid content affect the microstructural and sensory characteristics of fresh and frozen stored bread. Journal
of Food Engineering, 97(1), 1-7. http://dx.doi.org/10.1016/j.
Pomeranz, Y., Shogren, M. D., Finney, K. F., & Bechtel, D. B. (1977). Fibre in breadmaking – Effects on functional properties. Cereal
Chemistry, 54(1), 25-41.
Pourfarzad, A., Mahadavian-Mehr, H., & Sedaghat, N. (2013). Coffee silverskin as a source of dietary fiber in bread-making: Dptimization of chemical treatment using response surface methodology. LWT -
Food Science and Technology (Campinas), 50, 599-606.
Prats-Montalbán, J. M., Juan, A., & Ferrer, A. (2011). Multivariate image analysis: a review with applications. Chemometrics and Intelligent
Laboratory Systems, 107(1), 1-23. http://dx.doi.org/10.1016/j.
chemolab.2011.03.002.
Qing-guo, H., Min, Z., Mujumdar, A. S., Wei-hua, D., & Jin-cai, S. (2006). Effect of different drying methods on the quality changes of granular edamame. Drying Technology, 24(8), 1025-1032. http:// dx.doi.org/10.1080/07373930600776217.
Ridler, T. W., & Calvard, S. (1978). Picture thresholding using an iterative selection method. IEEE Transactions on Systems, Man, and Cybernetics,
8(8), 630-632. http://dx.doi.org/10.1109/TSMC.1978.4310039. Rosell, C. M., & Santos, E. (2010). Impact of fibers on physical characteristics
of fresh and staled bake off bread. Journal of Food Engineering,
98(2), 273-281. http://dx.doi.org/10.1016/j.jfoodeng.2010.01.008. Sahoo, P. K., Soltani, S., & Wong, K. C. (1988). A survey of thresholding
techniques. Computer Vision Graphics and Image Processing, 41(2), 233-260. http://dx.doi.org/10.1016/0734-189X(88)90022-9. Sanz-Penella, J. M., Wronkowska, M., Soral-Smietana, M., & Haros,
M. (2013). Effect of whole amaranth flour on bread properties and nutritive value. LWT – Food Science and Technology (Campinas),
50, 679-685.
Scanlon, M. G., & Zghal, M. C. (2001). Bread properties and crumb structure. Food Research International, 34(10), 841-864. http://dx.doi. org/10.1016/S0963-9969(01)00109-0.
Scheuer, P. M., Mattioni, B., Barreto, P. L. M., Montenegro, F. M., Gomes-Ruffi, C. R., Biondi, S., Kilpp, M., & Francisco, A. (2014). Effects
of fat replacement on properties of whole wheat bread. Brazilian
Journal of Pharmaceutical Sciences. In press.
Seyer, M., & Gélinas, P. (2009). Bran characteristics and wheat performance in whole wheat bread. Food Science and Technology (Campinas.),
44(4), 688-693. http://dx.doi.org/10.1111/j.1365-2621.2008.01819.x. Skendi, A., Biliaderis, C. G., Papageorgiou, M., & Izydorczyk, M. S.
(2010). Effects of two barley b-glucan isolates on wheat flour dough and bread properties. Food Chemistry, 119(3), 1159-1167. http:// dx.doi.org/10.1016/j.foodchem.2009.08.030.
Sturges, H. A. (1926). The Choice of a Class Interval. Journal of the
American Statistical Association, 21(153), 65-66. http://dx.doi.org/
10.1080/01621459.1926.10502161.
Torri, L., Migliorini, P., & Masoero, G. (2013). Sensory test vs. electronic nose and/or image analysis of whole bread produced with old and modern wheat varieties adjuvanted by means of the mycorrhizal factor. Food Research International, 54, 1400-1408.
Vuholm, S., Arildsen Jakobsen, L. M., Vejrum Sørensen, K., Kehlet, U., Raben, A., & Kristensen, M. (2014). Appetite and food intake after consumption of sausages with 10% fat and added wheat or rye bran.
Appetite, 73, 205-211. http://dx.doi.org/10.1016/j.appet.2013.09.028.
PMid:24511620
Wu, Y., Lin, Q., Chen, Z., Wu, W., & Xiao, H. (2012). Fractal analysis of the retrogradation of rice starch by digital image processing. Journal
of Food Engineering, 109(1), 182-187. http://dx.doi.org/10.1016/j.
jfoodeng.2011.10.006.
Zahn, S., Pepke, F., & Rohm, H. (2010). Effect of inulin as a fat replacer on texture and sensory properties of muffins. International Journal
of Food Science & Technology, 45(12), 2531-2537. http://dx.doi.
org/10.1111/j.1365-2621.2010.02444.x.
Zghal, M. C., Scanlon, M. G., & Sapirstein, H. D. (1999). Prediction of bread crumb density by digital image analysis. Cereal Chemistry,