Fertilization response likelihood For the
interpretation oF leaF analyses
(1)
Celsemy eleutério Maia
(2)sUMMary
leaf analysis is the chemical evaluation of the nutritional status where the nutrient concentrations found in the tissue reflect the nutritional status of the plants. thus, a correct interpretation of the results of leaf analysis is fundamental for an effective use of this tool. the purpose of this study was to propose and compare the method of Fertilization response likelihood (Frl) for interpretation of leaf analysis with that of the diagnosis and recommendation integrated system (dris). the database consisted of 157 analyses of the n, p, k, Ca, Mg, s, Cu, Fe, Mn, zn, and B concentrations in coffee leaves, which were divided into two groups: low yield (< 30 bags ha-1) and high yield (≥ 30 bags ha-1).
the dris indices were calculated using the method proposed by Jones (1981). the fertilization response likelihood was computed based on the approximation of normal distribution. it was found that the Fertilization response likelihood (Frl) allowed an evaluation of the nutritional status of coffee trees, coinciding with the dris-based diagnoses in 84.96 % of the crops.
index terms: modeling, nutritional status, dris.
resUMo
:
PROBABILIDADE DE RESPOSTA À ADUBAÇÃO PARA
INTERPRETAÇÃO DE ANÁLISE FOLIAR
A análise foliar é uma avaliação química do estado nutricional, em que as concentrações de nutrientes encontradas no tecido refletem o estado nutricional das plantas. Assim, a correta interpretação dos resultados de análise foliar é fundamental para o uso eficaz dessa ferramenta. O objetivo deste trabalho foi propor e comparar o método da Probabilidade de Resposta à Adubação (PRA) para interpretação da análise foliar com a do Sistema Integrado de Diagnose e Recomendação (DRIS). O banco de dados foi composto de 157 análises das
(1) received for publication in august 10, 2010 and approved in december 19, 2011.
concentrações de N, P, K, Ca, Mg, S, Cu, Fe, Mn, Zn e B nas folhas de café, que foram divididas em duas populações: baixa produtividade (< 30 sc ha-1) e alta produtividade (≥ 30 sc ha-1). O cálculo dos índices DRIS foi feito usando o método proposto por Jones (1981). A PRA foi calculada com base na aproximação da distribuição normal. Conclui-se, para a cultura do café, que a PRA possibilitou avaliar o estado nutricional do cafeeiro, com 84,96 % das lavouras avaliadas, o que coincidiu com o diagnóstico feito pelo DRIS.
Termos de indexação: modelagem, estado nutricional, DRIS.
introdUCtion
leaf diagnosis has served to evaluate the
nutritional status of plants based on chemical
analyses of a plant tissue that is sensitive enough
to show variations in nutrient levels. the use of leaf
analysis as a diagnostic criterion is based on the
premise that there is a relationship between nutrient
supply and the levels of the leaf elements, and that
concentration increases or decreases are related to
higher or lower yields. the nutrient content in the
plant is a composite value of all factors that interact
to affect it. to interpret the results of chemical
analysis of plants adequately, it is necessary to know
the factors that affect nutrient concentrations, the
standardized sampling procedures and the pertinent
relationships. For this purpose, various researchers
have used different methods to assess the nutritional
status of plants, e.g., tonin et al. (2009), Urano et al.
(2007) and Maia et al. (2001) using the critical level
(Cl), serra et al. (2010) and Farnezi et al. (2009)
using the sufficiency range and ramakrishna et
al. (2009) and Wadt (2005) using dris. For coffee,
this last method is most commonly used to assess
the plant nutritional status.
in practice, the calculated values of the dris
indices are used to interpret the result of leaf
analysis. the nutrient with the most negative
dris index is considered the most limiting for
crop yield. however, Wadt (1996) proposed a safer
criterion for the interpretation of dris indices,
called Fertilization response potential. Based
on this criterion, the mean nutritional Balance
index (nBi
m) is estimated, which consists of the
arithmetic mean of the module of all dris indices.
according to the above author, nBi
mwas chosen
as a value that reflects the mean deviation of each
nutrient from the reference value; different degrees
of expectation of response to fertilization can be
attributed to a nutrient according to the order of
limitation and of comparison of the dris index with
the nBi
mvalue, such that the nutritional status of
a plant for each nutrient can be classified in five
categories of fertilization response likelihood: “most
deficient”, “deficient”, “balanced”, “excessive” and
“highly excessive”. thus, it is expected that these
five classes of Fertilization response potential
may guide the adjustments of the quantity of each
nutrient to be applied to the coffee crops (Wadt &
alvarez V., 2005).
the purpose of this study was to propose a new
method of interpretation of leaf analysis based
on the use of Fertilization response likelihood
(Frl), and compare it with the diagnosis and
recommendation integrated system (dris), using
leaf analysis data for coffee.
Material and Methods
to interpret leaf analysis using the new method
proposed in this study (Frl) and compare it with the
dris method, leaf analysis and yield results of 157
coffee plantations from the state of espirito santo,
Brazil were used (data revised in leite, 1993). only
leaf tissues of high-yielding crops were considered
(yield > 30 bags ha
-1of coffee) to create a reference
population, and analyzed for the nutrients n, p,
k, Ca, Mg, s, Fe, zn, Mn, B and Cu. the methods
dris and Frl were compared for the most limiting
nutrient only, defined as the nutrient with the most
negative dris index and highest Frl.
Before computing the dris indices, the
nutrient ratios were calculated, expressed by the
relationships
A/B
for sample and
a/b
for the
high-yielding population. thus, the function
f(A/B)
was
calculated according to Jones (1981) by equation 1.
(1)
where
A/B
is the quotient of nutrient content
“a” divided by nutrient content “B”, evaluated in
the sample;
a/b
is the mean of the quotients of
nutrient content “a” divided by nutrient content
“B”, evaluated in the reference population;
s
a/bis the
standard deviation associated with the mean
a/b
.
the dris index for each nutrient was obtained
by equation 2.
n
m
A
B
i
f
B
i
A
f
I
n i m i i+
−
=
∑
=1∑
=1where
∑
= n iB
i
A
f
1)
/
(
is the sum of the functions in
which nutrient “a” appears in the numerator;
∑
= m iA
B
i
f
1)
/
(
is the sum of the functions in which
nutrient “a” appears in the denominator;
n
is
the number of times the nutrient appears in the
numerator
m
is the number of times the nutrient
appears in the denominator.
the model proposed to calculate the Fertilization
response likelihood is based on an approximation
of the normal distribution function. thus, with
s
x
x
z
i=
−
, where
x
is the nutrient concentration
in the sample and
x
and
s
the mean and the
standard deviation of the nutrient concentration in
the high yield group, respectively, the approximate
normal distribution function is given by
, with
. the complementary function is
given by
, with y being the Fertilization
response likelihood (
FRL
) for nutrient
i
, calculated
by equation 3:
(3)
the nutritional Balance index (nBi) for dris
was calculated by equation 4, according to Beaufils
(1973), and the nutritional imbalance index (nii)
for
FRL
was calculated by equation 5.
NBI
=
∑
Index
DRIS
(4)
(5)
resUlts and disCUssion
the dris and Frl indices for coffee yields of up
to 10 bags ha
-1, respectively, are shown in tables 1
and 2. a comparison of the two tables shows that
the dris has no homogeneous scale to identify any
nutritional limitations in the areas. For example, for
the crops with yields of 6 bags ha
-1the dris indices
of the most yield-limiting nutrient ranged from
-70.55 to -15.26, and when using the
FRL
, the values
ranged from 0.94 to 0.99. taking into consideration
that the dris index is the mean of the functions
in the direct (
f(A/B)
) and inverse (
f(B/A)
) form,
for
f(A/B)
=
-f(B/A)
and that these relationships
are calculated using the equation proposed by
Jones (1981), the relationship between
A/B
and
f(A/B)
is linear. thus, the greater the distance
of
A/B
from the mean of the relationship, the
greater the deviation in absolute values. Contrary
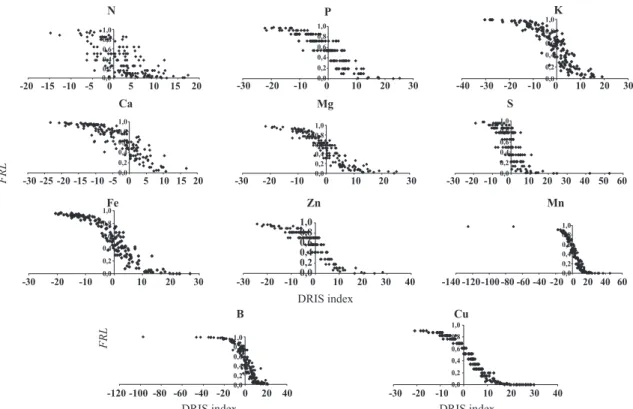
to the dris, the
FRL
calculates the Fertilization
response likelihood between 0 and 1, according to
the leaf nutrient concentration and that at this leaf
concentration, the plant responds to fertilization,
expressed in the high likelihood of response, with a
non-linear relationship (Figure 1).
taking into consideration only the most
yield-limiting nutrient, with the most negative dris
index and the greatest likelihood of response
to fertilization
FRL
for low-yielding crops (<
30 bags ha
-1), it was observed that of 133 crops,
the diagnoses by the two methods do not coincide
in only 20 of them (15.04 %). in crops with yields
below 11 bags ha
-1(51 samples), only 3 were at
variance (5.88 %) and for yield between 11-21 and
above 21 bags ha
-1, 12 (22.64 % of 53 samples) and
5 (17.24 % of 29 samples) samples were at variance,
respectively (table 3).
although 15 samples did not coincide in the
diagnosis of nutritional status, in some cases the
FRL
diagnosed a response likelihood, e.g., for the
two crops that produced 7 bags ha
-1(table 4). By
the dris, the order of limitation, with its respective
indices for the three most limiting nutrients, was Cu
(-17.33) > Mg (-11.28) > Ca (-7.51) and Fe (-16.27) >
Ca (-13.35) > Mg (-11.45), respectively, and for the
FRL
it was Mg (0.94) > Ca (0.94) > Cu (0.91) and s
(0.92) > Fe (0.92) > Ca (0.92). this shows that for the
first sample, Cu was the most limiting element by
table 1. dris index for coffee yields up to 10 bags ha-1
yield n p k Ca Mg s Fe zn Mn B Cu
bag ha-1 dris index
2 2.06 -13.30 15.35 -9.34 -4.58 0.65 -3.96 -7.32 22.91 -2.84 0.37 3 3.23 10.03 -28.26 -11.04 15.78 4.98 -2.72 2.22 -6.09 8.74 3.11 3 -5.28 -11.55 1.77 -13.51 -2.02 -8.03 26.76 -6.95 1.38 2.00 15.44 3 -6.25 -10.23 1.76 -7.09 -0.93 7.91 4.59 -22.23 5.73 7.15 19.59 3 11.19 4.64 11.33 -15.16 0.34 -19.07 -14.95 -1.42 4.30 -2.51 21.31 4 8.32 10.68 11.89 4.84 7.04 -3.63 5.61 6.25 -17.46 -32.49 -1.05 4 -3.81 -11.04 -8.23 2.94 0.51 -9.22 7.82 24.71 -5.58 -0.16 2.07
4 2.17 -9.52 5.19 -5.09 -2.64 9.66 0.74 -0.71 -8.13 9.21 -0.87
4 5.84 2.75 -11.25 -14.36 10.54 -3.87 -12.46 -6.01 -1.21 18.82 11.20 4 -12.68 13.77 4.96 -18.93 -9.57 2.45 5.44 -12.64 -1.75 8.91 20.04 5 -1.83 5.34 9.40 -10.43 -4.92 -4.52 -14.40 4.65 16.96 5.19 -5.44
5 2.50 2.27 2.55 -12.59 -4.67 -1.53 8.82 4.53 6.17 -6.12 -1.92
6 1.03 0.83 6.34 0.34 1.32 -0.81 -3.82 -0.06 9.37 -32.94 18.39
6 11.99 12.56 0.16 5.83 22.29 2.21 3.32 1.59 -70.55 19.74 -9.13
6 16.15 4.66 -15.26 2.14 -6.24 -6.56 -13.31 -3.36 22.11 7.73 -8.07 6 7.14 2.40 3.52 4.09 -1.00 -1.22 -20.46 5.20 20.61 -5.28 -15.00 6 7.76 -4.76 9.98 -1.25 -10.68 -5.92 22.99 -17.28 3.83 -14.22 9.56
7 1.27 -6.32 -5.72 10.03 0.51 4.96 3.40 8.51 -5.46 -23.54 12.35
7 -2.24 -16.74 6.14 1.10 -1.36 -4.98 0.57 -6.42 0.65 16.35 6.95
7 2.31 1.53 0.22 -0.84 3.58 -4.51 5.88 0.67 1.70 -10.78 0.24
7 8.08 -3.20 -8.94 5.10 9.58 -3.04 -16.66 5.85 -12.59 9.81 6.02
7 12.38 -22.19 -17.51 -8.58 2.52 -10.38 8.79 -10.84 17.74 10.74 17.32
7 -1.77 -13.77 1.71 0.56 -6.69 3.15 -1.02 -8.13 2.83 14.24 8.88
7 3.07 -2.28 -6.13 0.55 -0.92 -2.07 -12.25 0.43 -1.60 2.94 18.27
7 3.67 -1.07 -5.60 -5.45 1.16 -7.62 -12.65 4.07 7.94 1.93 13.62
7 0.22 -4.13 6.07 -0.48 -1.76 5.79 -4.36 -7.02 -9.12 7.55 7.24
7 16.55 5.29 -4.11 -7.51 -11.28 1.58 0.72 -5.95 12.61 9.43 -17.33 7 3.34 5.55 -1.67 -13.35 -11.95 -11.45 -16.27 -5.12 32.10 3.01 15.83 8 2.33 6.98 -27.71 -8.48 12.21 -3.24 -15.05 7.70 -6.05 7.04 24.28 8 -3.02 -11.65 -22.82 0.29 13.13 -4.85 20.89 -16.92 45.23 -42.56 22.29 8 0.82 -0.19 -11.87 -6.76 4.71 -3.96 -8.38 -0.64 2.73 17.37 6.17 8 -14.75 10.56 -14.47 -10.28 1.66 0.41 23.14 -10.54 -5.56 -2.85 22.67 8 1.57 -1.33 8.57 -15.57 -6.14 13.30 -15.16 -0.76 19.66 -9.76 5.62 8 10.53 -3.44 19.04 -10.53 -15.57 -2.09 7.36 0.90 9.49 -4.62 -11.07 8 1.32 -10.67 -11.08 -7.47 8.27 -9.42 -0.50 -6.31 13.97 11.92 9.97 9 0.35 -12.22 3.32 -10.50 -3.98 4.80 -2.84 0.05 -0.94 12.23 9.72
9 5.85 0.23 -13.60 6.01 2.24 -1.35 -12.53 2.62 -1.12 8.43 3.21
9 8.85 14.29 -7.72 -17.64 2.69 -3.37 -12.86 -4.09 9.72 1.29 8.83 9 4.33 2.42 -12.40 -9.94 5.99 -8.22 -19.67 -1.17 36.90 10.50 -8.74 10 2.78 -1.44 -2.38 -18.01 -1.92 8.39 -10.39 -4.75 10.44 -5.06 22.33 10 9.59 -12.80 -10.43 -18.99 -18.57 16.91 -7.54 1.08 14.30 16.10 10.35
10 5.11 -8.38 3.13 -7.73 -2.33 0.36 -5.09 -0.36 6.69 2.25 6.35
10 0.33 6.28 -13.15 -3.17 10.06 -2.69 -11.63 -1.43 7.41 5.76 2.24
dris and the third most limiting by
FRL
; however,
by
FRL
, even with Cu being the third most limiting
nutrient, the fertilization response likelihood was
0.91. For the second sample, by
FRL
, the most
limiting nutrient was s, and the fourth most
limiting by dris; however, the fertilization response
likelihood for s, Fe and Ca was similar, differing
only in the third decimal place, and rounded, the
FRL
was 0.92 for the three nutrients.
evaluating the nutritional Balance index (nBi)
and the nutritional imbalance index (nii) in
accordance with the coffee yield it was observed that,
for the two indices, the relationship was negative
(Figure 2). For the dris, this negative effect was
already discussed in the literature, as reported
by silva et al. (2009), Guindani et al. (2009) and
partelli et al. (2006); however, this same behavior
was observed for
FRL,
although with a greater
correlation coefficient for nii than for nBi.
When the
FRL
was related to the dris indices for
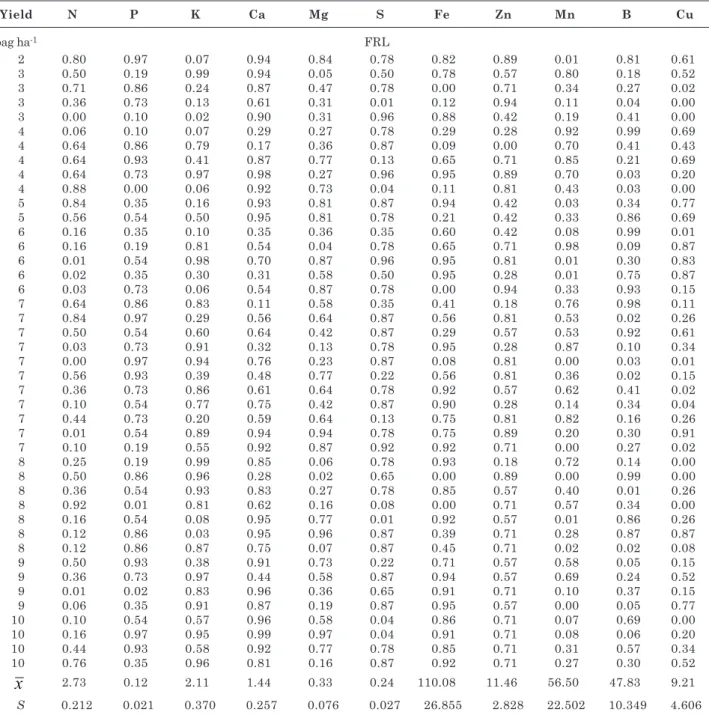
table 2. Fertilization response likelihood (FRL) for coffee yields up to 10 bags ha-1 and reference standards
using the mean (
x
) and standard deviation (s) of nutrients in the high yield group (> 30 bags ha-1)yield n p k Ca Mg s Fe zn Mn B Cu
bag ha-1 Frl
2 0.80 0.97 0.07 0.94 0.84 0.78 0.82 0.89 0.01 0.81 0.61
3 0.50 0.19 0.99 0.94 0.05 0.50 0.78 0.57 0.80 0.18 0.52
3 0.71 0.86 0.24 0.87 0.47 0.78 0.00 0.71 0.34 0.27 0.02
3 0.36 0.73 0.13 0.61 0.31 0.01 0.12 0.94 0.11 0.04 0.00
3 0.00 0.10 0.02 0.90 0.31 0.96 0.88 0.42 0.19 0.41 0.00
4 0.06 0.10 0.07 0.29 0.27 0.78 0.29 0.28 0.92 0.99 0.69
4 0.64 0.86 0.79 0.17 0.36 0.87 0.09 0.00 0.70 0.41 0.43
4 0.64 0.93 0.41 0.87 0.77 0.13 0.65 0.71 0.85 0.21 0.69
4 0.64 0.73 0.97 0.98 0.27 0.96 0.95 0.89 0.70 0.03 0.20
4 0.88 0.00 0.06 0.92 0.73 0.04 0.11 0.81 0.43 0.03 0.00
5 0.84 0.35 0.16 0.93 0.81 0.87 0.94 0.42 0.03 0.34 0.77
5 0.56 0.54 0.50 0.95 0.81 0.78 0.21 0.42 0.33 0.86 0.69
6 0.16 0.35 0.10 0.35 0.36 0.35 0.60 0.42 0.08 0.99 0.01
6 0.16 0.19 0.81 0.54 0.04 0.78 0.65 0.71 0.98 0.09 0.87
6 0.01 0.54 0.98 0.70 0.87 0.96 0.95 0.81 0.01 0.30 0.83
6 0.02 0.35 0.30 0.31 0.58 0.50 0.95 0.28 0.01 0.75 0.87
6 0.03 0.73 0.06 0.54 0.87 0.78 0.00 0.94 0.33 0.93 0.15
7 0.64 0.86 0.83 0.11 0.58 0.35 0.41 0.18 0.76 0.98 0.11
7 0.84 0.97 0.29 0.56 0.64 0.87 0.56 0.81 0.53 0.02 0.26
7 0.50 0.54 0.60 0.64 0.42 0.87 0.29 0.57 0.53 0.92 0.61
7 0.03 0.73 0.91 0.32 0.13 0.78 0.95 0.28 0.87 0.10 0.34
7 0.00 0.97 0.94 0.76 0.23 0.87 0.08 0.81 0.00 0.03 0.01
7 0.56 0.93 0.39 0.48 0.77 0.22 0.56 0.81 0.36 0.02 0.15
7 0.36 0.73 0.86 0.61 0.64 0.78 0.92 0.57 0.62 0.41 0.02
7 0.10 0.54 0.77 0.75 0.42 0.87 0.90 0.28 0.14 0.34 0.04
7 0.44 0.73 0.20 0.59 0.64 0.13 0.75 0.81 0.82 0.16 0.26
7 0.01 0.54 0.89 0.94 0.94 0.78 0.75 0.89 0.20 0.30 0.91
7 0.10 0.19 0.55 0.92 0.87 0.92 0.92 0.71 0.00 0.27 0.02
8 0.25 0.19 0.99 0.85 0.06 0.78 0.93 0.18 0.72 0.14 0.00
8 0.50 0.86 0.96 0.28 0.02 0.65 0.00 0.89 0.00 0.99 0.00
8 0.36 0.54 0.93 0.83 0.27 0.78 0.85 0.57 0.40 0.01 0.26
8 0.92 0.01 0.81 0.62 0.16 0.08 0.00 0.71 0.57 0.34 0.00
8 0.16 0.54 0.08 0.95 0.77 0.01 0.92 0.57 0.01 0.86 0.26
8 0.12 0.86 0.03 0.95 0.96 0.87 0.39 0.71 0.28 0.87 0.87
8 0.12 0.86 0.87 0.75 0.07 0.87 0.45 0.71 0.02 0.02 0.08
9 0.50 0.93 0.38 0.91 0.73 0.22 0.71 0.57 0.58 0.05 0.15
9 0.36 0.73 0.97 0.44 0.58 0.87 0.94 0.57 0.69 0.24 0.52
9 0.01 0.02 0.83 0.96 0.36 0.65 0.91 0.71 0.10 0.37 0.15
9 0.06 0.35 0.91 0.87 0.19 0.87 0.95 0.57 0.00 0.05 0.77
10 0.10 0.54 0.57 0.96 0.58 0.04 0.86 0.71 0.07 0.69 0.00
10 0.16 0.97 0.95 0.99 0.97 0.04 0.91 0.71 0.08 0.06 0.20
10 0.44 0.93 0.58 0.92 0.77 0.78 0.85 0.71 0.31 0.57 0.34
10 0.76 0.35 0.96 0.81 0.16 0.87 0.92 0.71 0.27 0.30 0.52
x
2.73 0.12 2.11 1.44 0.33 0.24 110.08 11.46 56.50 47.83 9.21S 0.212 0.021 0.370 0.257 0.076 0.027 26.855 2.828 22.502 10.349 4.606
table 3. number of crops per yield class, number of non-coincident crops between the dris and the FRL in the low-yielding coffee group
yield number of Crops at variance percentage within the class
bag ha-1 %
yield ≤ 11 51 3 5.88
11 < yield ≤ 21 53 12 22.64
-10 and greater than +10, respectively. thus, when
dris indices are below -10, the
FRL
is greater than
0.8. For dris indices greater than 10, the
FRL
is
below 0.1.
it should be noted that for a concentration of a
determined leaf nutrient equal to the mean of the
same nutrient in the high yield group (
x
=
x
), the
FRL
will be 0.5. this is the case because one is
working with the mean and, even in the high yield
group, there are samples with yields greater than
the mean of this group, justifying a fertilization
response likelihood of 50 %, since the derivative
of equation 3 is an approximation of the normal
distribution. thus, the lower
x
is in relation to
x
,
the greater is the fertilization response likelihood,
and, on the contrary, the greater
x
is in relation to
x
, the lower is this probability.
an advantage of the
FRL
is that the index
calculated is independent of the others, in contrast
to the dris. For example, with the same coffee
data, performing dris only for n, p and k, the dris
correctly detected the deficiency only for samples
1 and 2 (p and k) (table 6); however, as the other
nutrients were ignored, dris detected deficiency
among n, p and k in samples 3, 4, 5 and 6; however,
working with all nutrients, deficiency was observed
for other nutrients (Ca, zn, s and B) by dris. on
the other hand, when the
FRL
is used, even working
only with n, p and k, it was observed that for
samples 1 and 2, the fertilization response likelihood
for p and k, respectively, was high, similar to the
dris, and that for samples 5 and 6, the nutrients
n, p and k have no fertilization response likelihood,
so the limitation was due to deficiency of s and B
for these two samples.
the use of a univariate relationship (
FRL
) in
relation to a bivariate relationship (dris) proves
to be viable, in spite of the fact that, according
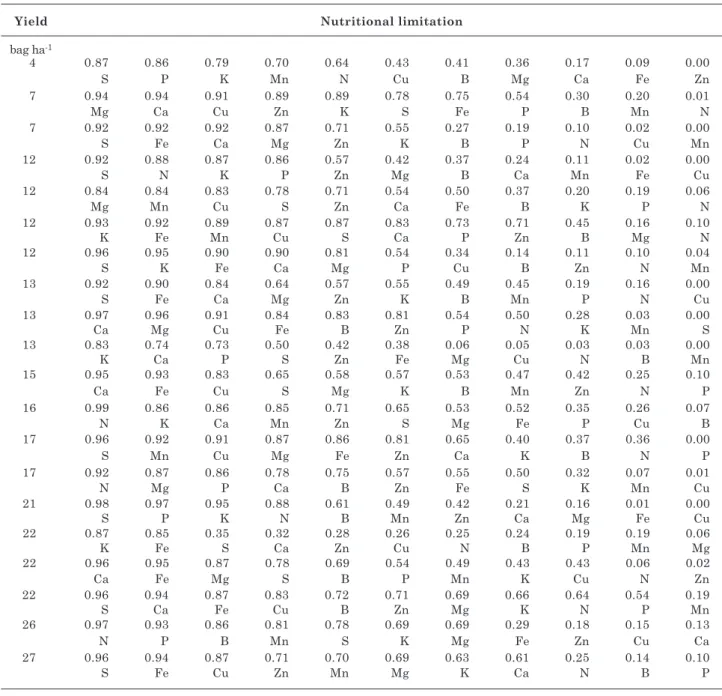
table 4. Classification of the nutritional limitation using the dris index for crops that did not coincide with the FRL
yield nutritional limitation
bag ha-1
4 -11.04 -9.22 -8.23 -5.58 -3.81 -0.16 0.51 2.07 2.94 7.82 24.71
p s k Mn n B Mg Cu Ca Fe zn
7 -17.33 -11.28 -7.51 -5.95 -4.11 0.72 1.58 5.29 9.43 12.61 16.55
Cu Mg Ca zn k Fe s p B Mn n
7 -16.27 -13.35 -11.95 -11.45 -5.12 -1.67 3.01 3.34 5.55 15.83 32.10
Fe Ca Mg s zn k B n p Cu Mn
12 -12.08 -11.89 -11.13 -7.61 -4.19 -1.20 -0.28 1.54 6.84 13.69 26.30
k s p n zn Mg B Ca Mn Fe Cu
12 -8.04 -7.41 -7.00 -3.91 -2.52 1.06 2.09 4.37 6.94 7.15 7.27
Mn Cu Mg s zn Ca Fe B p k n
12 -9.94 -9.74 -8.70 -6.04 -0.75 0.20 1.52 1.79 6.63 11.63 13.40
Mn Cu Fe k Ca s zn p B n Mg
12 -12.78 -10.36 -9.68 -8.76 -6.10 1.63 4.82 6.89 8.57 11.42 14.34
k Fe s Ca Mg p C n B zn Mn
13 -12.32 -10.07 -8.20 -2.77 -1.41 -0.68 -0.50 0.47 3.08 5.93 26.47
Fe s Ca Mg zn k B Mn n p Cu
13 -20.92 -19.24 -18.60 -6.69 -6.39 -5.11 -0.60 0.35 4.28 20.16 52.74
Cu Mg Ca Fe B zn n p k Mn s
13 -13.25 -11.14 -10.26 -6.96 -3.04 -2.13 0.12 6.06 7.71 9.14 23.76
k Ca p s zn Fe n Mg B Cu Mn
15 -11.92 -11.77 -7.55 0.40 1.67 1.71 1.96 4.04 4.76 5.07 11.64
Fe Ca Cu s Mg k B Mn n zn p
16 -9.55 -8.26 -6.21 -5.82 -2.02 1.16 1.91 2.61 5.45 8.01 12.72
Mn n Ca k zn s Mg Fe p Cu B
17 -15.92 -14.16 -7.34 -5.17 -5.06 -2.93 2.97 6.99 7.22 8.17 25.23
Cu Mn s Mg Fe zn Ca n k B p
17 -9.92 -7.79 -5.63 -5.53 -4.96 -0.78 -0.20 0.69 3.77 11.07 19.30
Mg p n Ca B zn Fe s k Mn Cu
21 -19.83 -15.81 -15.04 -4.94 -3.11 -1.31 0.23 4.02 6.18 19.69 29.93
p k s n B Mn zn Ca Mg Fe Cu
22 -11.65 -11.63 -1.94 -1.35 0.36 1.90 2.10 2.98 4.65 5.71 8.85
Fe k n s Ca B zn p Cu Mn Mg
22 -15.26 -13.94 -7.60 -2.14 -1.53 1.89 2.67 3.96 4.18 8.43 19.34
Fe Ca Mg s B p Mn k Cu n zn
22 -8.28 -6.91 -5.76 -5.37 0.32 0.85 1.26 2.85 4.72 5.02 11.31
Ca Cu s Fe B zn Mg k n p Mn
26 -10.68 -7.78 -6.53 -5.39 -1.80 -1.23 -0.98 5.78 8.46 9.39 10.78
p Mn B n Mg s k Fe zn Ca Cu
27 -12.99 -11.23 -8.41 -0.92 -0.64 -0.13 1.97 2.56 6.18 11.14 12.46
table 5. Classification of the nutritional limitation using the FRL for coffee crops that did not coincide with the dris
yield nutritional limitation
bag ha-1
4 0.87 0.86 0.79 0.70 0.64 0.43 0.41 0.36 0.17 0.09 0.00
s p k Mn n Cu B Mg Ca Fe zn
7 0.94 0.94 0.91 0.89 0.89 0.78 0.75 0.54 0.30 0.20 0.01
Mg Ca Cu zn k s Fe p B Mn n
7 0.92 0.92 0.92 0.87 0.71 0.55 0.27 0.19 0.10 0.02 0.00
s Fe Ca Mg zn k B p n Cu Mn
12 0.92 0.88 0.87 0.86 0.57 0.42 0.37 0.24 0.11 0.02 0.00
s n k p zn Mg B Ca Mn Fe Cu
12 0.84 0.84 0.83 0.78 0.71 0.54 0.50 0.37 0.20 0.19 0.06
Mg Mn Cu s zn Ca Fe B k p n
12 0.93 0.92 0.89 0.87 0.87 0.83 0.73 0.71 0.45 0.16 0.10
k Fe Mn Cu s Ca p zn B Mg n
12 0.96 0.95 0.90 0.90 0.81 0.54 0.34 0.14 0.11 0.10 0.04
s k Fe Ca Mg p Cu B zn n Mn
13 0.92 0.90 0.84 0.64 0.57 0.55 0.49 0.45 0.19 0.16 0.00
s Fe Ca Mg zn k B Mn p n Cu
13 0.97 0.96 0.91 0.84 0.83 0.81 0.54 0.50 0.28 0.03 0.00
Ca Mg Cu Fe B zn p n k Mn s
13 0.83 0.74 0.73 0.50 0.42 0.38 0.06 0.05 0.03 0.03 0.00
k Ca p s zn Fe Mg Cu n B Mn
15 0.95 0.93 0.83 0.65 0.58 0.57 0.53 0.47 0.42 0.25 0.10
Ca Fe Cu s Mg k B Mn zn n p
16 0.99 0.86 0.86 0.85 0.71 0.65 0.53 0.52 0.35 0.26 0.07
n k Ca Mn zn s Mg Fe p Cu B
17 0.96 0.92 0.91 0.87 0.86 0.81 0.65 0.40 0.37 0.36 0.00
s Mn Cu Mg Fe zn Ca k B n p
17 0.92 0.87 0.86 0.78 0.75 0.57 0.55 0.50 0.32 0.07 0.01
n Mg p Ca B zn Fe s k Mn Cu
21 0.98 0.97 0.95 0.88 0.61 0.49 0.42 0.21 0.16 0.01 0.00
s p k n B Mn zn Ca Mg Fe Cu
22 0.87 0.85 0.35 0.32 0.28 0.26 0.25 0.24 0.19 0.19 0.06
k Fe s Ca zn Cu n B p Mn Mg
22 0.96 0.95 0.87 0.78 0.69 0.54 0.49 0.43 0.43 0.06 0.02
Ca Fe Mg s B p Mn k Cu n zn
22 0.96 0.94 0.87 0.83 0.72 0.71 0.69 0.66 0.64 0.54 0.19
s Ca Fe Cu B zn Mg k n p Mn
26 0.97 0.93 0.86 0.81 0.78 0.69 0.69 0.29 0.18 0.15 0.13
n p B Mn s k Mg Fe zn Cu Ca
27 0.96 0.94 0.87 0.71 0.70 0.69 0.63 0.61 0.25 0.14 0.10
s Fe Cu zn Mn Mg k Ca n B p
to Jones (1981), one of the main presuppositions
for dris applications is that the relationships
between two nutrients are better indicators of the
nutritional status than the simple use of isolated
concentrations and that the use of the relationships
minimizes the effects of concentration and dilution
(Walworth & sumner, 1987). thus, the use of
relationships between nutrients was developed for
dris to reduce the dependence of interpretations on
sampling variations with regard to age and origin
of the plant tissue. however, epstein & Bloom
(2006) commented that the rational physiological
analysis by dris is frequently not obvious for
many nutrient proportions and that the statement
that the standards are relatively independent of
plant age and location is unconfirmed (Jones Jr.,
1993), while from a more general point of view, the
presuppositions of other estimation methods were
not maintained for dris (reuter & robison, 1997).
ConClUsion
the Fertilization response likelihood (Frl)
allowed an assessment of the nutritional status of
coffee where 84.96% of the crops evaluated coincided
with the dris diagnosis.
Figure 3. relationship between the dris index and the Fertilization response likelihood (FRL) for the nutrients evaluated
table 6. Comparison between the interpretation of leaf contents of n, p and k using dris and FRL
sample yield IN IP IK FRLN FRLP FRLK limiting nutrient
bag ha-1
1 2 1.76 -27.28 25.51 0.80 0.97 0.07 p
2 3 15.11 26.88 -41.99 0.50 0.19 0.99 k
3 3 -0.08 -11.78 11.87 0.71 0.86 0.24 Ca
4 3 -0.88 -10.21 11.09 0.36 0.73 0.13 zn
5 3 2.06 -6.57 4.51 0.00 0.10 0.02 s
literatUre Cited
BeaUFils, e.r. diagnosis and recommendation integrated system (dris). a general scheme for experimentation and calibration based on principles developed from research in plant nutrition. pietermeritzburg, University of natal, 1973. 132p. (soil science Bulletin, 1)
epstein, e. & BlooM, a.J. nutrição mineral de plantas: princípios e perspectives. 2.ed. londrina, planta, 2006. 403p.
Farnezi, M.M.M.; silVa, e.B. & GUiMarÃes, p.t.G. diagnose nutricional de cafeeiros da região do alto Jequitinhonha (MG): normas dris e faixas críticas de nutrientes. r. Bras. Ci. solo, 33:969-978, 2009.
GUindani, r.h.p.; anGhinoni, i. & naChtiGall, G.r. dris na avaliação do estado nutricional do arroz irrigado por inundação. r. Bras. Ci. solo, 33:109-118, 2009. Jones, C.a. proposed modifications of the diagnosis and
recommendation integrated system (dris) for interpreting plant analyses. Comm. soil sci. plant anal., 12:785-794, 1981.
Jones Jr., J.B. Modern interpretation systems for soil and plant analyses in the United states of america. austr. J. exper. agric., 33:1039-1043, 1993.
leite, r.a. avaliação do estado nutricional do cafeeiro conilon no estado do espírito santo, utilizando-se diferentes métodos de interpretação de análise foliar. Viçosa, MG, Universidade Federal de Viçosa, 1993. 87p. (tese de doutorado)
Maia, C.e.; Morais, e.r.C. & oliVeira, M. nível crítico pelo critério da distribuição normal reduzida: Uma nova proposta para interpretação de análise foliar. r. Bras. eng. agríc. amb., 5:235-238, 2001.
partelli, F.l.; Vieira, h.d.; Monnerat, p.h. & Viana, a.p. Comparação de dois métodos dris para o diagnóstico de deficiências nutricionais do cafeeiro. pesq. agropec. Bras., 41:301-306, 2006.
raMakrishna, a.; Bailey, J.s. & kirChhoF, G. a preliminary diagnosis and recommendation integrated system (dris) model for diagnosing the nutrient status of sweet potato (Ipomoea batatas). plant soil, 316:107-116, 2009.
reUter, d.J. & roBison, J.B., eds. plant analysis: an interpretation manual. Melbourne, inkata press, 1997. 572p.
serra, a.p.; MarChetti, M.e.; Vitorino, a.C.t.; noVelino, J.o. & CaMaCho, M.a. determinação de faixas normais de nutrientes no algodoeiro pelos métodos ChM, Cnd e dris. r. Bras. Ci. solo, 34:105-113, 2010. silVa, M.a.C.; natale, W.; Malheiros, e.B. & paVinato,
a. estabelecimento e validação de normas dris para a cultura do algodão no centro-oeste do Brasil. acta sci. agron., 31:93-99, 2009.
tonin, t.a.; MUniz, a.s.; sCapiM, C.a.; silVa, M.a.G.; alBreCht, l.p. & Conrado, t.V. avaliação do estado nutricional das cultivares de uva itália e rubi no município de Marialva, estado do paraná. acta sci. agron., 31:63-69, 2009.
Urano, e.o.M.; kUrihara, C.h.; Maeda, s.; Vitorino, a.C.t.; GonÇalVes, M.C. & MarChetti, M.e. determinação de teores ótimos de nutrientes em soja pelos métodos chance matemática, sistema integrado de diagnose e recomendação e diagnose da composição nutricional. r. Bras. Ci. solo, 31:63-72, 2007.
Wadt, p.G.s. & alVarez V., V.h. Monitoramento nutricional. in: Wadt, p.G.s., ed. Manejo do solo e recomendação de adubação para o estado do acre. rio Branco, 2005. p.227-244.
Wadt, p.G.s. os métodos da Chance Matemática e do sistema integrado de diagnose e recomendação (dris) na avaliação nutricional de plantios de eucalipto. Viçosa, MG, Universidade Federal de Viçosa, 1996. 99p. (tese de doutorado)
Wadt, p.G.s. relationships between soil class and nutritional status of coffee plantations. r. Bras. Ci. solo, 29:227-234, 2005.