SOIL LOSS RISK AND HABITAT QUALITY IN STREAMS
OF A MESO-SCALE RIVER BASIN
Alexandre Marco da Silva1*; Lilian Casatti2; Clayton Alcarde Alvares3; Aline Maria Leite3; Luiz Antonio Martinelli3; Steven F. Durrant1
1
UNESP - Campus Experimental de Sorocaba - Av. Três de Março, 511 - 18087-180 - Sorocaba, SP - Brasil. 2
UNESP/IBILCE Depto. de Zoologia R. Cristóvão Colombo, 2265 15054000 São José do Rio Preto, SP Brasil.
3
USP/CENA - C.P. 96 - 13400-970 - Piracicaba, SP - Brasil. *Corresponding author <amsilva@sorocaba.unesp.br>
ABSTRACT: Soil loss expectation and possible relationships among soil erosion, riparian vegetation and water quality were studied in the São José dos Dourados River basin, State of São Paulo, Brazil. Through Geographic Information System (GIS) resources and technology, Soil Loss Expectation (SLE) data obtained using the Universal Soil Loss Equation (USLE) model were analyzed. For the whole catchment area and for the 30 m buffer strips of the streams of 22 randomly selected catchments, the predominant land use and habitat quality were studied. Owing mainly to the high soil erodibility, the river basin is highly susceptible to erosive processes. Habitat quality analyses revealed that the superficial water from the catchments is not chemically impacted but suffers physical damage. A high chemical purity is observed since there are no urban areas along the catchments. The water is physically poor because of high rates of sediment delivery and the almost nonexistence of riparian vegetation. Key words: erosion modeling, expectation of soil loss map, riparian vegetation, water quality
RISCO DE PERDA DE SOLO E QUALIDADE DO
HABITAT
NUMA
BACIA HIDROGRÁFICA DE MESO-ESCALA
RESUMO: Expectativa de perda de solo e possíveis relações entre erosão, vegetação ripária e qualidade da água foram estudados na bacia do rio São José dos Dourados (SP). Através de recursos de geoprocessamento e da Equação Universal de Perda de Solos, os dados sobre expectativa de perda de solo foram levantados. Para a área de drenagem total e a faixa tampão dos corpos d’água de 22 sub-bacias aleatoriamente selecionadas, analisou-se a cobertura do solo predominante e qualidade do
habitat. Devido principalmente à alta erodibilidade do solo, a área estudada é altamente suscetível ao
processo erosivo. As análises de qualidade da água revelaram que as águas superficiais das sub-bacias estão quimicamente não impactadas, mas fisicamente degradadas. A alta pureza química deve-se, possivelmente, à ausência de áreas urbanizadas ao longo das sub-bacias e as alterações nas características físicas são, possivelmente, decorrentes das altas taxas de transferência de sedimento aos corpos d’água e à quase ausência de mata ciliar.
Palavras-chave: modelagem de erosão, expectativa de perda de solo, vegetação ripária, qualidade da água
INTRODUCTION
The land use of a catchment exerts an impor-tant impact on the erosive processes within a region (Lufafa et al., 2003; Costa et al., 2003) and on the health of rivers (Naiman & Décamps, 1997). This re-lationship has been investigated worldwide (Silva & Williams, 2001; Allan, 2004), and in Brazil some stud-ies have been carried out to better understand such re-lations (Alvares & Silva, 2005; Barrella & Petrere, 2003; Casatti et al., 2006).
Owing to important and interesting components that are favorable to some human activities (Fischer et
For this purpose, modern technology has pro-vided effective analytical tools such as remote sens-ing and satellite imagsens-ing, GIS, and expert systems to facilitate studies of environmental impacts. Addition-ally, habitat and water quality are also evaluated using individual variables or combined metrics (Casatti et al., 2006). Thus, a wide variety of assessment methods is available to evaluate the response of stream condi-tions to a gradient in land use (Allan, 2004). Although these studies have become more common over the past 20 years, they leave many questions unanswered. For instance, there is still an ongoing dispute as to whether the land use of the entire catchment or that of the ri-parian zone is more important in influencing the wa-ter quality, all other factors remaining constant (Sliva & Williams, 2001).
In this study we estimated the expectation of soil loss and also analyzed possible relationships that the erosive process has with the habitat quality in the river network of the São José dos Dourados river ba-sin (SJD).
MATERIAL AND METHODS
Study area
The study area is a meso-scale river basin situated in the Northwest of São Paulo State
(South-eastern Brazil), between latitudes 20o15’36" and
20o51’32" and longitudes 49o31’30" and 51o21’32"
(Figure 1). It is a 6th order basin (Strahler, 1957) and
encompasses a drainage area of 5,158.9 km2. It
com-prises a delimited area for water resources and is lo-cated in the Serra Geral formation, with basalt and sedimentary rocks of the Caiuá and Bauru groups (IPT, 2000).
The climate is of the hot tropical type (Nimer, 1989), with maximum mean temperatures ranging from 31 to 32°C, and minimum mean temperatures of 13° to 14°C. The average annual rainfall ranges from
1,300 to 1,800 mm. The predominant original vegeta-tion is “Semi Deciduous Seasonal Forest”, but patches of Savanna (“Cerrado”) also occur in the area.
The SJD river basin is an important agricul-tural region, presenting one of the highest livestock populations for milk and meat production in Brazil (named mix production – CATI, 2006). Thus, pasture is the main land-cover class that occurs in the region (Casatti et al., 2006). The soil and water resources have been severely degraded due to diverse causes: soil erosion (consequence of soil/soil-cover mismanage-ment), increasing urban populations and related water pollution problems, among others (Casatti et al., 2006; IPT, 2000).
USLE application
The soil loss expectation data were surveyed using the Universal Soil Loss Equation (Wischmeier & Smith, 1978): A = R . K . L . S . C . P; where: A is
the rate of soil loss (t ha-1 y-1), R is a factor for
an-nual rainfall erosivity (MJ mm ha-1 h-1 y-1), K is a
fac-tor for soil erodibility (t ha h ha-1 MJ-1 mm-1), L, S, C
and P are dimensionless factors for slope length, slope steepness, cover management, and supporting prac-tices, respectively. The information concerning to the six parameters of the USLE were computed using GIS technology (Idrisi 3.2 (Eastman, 2001)), as ex-plained below.
R factor – this layer was elaborated using the
database and the digital map of the rainfall erosivity, extracted from the database elaborated and cited by
Silva (2004). K factor – this one was generated by
us-ing the São Paulo State pedological map (1:500,000) and assigned values according to soil class as studied
by Silva & Alvares (2005). LS factor - a 30-meter
resolution Digital Elevation Model (DEM) of the study area was used. By using the DEM and the USLE-2D freeware (Desmet & Govers, 1996), the LS factor was generated, where the value of each cell corresponds
to the LS factor. C and P factor - were generated (C
and P jointly) using a digital land cover map, originally divided into ten land cover categories. This map was elaborated using a Landsat 5 (TM) image dated from July – 1996 and the supervised classification method (Lillesand & Kiefer, 2000). The C and P values were assigned according to the land cover category obtained from Bertoni & Lombardi Neto (1990); Mitchell & Bubenzer (1980) and Silva (1999).
Once all existing information about each USLE factors and their respective layers was gathered, the soil loss expectation was calculated by the multiplica-tion of the layers (Silva et al., 2003). The results were reclassified into five interpretation classes (Silva et al., 2003).
Riparian buffer zone determination
Following Narumalani et al. (1997), the map containing the buffer zone of the river network of the study area was elaborated using the land cover and digital river network map. Subsequently, the dimension of the buffer zone (30 meters) was decided accord-ing to the values determined by the Brazilian Forest Code (Brasil, 1965). Hence, the buffer zones were ex-tracted using the river network, and the “Buffer” rou-tine of the Idrisi 3.2 software (Eastman, 2001). The maps containing the buffer zones and the land cover were overlayed (“Overlay” routine of the Idrisi, with the multiplication option), to generate a new map con-taining the land cover for the buffer zones only. Fi-nally, the areas of each land cover class were calcu-lated (“Area” routine of the Idrisi).
Water and habitat quality analyses
The water quality was determined for twenty two randomly chosen sampling points (Figure 2), six-teen located in first-order rivers, classified in accor-dance to the Strahler system of hydrographic hierar-chy (Strahler, 1957), three points in second-order riv-ers and three in third-order rivriv-ers. To minimize the in-fluence of the seasonal variability, field work was car-ried out during the beginning of the dry season (March to June, 2003). A 75 m stretch was chosen at each side of the stream with the aim of including all avail-able macro-habitats (Casatti et al., 2006).
Water quality assessment included the devel-opment of physical and chemical water indexes (PCWI) and the physical habitat index (HI). For the composition of the PCWI at each sampling point the parameters dissolved oxygen, conductivity, pH,
turbid-ity (all measured “in situ” through digital meter Horiba
,
model U-10), orthophosphate, nitrate, and ammonia (all analyzed in a specialized laboratory) were measured. In addition, water odors were recorded and water sur-face oils were also visually documented as indicators of possible human disturbance of a stream reach (Barbour et al., 1999). All parameters were compared against conditions observed in the totally protected water courses in the Morro do Diabo State Park (Silva, 2005), where the Atlantic Forest covers the entire wa-tersheds. A metric raw score was developed based on the deviation from the reference condition and the av-erage final score for each site was separated into four categories (good, fair, poor, and very poor). The com-plete procedures of sampling can be found in Casatti et al. (2006).
Following Roth et al. (1996), nine metrics were used to compose the Habitat Index (HI), which are: substrate stability, velocity and depth variability, flow stability, bottom deposition, combinations of pool-riffle-run, channel alteration, streamside cover, bank vegetative stability, and bank stability. Complete and detailed explanation of the PCWI and HI is available in Casatti et al. (2006).
All the sampling points were geo-referenced and plotted over the Digital Elevation Model of the study area using the Idrisi program. The respective catchment areas of each sampling point were on-screen and manually digitalized. The layer of drainage area of each of the sampling point was intersected with the SLE, land-cover and buffer maps. Using these maps, the catchment area, the percentage of occurrence of each class of the SLE map, of each land cover cat-egory (total catchment area) and of the predominant land cover category - specifically for the 30 m
ian zone (including the percentage of remnant riparian vegetation that occurs along the 30m buffer strip) -were calculated.
RESULTS AND DISCUSSION
USLE application
Annual erosivity of the studied area increased from east to west along the basin, ranging from
5,842 to 6,742 MJ mm ha-1 h-1 yr-1, being considered
of “medium-high” erosivity. The soil map and erod-ibility values for the region show that the soils of the river basin are highly erodible in approximately 94% of the area. The soil class “Acrisol” occurs over 93.1% of the whole area and this class has the great-est erodibility, classified as “very high erodibility” mainly due the abrupt textural change and the high sand percentage (Oliveira et al., 1999; Silva & Alvares, 2005).
The LS factor map was reclassified into six classes, according to LS values: “<1” (occurring in 21.4% of the study area), “=1” (0%). The classes “3”, “4”, “5”, and “6”, wich correspond, respectively, to intervals of “1.1-10.0”, “10.1-50.0”, “50.1-100.0” and “>100.1”, occurred in 0.4%, 30.2%, 35.3% and 12.6%, respectively. The LS factor closely reflected the overall topographic pattern of the region (predomi-nance of flat to slowly undulating relief).
The land cover map of the basin (Figure 3) in-dicates pasture as the predominant land-cover class, occurring in 78.1%. For this land-cover class the val-ues 0.1607 and 0.7000 were attributed to C and P USLE factors, respectively. The remnant vegetation class occurs in 6.9% of the study area and the C and P values most appropriate for this class are 0.0024 and 1.000, respectively, (Bertoni & Lombardi Neto, 1990; Mitchell & Bubenzer, 1980; Silva, 1999).
The category “urban places” occurs in 0.6% of the river basin. The C factor was 0.1242 (Silva, 1999). Normally the value P = 1 is attributed to this land cover category (Silva et al., 2003). In some cases, however, there are some activities developed within the urban area that can reduce erosion and land degrada-tion. Consequently, considering this possibility, the P value adopted for “urban places” was 0.95. Refores-tation is a land-cover category occurring in a very small percentage within the study area (0.02%). The C value was 0.0470 and the P value was 1.000. The attribution of P = 1 is because in Brazil usually no soil conservation practices are used in reforestation activi-ties (Kronka et al., 2002). Thus, the combined C.P value is 0.047.
The class “perennial cultures” occurs in 3.2% of the area, and is composed mainly of orange or-chards and rubber tree plantations, although a few coffee plantations also occur. The values attributed were: C = 0.2190 and P = 0.40 (combined C.P = 0.088). The class “annual crops” occurs in 0.20% of the study area and is represented by the corn and soybean fields. For this class the C and P values were, respectively, 0.1720 and 0.5000 (C.P = 0.086) (Bertoni & Lombardi Neto, 1990; Mitchell & Bubenzer, 1980; Silva, 1999).
"Sugar cane" and "bare soil", two closely re-lated land covers, occur in 2.1% and 6.9%, respec-tively, of the SJD river basin. For sugar cane the at-tributed C and P values were, respectively, 0.1743 and 0.7000, while for bare soil the attributed values were, respectively, 1.000 (soil totally uncovered) and 0.70 (Mitchell & Bubenzer, 1980). The combined C and P values were 0.122 and 0.700, respectively, for sugar cane and bare soil. The class "water bodies" occurs in 1.82% of the area and has negligible significance
for soil loss, while the class “others” - that occurs in 0.2%, was attributed by convention, the values 0.14 and 1.00, for C and P factors, respectively (Silva et al., 2003).
The result of the combination of the USLE fac-tors revealed that there is a predominance of the class that indicates “very high” soil loss expectation (that
means a soil loss expectation higher than 200 t ha-1
year-1). This class occurs in 73.4% of the area. The
class “null” (0 - 10 t ha-1 year-1) is the second
pre-dominant class and occurs in 15.3%, followed by class
“medium” (15 – 50 t ha-1 year-1) with 7.3%, “medium
to high” (50 - 120 t ha-1 year-1) with 2.9%, “high” (120
- 200 t ha-1 year-1) with 0.8% and “moderate” (10
-15 t ha-1 year-1) with 0.3%. Through the routine
“re-gress” of the Idrisi, it was possible to verify that the USLE factor that presented the closest relation with
SLE was the CP (r2 = 0.491).
Water and habitat quality analyzes
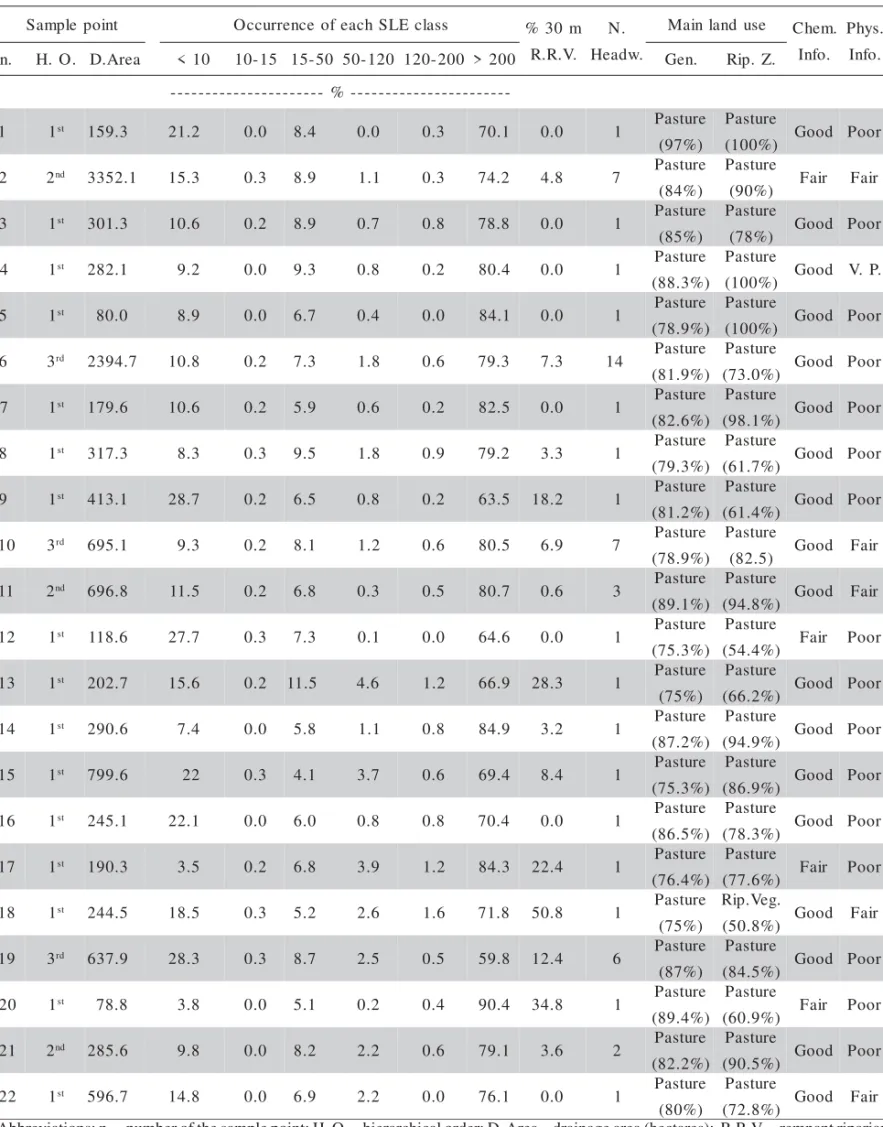
Table 1 summarizes the percentage occurrence of each soil loss expectation, the percentage of rem-nant riparian vegetation for a 30m buffer strip, the num-ber of headwaters, the main land-use in the catchments and in the respective 30m buffer strip, and the classifi-cation of physical, chemical and habitat quality indexes. As occurred in the whole river basin, pasture was the predominant land cover class for the 22 in-vestigated catchments, with occurrences higher than 75%. Similarly, pasture was the main land cover class that occurred for the 30m buffer for most catchments, the only exception being catchment number eighteen, where for the buffer zone the predominant land cover class was remnant natural vegetation.
The results of physico-chemical and habitat quality analyses indicate that the streams are only slightly affected chemically, because eighteen catchments pre-sented a physico-chemical condition classified as “good” and four classified as “fair”. On the other hand, the habi-tat characteristics are strongly affected, because one catchment had a physical quality classified as “very poor”, sixteen were considered “poor”, five “fair” and not a single one was considered as “good”. The per-centage of riparian remnant forest along the 30m buffer strip varied from 0 to 50.8% and eight of them did not present any riparian vegetation cover.
The soil loss expectation class “> 200 t ha-1 y-1”
presented predominant occurrence in all twenty-two catchments, the occurrence varying from 59.8 to 90.4%. The hierarchical order of the stream did not impede the degradation of the habitat quality and the level of degradation can be ratified by the soil expec-tation loss, which for all watersheds was predomi-nantly “> 200”.
Regarding the erosive process, the western re-gion of the state presents elevated susceptibility to ero-sion because of the high erodibility of both the soil and the geological basement (IPT, 1997), which results in sandy and highly detachable soils. Other river basins located in such regions (Aguapeí, Peixe, for instance) also present high susceptibility to erosion for the same reason (IPT, 1997).
The resulting database obtained in this study concerning soil loss expectation is in agreement with the erosion map published by IPT (1997) for the en-tire São Paulo State, based on geological, pedological and geomorphological maps. The high occurrence of areas showing high expectation of soil loss was also verified by Cerri et al. (2001) for Piracicaba River Ba-sin and, according to these authors, the main driving forces were the kind of land cover and the absence of adequate soil tillage practices.
Because the studied region may be highly sus-ceptible to erosive processes, the use of conservation practices is crucial, but the scenario is completely dif-ferent. Through field trips it was verified that the use of soil conservation practices is rare, relatively recent, and in some regions the cattle density is high, leading to overgrazing. Pasture, the main land-cover class re-ported in this study, is a long term and significant part of SJD land use and is a critical component of rural landscape in São Paulo State. The main function of pasture is as a primary support system for livestock. It can affect conservation and environmental planning in several ways, including soil carbon storage, soil quality, and water quality. Depending on the way live-stock and pasture are managed, the effect of livelive-stock on such parameters is highly significant (Al-Kaisi & Hanna, 2004).
The class “urban settlement” did not occur in any of the 22 catchments. This is, probably, the pri-mary and main reason that explains the good chemi-cal quality of the water observed for almost all catchments. Sliva & Williams (2001) mention urban-ization as the main factor that influences the chemical quality of streams in Ontario (Canada), a result also supported by Daniel et al. (2002) for the Piracicaba River Basin (Brazil).
Table 1 - Relationships among the physical and chemical characteristics of the water; percentage of 30-m riparian vegetation and soil loss expectation for five sub-watersheds of the SJD river basin.
Abbreviations: n. – number of the sample point; H. O. – hierarchical order; D. Area – drainage area (hectares); R.R.V. – remnant riparian vegetation; N. Headw. – number of headwaters; Gen – all drainage area. Rip. Z. – 30 m riparian zone; Chem. Info / Phys. Info – chemical and physical information, respectively, V.P. – very poor.
t n i o p e l p m a
S Occurrence ofeachSLEclass % 30m
. V . R . R . N . w d a e H e s u d n a l n i a
M Chem.
. o f n I . s y h P . o f n I .
n H. O. D.Area <10 10-15 15-50 50-120 120-200 >200 Gen. Rip. Z.
-%
-1 1st 159.3 21.2 0.0 8.4 0.0 0.3 70.1 0.0 1 Pasture ) % 7 9 ( e r u t s a P ) % 0 0 1
( Good Poor
2 2nd 3352.1 15.3 0.3 8.9 1.1 0.3 74.2 4.8 7 Pasture ) % 4 8 ( e r u t s a P ) % 0 9
( Fair Fair
3 1st 301.3 10.6 0.2 8.9 0.7 0.8 78.8 0.0 1 Pasture ) % 5 8 ( e r u t s a P ) % 8 7
( Good Poor
4 1st 282.1 9.2 0.0 9.3 0.8 0.2 80.4 0.0 1 Pasture ) % 3 . 8 8 ( e r u t s a P ) % 0 0 1
( Good V.P.
5 1st 80.0 8.9 0.0 6.7 0.4 0.0 84.1 0.0 1 Pasture ) % 9 . 8 7 ( e r u t s a P ) % 0 0 1
( Good Poor
6 3rd 2394.7 10.8 0.2 7.3 1.8 0.6 79.3 7.3 14 Pasture ) % 9 . 1 8 ( e r u t s a P ) % 0 . 3 7
( Good Poor
7 1st 179.6 10.6 0.2 5.9 0.6 0.2 82.5 0.0 1 Pasture ) % 6 . 2 8 ( e r u t s a P ) % 1 . 8 9
( Good Poor
8 1st 317.3 8.3 0.3 9.5 1.8 0.9 79.2 3.3 1 Pasture ) % 3 . 9 7 ( e r u t s a P ) % 7 . 1 6
( Good Poor
9 1st 413.1 28.7 0.2 6.5 0.8 0.2 63.5 18.2 1 Pasture ) % 2 . 1 8 ( e r u t s a P ) % 4 . 1 6
( Good Poor
0
1 3rd 695.1 9.3 0.2 8.1 1.2 0.6 80.5 6.9 7 Pasture ) % 9 . 8 7 ( e r u t s a P ) 5 . 2 8
( Good Fair
1
1 2nd 696.8 11.5 0.2 6.8 0.3 0.5 80.7 0.6 3 Pasture ) % 1 . 9 8 ( e r u t s a P ) % 8 . 4 9
( Good Fair
2
1 1st 118.6 27.7 0.3 7.3 0.1 0.0 64.6 0.0 1 Pasture ) % 3 . 5 7 ( e r u t s a P ) % 4 . 4 5
( Fair Poor
3
1 1st 202.7 15.6 0.2 11.5 4.6 1.2 66.9 28.3 1 Pasture ) % 5 7 ( e r u t s a P ) % 2 . 6 6
( Good Poor
4
1 1st 290.6 7.4 0.0 5.8 1.1 0.8 84.9 3.2 1 Pasture ) % 2 . 7 8 ( e r u t s a P ) % 9 . 4 9
( Good Poor
5
1 1st 799.6 22 0.3 4.1 3.7 0.6 69.4 8.4 1 Pasture ) % 3 . 5 7 ( e r u t s a P ) % 9 . 6 8
( Good Poor
6
1 1st 245.1 22.1 0.0 6.0 0.8 0.8 70.4 0.0 1 Pasture ) % 5 . 6 8 ( e r u t s a P ) % 3 . 8 7
( Good Poor
7
1 1st 190.3 3.5 0.2 6.8 3.9 1.2 84.3 22.4 1 Pasture ) % 4 . 6 7 ( e r u t s a P ) % 6 . 7 7
( Fair Poor
8
1 1st 244.5 18.5 0.3 5.2 2.6 1.6 71.8 50.8 1 Pasture ) % 5 7 ( . g e V . p i R ) % 8 . 0 5
( Good Fair
9
1 3rd 637.9 28.3 0.3 8.7 2.5 0.5 59.8 12.4 6 Pasture ) % 7 8 ( e r u t s a P ) % 5 . 4 8
( Good Poor
0
2 1st 78.8 3.8 0.0 5.1 0.2 0.4 90.4 34.8 1 Pasture ) % 4 . 9 8 ( e r u t s a P ) % 9 . 0 6
( Fair Poor
1
2 2nd 285.6 9.8 0.0 8.2 2.2 0.6 79.1 3.6 2 Pasture ) % 2 . 2 8 ( e r u t s a P ) % 5 . 0 9
( Good Poor
2
2 1st 596.7 14.8 0.0 6.9 2.2 0.0 76.1 0.0 1 Pasture ) % 0 8 ( e r u t s a P ) % 8 . 2 7
The third possible reason is that the farmers do not use fertilizers in pasture management (the main
species used for pasture seems to be Brachiaria
decumbens Stapf). Thus, when runoff occurs, there
is no fertilizer to be transported. On the other hand, as this species is tolerant to soils of low fertility and is highly adapted to Brazilian climatic conditions, it is widely used (Mattos, 2001). As cattle are normally mismanaged and the pasture is typically overgrazed, the soil surface becomes poorly covered and highly susceptible to erosion (Sparovek, 1996).
The association of livestock with pasture man-agement, and the need for livestock to have access to water, also intensifies the problems associated to soil stability and water quality (Al-Kaisi & Hanna, 2004). The deterioration of pasture cover due to intensive grazing can be a very significant source of pollution from both sediment and animal waste. To improve the water quality of the SJD river basin, the producers that work with livestock in pasture should find ways to keep animals out of streams and find alternative wa-ter sources. Rotational grazing might be a good op-tion for managing the quantity and quality of vegeta-tion so as to improve water quality, since this kind of management system allows soil and vegetation time to recover from grazing and restore good soil conditions (Al-Kaisi & Hanna, 2004).
The majority of the stream reaches (77.2%) present poor or very poor physical habitat conditions for supporting aquatic wildlife communities (especially fishes, according to Casatti et al., 2006). Such authors observed, through field visits, that many small first-or-der streams listed in the official hydrographic map of the SJD river basin (which is from the 1970s) do not exist anymore, being dry and completely silted. This current and hazardous situation of high level degrada-tion of the water (physical parameters) of the in-stream habitat of the SJD river basin is partially due to the high level of degradation of the riparian vegetation existing in the catchments (Sliva & Williams, 2001; Allan, 2004). The study area is in a worse condition than that showed in IPT (1997 and 2000). Therefore, it is sug-gested that extremely urgent and planned actions are adapted, perhaps beginning the restoring actions of the catchments with 0% riparian vegetation (Table 1). These areas should be the first to receive action and resources owing to the present expectation of soil loss. The divulgation of these data to city managers and re-gional populations is also extremely important and ur-gent to show the seriousness of the situation, to stimu-late the perception of the need for environmental con-servation / repair, and also to facilitate a joint and co-hesive action to improve the environmental quality of the São José dos Dourados River Basin.
CONCLUSIONS
The predominant land cover (pasture) and soil mismanagement have intensified erosion within the study area. The results revealed the high level of environmental degradation that the SJD river ba-sin is suffering, with 77.2% of the catchments hav-ing water of poor or very poor physical character-istics for the sustenance of aquatic wildlife. Actions for the restoration of the riparian vegetation (or, at least, a part of it) are extremely important and ur-gent to conserve and recuperate water resources and wildlife (terrestrial and aquatic) of this river ba-sin.
ACKNOWLEDGEMENTS
To Fundação de Amparo à Pesquisa do Estado de São Paulo (FAPESP) and Fundunesp, for financial support and scholarships.
REFERENCES
AL-KAISI, M.; HANNA, M. Integrated crop management. The role of pasture in conservation management. Ames: Iowa State University, 2004. Available at: http://www.ipm.iastate.edu/ipm/ icm/2004/8-16-2004/pasture.html.
ALLAN, J.D. Landscapes and Riverscapes: the influence of land use on stream ecosystems. Annual Review of Ecology, Evolution and Systematics, v.35, p.257-284, 2004. ALVARES, C.A.; SILVA, A.M. Cenários de uso da terra e a
expectativa de perda de solo para a Microbacia Hidrográfica do Ribeirão da Onça (Brotas / SP). Revista de Estudos Ambientais, v.7, p.77-90, 2005.
BARBOUR, M.T.; GERRITSEN, J.; SNYDER, B.D.; STRIBLING, J.B. Rapid bioassessment protocols for use in streams and wadeable rivers: periphyton, benthic macroinvertebrates and fish. 2.ed. Washington, DC: Environmental Protection Agency, 1999. 339p.
BARRELLA, W.; PETRERE, M. Fish community alterations due to pollution and damming in Tietê and Paranapanema Rivers – Brazil. River Research and Applications, v.19, p.59-76, 2003.
BERTONI, J.; LOMBARDI NETO, F. Conservação do solo. São Paulo: Ícone, 1990. 335p.
BRASIL. Conselho Florestal Federal. Código florestal brasileiro. Brasília, 1965. Available at: www.ipef.br/legislacao.
CASATTI, L.; LANGEANI, F.; SILVA, A.M.; CASTRO, R.M.C. Stream fishes and environmental variables in a pasture dominated landscape, southeastern Brazil. Brazilian Journal of Biology, v.66, p.681-696, 2006.
COORDENADORIA DE ASSISTÊNCIA TÉCNICA INTEGRAL -CATI. Mapas agrícolas. Campinas: CATI. Available online: www.cati.sp.gov.br. 2006.
CERRI, C.E.P.; DEMATTE, J.A.M.; BALLESTER, M.V.R.; MARTINELLI, L.A.; VICTORIA, R.L.; ROOSE, E. GIS erosion risk assessment of the Piracicaba river basin, Southeast Brazil.
Mapping Sciences and Remote Sensing, v.38, p.157-171, 2001.
DANIEL, M.H.B.; MONTEBELO, A.A.; BERNARDES, M.C.; OMETTO, J.P.H.B.; CAMARGO P.B.; KRUSCHE, A.V.; BALLESTER, M.V.; VICTÓRIA, R.L.; MARTINELLI, L.A. Effects on urban sewage on dissolved oxygen, dissolved inorganic and organic carbon, and electrical conductivity on small streams along a gradient of urbanization in the Piracicaba river basin.
Water, Air, and Soil Pollution, v.136, p.189-206, 2002. DESMET, P.J.J.; GOVERS, G.A GIS procedure for automatically
calculating LS factor on topographically complex landscape units. Journal of Soil and Water Conservation, v.51, p.427-433, 1996.
EASTMAN, J.R. Idrisi 3.2 – Release 2: Tutorial. Worcester, Massachusetts: Clark University, 2001.
FISCHER, R.A.; CHESTER, O.M.; FISCHENICH, J.C. Improving riparian buffer strips and corridors for water quality and wildlife. In: INTERNATIONAL CONFERENCE ON RIPARIAN ECOLOGY AND MANAGEMENT IN MULTI-LAND USE WATERSHEDS, Portland, 2000. Middleburg: AWRA, 2000. 7p. Available at: http://www.swf.usace.army.mil/pubdata/environ/ regulatory/other/links/stream/improvingriparianbufferstrips.pdf. INSTITUTO DE PESQUISAS TECNOLÓGICAS DO ESTADO DE SÃO PAULO - IPT. Mapa de erosão do Estado de São Paulo. São Paulo, 1997. Scale: 1:3,000,000.
INSTITUTO DE PESQUISAS TECNOLÓGICAS DO ESTADO DE SÃO PAULO - IPT. Diagnóstico da situação atual dos recursos hídricos e estabelecimento de diretrizes técnicas para a elaboração do Plano da Bacia Hidrográfica do São José dos Dourados. São Paulo: Comitê da Bacia Hidrográfica do São José dos Dourados; Fundo Estadual de Recursos Hídricos, 2000.
JOBIN, B.; BELANGER, L.; BOUTIN, C.; MAISONNEUVE, C. Conservation value of agricultural riparian strips in the Boyer River watershed, Québec (Canada). Agriculture, Ecosystems & Environment, v.103, p.413-423, 2004.
KRONKA, F.J.N.; NALON, M.A.; MATSUKUMA, C.K.; PAVÃO, M.; KANASHIRO, M.M.; YWANE, M.S.S.; LIMA, L.M.P.R.; GUILLAUMON, J.R.; BAITELLO, J.B.; MONTEIRO, C.H.B.
Inventário florestal das áreas reflorestadas do Estado de São Paulo. São Paulo: Secretaria do Meio Ambiente; Instituto Florestal, 2002. 183p.
LILLESAND, T.M.; KIEFER, R.W. Remote sensing and image interpretation. 4.ed. New York: John Willey & Sons, 2000. 724p.
LUFAFA, A.; TENYWA, M.M.; ISABIRYE, M.; MAJALIWA, M.J.G.; WOOMER, P.L. Prediction of soil erosion in a Lake Victoria basin catchment using a GIS-based Universal Soil Loss model. Agricultural Systems, v.76, p.883-894, 2003. MATTOS, W.T. Avaliação de pastagem de capim-braquária em
degradação e sua recuperação com suprimento de nitrogênio e enxofre. Piracicaba: USP/ESALQ, 2001. 97p. (Tese -Doutorado).
MITCHELL, J.K.; BUBENZER, G.D. Soil loss estimation. In: KIRKBY, M.J.; MORGAN, R.P.C. (Ed.). Soil erosion. Chichester: John Wiley & Sons, 1980. p.17-62.
NAIMAN, R.J.; DÉCAMPS, H. The ecology of interfaces: Riparian Zones. Annual Review of Ecology and Systematics, v.28, p.621-658, 1997.
NARUMALANI, S.; YINGCHUN, Z.; JENSEN, J.R. Application of remote sensing and geographic information systems to the delineation and analysis of riparian buffer zones. Aquatic Botany, v.58, p.393-409, 1997.
NIMER, E. Climatologia do Brasil. Rio de Janeiro: Secretaria de Planejamento e Coordenação da Presidência da República; IBGE, 1989. 421p.
OLIVEIRA, J.B.; CAMARGO, M.N.; ROSSI, M.; CALDERANO FILHO, B. Mapa pedológico do Estado de São Paulo. Legenda expandida. Campinas: Instituto Agronômico, 1999. 112p. (Boletim Científico, 45).
ROTH, N.E.; ALLAN, J.D.; ERICKSON, D.L. Landscape influences on stream biotic integrity assessed at multiple spatial scales.
Landscape Ecology, v.11, p.141-156, 1996.
SILVA, A.M. Aplicações de técnicas de geoprocessamento no estudo das relações entre os processos erosivos e sedimentológicos de bacia hidrográfica. São Carlos: EESC/USP, 1999. 249p. (Tese -Doutorado).
SILVA, A.M. Rainfall erosivity map for Brazil. Catena, v.57, p.251-259, 2004.
SILVA, A.M.; ALVARES, C.A. Erodibilidade dos solos paulistas: levantamento de informações e estruturação de um banco de dados. Geociências, v.24, p.33-42, 2005.
SILVA, A.M.; SCHULZ, H.E.; CAMARGO, P.B. Erosão e hidrossedimentologia em bacias hidrográficas. São Carlos: Editora Rima, 2003. 110p.
SILVA, D.M.L. Dinâmica de nitrogênio em microbacias no Estado de São Paulo. Piracicaba: ESALQ/USP, 2005. 106p. (Tese de Doutorado).
SLIVA, L.; WILLIAMS, D.D. Buffer zone versus whole catchment approaches to studying land use impact on river water quality.
Water Research, v.35, p.3462-3472, 2001.
SPAROVEK, G. Erosão do solo e a produtividade das culturas. In: SOIL SCIENCE LATIN-AMERICAN CONGRESS, 13., Águas de Lindóia, 1996. Abstracts. Campinas: Software Gráfico, 1996. STRAHLER, A.N. Quantitative analysis of watershed geomorphology. Transaction of American Geophysical Union, v.38, p.913-920, 1957.
WISCHMEIER, W.H.; SMITH, D.D. Predicting rainfall erosion losses: a guide to conservation planning. Washington: USDA Science and Education, 1978. 58p.