Vol. 51, n. 5 : pp.873-882, September-October 2008
ISSN 1516-8913 Printed in Brazil BRAZILIAN ARCHIVES OF BIOLOGY AND TECHNOLOGY
A N I N T E R N A T I O N A L J O U R N A L
Assessing the Genetic Structure of
Oryza glumaepatula
Populations with Isozyme Markers
Elizabeth Ann Veasey1*, Daruska Cardin1, Rainério Meireles Silva2, Eduardo de Andrade Bressan1 and Roland Vencovsky1
1
Departamento de Genética; Escola Superior de Agricultura "Luiz de Queiroz"; Universidade de São Paulo; C.P.: 83; 13400-970; [email protected]; Piracicaba - SP - Brasil. 2Universidade Federal do Pará; Campus de Altamira; Altamira - PA - Brasil
ABSTRACT
To assess the genetic diversity and genetic structure parameters, nine populations of Oryza glumaepatula from the Amazon biome, four from the Pantanal biome, and one collected at Rio Xingu, Mato Grosso, totaling 14 populations and 333 individuals were studied with isozyme markers. Six loci were evaluated showing a moderate allozyme
variability (A = 1.21, P = 20.7%, H o = 0.005, H e = 0.060). The populations from the Pantanal biome showed higher diversity levels than the Amazon biome. High genetic differentiation among the populations, expected for self-fertilizing species, was observed (FST=0.763), with lower differentiation found among the Pantanal populations
(FST=0.501). The average apparent outcrossing rate was higher for the Pantanal populations (tˆa = 0.092) than for the Amazonian populations (tˆa = 0.003), while the average for the 14 populations was 0.047, in accordance with a self-fertilization mating system.
Key words: Genetic diversity, isozymes, Oryza glumaepatula, outcrossing rate, populations
*
Author for correspondence
INTRODUCTION
Among the 22 wild species of the genus Oryza (IRRI, 2005), O. glumaepatula Steud. is one of the four wild rice species originated in the American continent (Morishima, 1994). It occurs in Bolivia, Brazil, Colombia, Costa Rica, Cuba, Dominican Republic, French Guyana, Guyana, Honduras, Mexico, Panama, Surinam and Venezuela, and is found in swamps and marshes, open ditches and pools, beside rivers, and near to the cultivated rice fields, usually with deep water, also growing in open habitats (IRRI, 2005). It is the only diploid species and compatible with O. sativa, which makes it important as a source of new genes to be
incorporated to the cultivated species in plant breeding programs (Brondani et al., 2002; Mamani, 2002).
et al. (1999) confirmed the taxonomic classification of O. glumaepatula as a distinct species and not as an American form of O. rufipogon.
Isozymic markers have been widely used in the cultivated and wild Oryza species, thus elucidating the processes of the domestication of the cultivated rice, assessing the genetic diversity and genetic structure of populations associated with aspects of their life history (Second, 1982; Barbier, 1989; Grover and Pental, 1992; Suh et al., 1997; Akimoto et al., 1998; Buso et al., 1998; Gao et al., 2000a; Gao et al., 2000b; Gao et al., 2000c; Gao et al., 2002a; Gao et al., 2002b; Quesada et al., 2002; Ishikawa et al., 2005). Buso et al. (1998) observed in four populations of O. glumaepatula collected at the basins of Rio Amazonas and Rio Paraguay, based on isozymes and RAPD, a pattern of greater variation among rather than within populations, suggesting a self-fertilization breeding system. Akimoto et al. (1998), evaluating 37 populations of O. glumaepatula collected in five regions of Amazonian Rio Negro and Rio Solimões, observed high values for FIS, indicating
inbreeding, and low values for the observed heterozygosity, indicating excess of homozygotes, suggesting that this species was predominantly self-pollinated. However, the authors observed greater intrapopulational than interpopulational variability, a pattern usually found in the cross-fertilized populations, which was explained considering the life history characteristics of this species. Studies of the genetic structure of O. glumaepatula populations were also recently conducted with microsatellite markers (Karasawa, 2005; Karasawa et al., 2007; Brondani et al., 2005; Silva et al., 2007), showing high values for FST and
RST, suggesting a higher interpopulational
variability, as well as the predominance of a self-fertilizing breeding system.
The purpose of this study, using isozymic markers, was to provide further information on the genetic diversity and genetic structure of 14 O. glumaepatula populations, originated from the hydrographic basins of the Amazon and of Rio Paraguay in the Pantanal ecosystem.
MATERIALS AND METHODS
Plant material and sampling procedures
Fourteen Brazilian O. glumaepatula populations from the wild rice germplasm bank of Escola
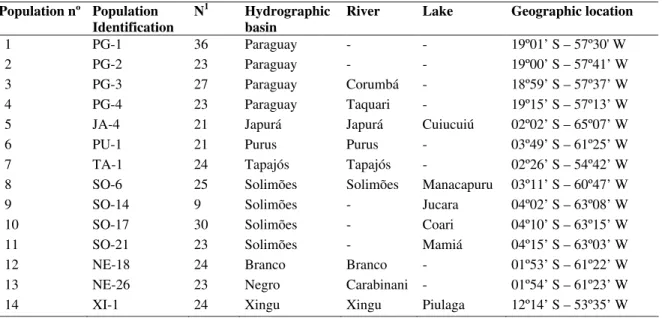
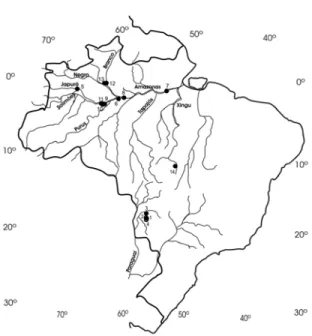
Superior de Agricultura “Luiz de Queiroz”, Universidade de São Paulo, were assessed in this study. Four populations were originated from the Pantanal biome, at the hydrographic basin of Rio Paraguay, nine from the hydrographic basins of Rio Japura, Purus, Tapajos, Solimões, Branco, Negro in the Amazon region, and one from Rio Xingu, also a tributary to the Amazon, in the State of Mato Grosso (Table 1, Fig. 1).
Two to three seeds were randomly sampled from each individual plant within each population to form a bulk of 50 seeds. After the germination in plastic gerboxes on filter paper at 27oC in the dark in germination chambers, the seedlings were planted in pots in the greenhouse. According to the germination potential, the number of plants evaluated from each population varied from nine to 36, a total of 333 individuals.
Isozyme analyses procedures
A protocol was established for the isozyme analyses in polyacrilamide gels under a discontinuous system. The gel and electrode buffers which showed the best results were the basic buffer (Hames, 1996), with pH 8.8 for the 5.5% resolving gel and pH 6.8 for the 3.5% stacking gel.
Recently expanded leaves (200 mg) were used for the enzyme extraction. The leaves were ground in liquid nitrogen in 1.5 mL microtubes using a power homogenizer, adding 1 mL of number 1 extraction buffer (Alfenas et al., 1991), leaving out diethyldithiocarbamic acid (DIECA) and 2- mercaptoethanol. The resulting crude extract was centrifuged at 18000 g for 20 min at 4ºC. After that, 130 µL of the supernatant were placed in 0.5
mL microtubes, diluted in 150 µL of a solution containing Tris-HCl pH 6.8 and Coomassie blue, the latter component indicating the protein migration in the gel. This amount of extract was sufficient for four gels, which allowed the assessment of 38 individuals each. The same control plant was added at each gel as a marker. The voltage was set at 50 V during three hours, adjusted for 100 V for the next 13 hours, usually staying overnight at 4ºC.
1.1.1.25), glutamate dehydrogenase (GDH; E.C. 1.4.1.2) and malate dehydrogenase (MDH; E.C. 1.1.1.37). The MDH and GPI systems were further discarded due to difficulty in interpretation. The systems leucine aminopeptidase (LAP; E.C. 3.4.1.1.1), glucose-6-phosphote dehydrogenase (G6PDH; E.C. 1.1.1.49), sorbitol dehydrogenase
(SDH; E.C. 1.1.1.14) and superoxide dismutase (SOD; E.C. 1.15.1.1) also showed some activity, but not enough to include them in the analyses.
Statistical analyses
Allelic frequencies, mean number of alleles per locus (A), mean number of alleles per polymorphic locus (Ap), percentage of polymorphic loci (P), observed heterozygosity (Ho), gene diversity (He)
and Wright’s fixation index (f) were estimated using the GDA software (Lewis and Zaykin, 2000). The average apparent outcrossing rate (ta)
was estimated according to the formula tˆa =
) ˆ 1 / ˆ 1
( − f + f , where fˆ was estimated as fˆ = (He-Ho)/He. The genotypic frequencies were
submitted to Fisher’s exact test considering Hardy-Weinberg equilibrium proportions (Weir, 1996), using the TFPGA software (Miller, 1997).
This program was also used for a cluster analysis considering the UPGMA clustering criteria and Nei’s genetic distances matrix (Nei, 1978). F statistics (FIS , FST and FIT) were used for the
genetic structure studies and were estimated using the FSTAT software (Goudet, 2001) under a random model according to Weir (1996), considering the sampled populations as the representatives of the species with a common evolutionary history. Wright’s F statistics are a hierarchical series of fixation indices, where FIS
represents the deviation from Hardy-Weinberg expectations within populations, FST measures the
fixation of different alleles in different populations, and FIT measures deviations from
Hardy-Weinberg expectation across the population system as a whole (Gao et al., 2000b).
Table 1 - Origin of the Oryza glumaepatula populations, according to the number assigned in the data analysis
1
Number of sampled individuals/population.
Population nº Population Identification
N1 Hydrographic
basin
River Lake Geographic location
1 PG-1 36 Paraguay - - 19º01’ S – 57º30' W
2 PG-2 23 Paraguay - - 19º00’ S – 57º41’ W
3 PG-3 27 Paraguay Corumbá - 18º59’ S – 57º37’ W
4 PG-4 23 Paraguay Taquari - 19º15’ S – 57º13’ W
5 JA-4 21 Japurá Japurá Cuiucuiú 02º02’ S – 65º07’ W
6 PU-1 21 Purus Purus - 03º49’ S – 61º25’ W
7 TA-1 24 Tapajós Tapajós - 02º26’ S – 54º42’ W
8 SO-6 25 Solimões Solimões Manacapuru 03º11’ S – 60º47’ W
9 SO-14 9 Solimões - Jucara 04º02’ S – 63º08’ W
10 SO-17 30 Solimões - Coari 04º10’ S – 63º15’ W
11 SO-21 23 Solimões - Mamiá 04º15’ S – 63º03’ W
12 NE-18 24 Branco Branco - 01º53’ S – 61º22’ W
13 NE-26 23 Negro Carabinani - 01º54’ S – 61º23’ W
Figure 1 - Map of Brazil showing the localization of the 14 Oryza glumaepatula populations, described in Table 1.
RESULTS AND DISCUSSION
Genetic diversity
Six loci were evaluated with one locus for each of the enzyme systems PGM, SKD and GDH, and three loci for AAT. Three alleles were found at the locus Pgm-1, two at loci Aat-1, Aat-2 and Skd-1, and one fixed allele at loci Aat-3 and Gdh-1, both monomorphic (Table 2).
For the AAT system, a dimeric enzyme (Weeden and Wendel, 1989), most of the populations originated in the Amazon presented a fixed a2 allele for Aat-1 locus. On the other hand, the four populations originated in the Pantanal biome showed the predominance of allele a1, fixed in three of these populations (Table 2). The XI-1 population from Rio Xingu presented also a fixed a1 allele, similar to the Pantanal populations. For the Aat-2 locus the opposite occurred, with the predominance of allele a1 for the Amazonian populations and the predominance of allele a2 for the populations of the Pantanal biome and Rio Xingu.
At the Skd-1 monomeric locus, most populations presented a fixed a1 allele. The monomeric PGM enzyme (Weeden and Wendel, 1989) presented one locus with three alleles, with allele a2 fixed at
the populations PG-3, JA-4, PU-1 and SO-6 (Table 2).
Thus, considering six loci and four enzymatic systems, the mean number of alleles per locus ranged from 1.00 to 1.50, with a mean of 1.21 alleles per locus (Table 3), in agreement with the previous studies with isozyme (Akimoto et al., 1998; Buso et al., 1998) and microsatellite markers (Brondani et al, 2005) in O. glumaepatula. Karasawa et al. (2007), however, observed a mean of 3.09 alleles per locus with microsatellites for this species. The percentage of polymorphic loci ranged from 0.0 to 50.0%. Population PG-1, from the Pantanal biome, was the most polymorphic (Table 3).
The observed heterozygosity varied from 0.000 to 0.023 (mean of 0.005), and the gene diversity ranged from 0.000 to 0.164 (mean of 0.060). These values were also in agreement with the estimates observed by Akimoto et al. (1998) (Ho =
0.003 and He = 0.044) and Buso et al. (1998) (Ho =
0.000 to 0.025 and He = 0.000 to 0.210) with
isozymes and by Brondani et al. (2005) (Ho =
0.027 and He = 0.115) with microsatellites.
Karasawa et al. (2007), using microsatellites, observed higher values for these parameters (Ho =
0.091 and He = 0.393), which could be due to the
individuals, with a mean of 27.38) used by the author, allowing the detection of a greater number of private alleles in each population. Higher genetic diversity levels were also obtained by Gao et al. (2002a) with microsatellites than with isozyme markers, when comparing the same set of O. rufipogon Griff. populations. Comparing both biomes, the Pantanal and the Amazon, higher diversity indices were observed for the Pantanal populations at all the parameters analysed (Table 3), except the number of alleles per polymorphic locus, which was the same for both biomes. The fixation index estimate provided positive and near to one values, with a mean of 0.910, indicating excess of homozygotes and a self-fertilizing mating system. The apparent outcrossing rate was also higher (tˆa = 0.092) on
average for the Pantanal populations, with PG-4 population presenting the highest outcrossing rate (tˆa = 0.158). Both the estimates indicated a predominantly self-fertilized mixed mating system, although on the average, for the 14 populations, the outcrossing rate was estimated as 0.047, indicating a self-fertilization mating system for this species. These results agreed with Brondani et al. (2005) when comparing the Amazon, Pantanal and Cerrado biomes with microsatellites, also estimating higher diversity indices for the Pantanal populations, although only two Amazonian populations were evaluated against five from the Pantanal biome. Greater
apparent outcrossing rates were also obtained, on average, for the Pantanal populations (tˆa = 0.184)
by these authors. In this study, nine Amazon populations were evaluated, excluding the Rio Xingu population, against four of the Pantanal, and yet the same pattern was observed.
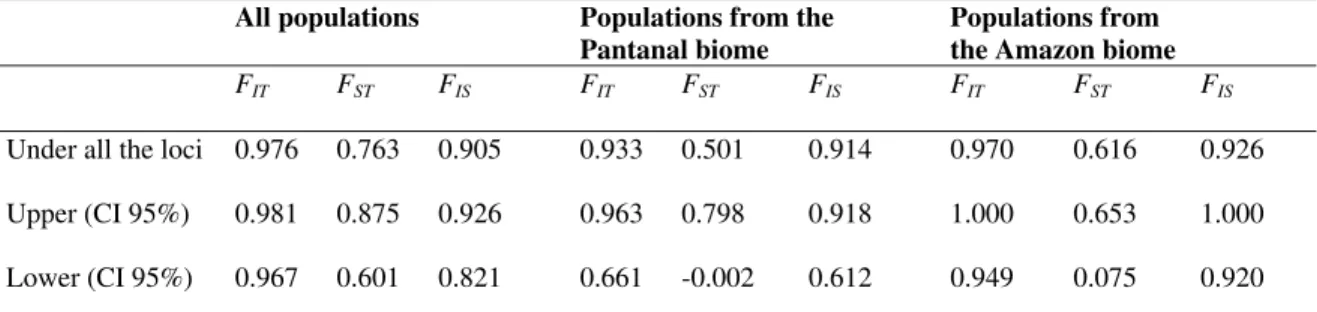
Genetic structure
Wright’s F statistics (Table 4) showed near 1.0 values for FIT (0.976) and FIS (0.905), indicating a
self-fertilization mating system for O. glumaepatula and also high interpopulational variability (FST = 0.77). In agreement with these
results, Buso et al. (1998) observed in four O. glumaepatula populations, based on isozymes and RAPD markers, a pattern of greater variation among than within the populations, suggesting also a self-pollination breeding system. Akimoto et al. (1998), using 29 loci of 16 enzymes in 37 populations collected in five regions of Rio Negro and Rio Solimões in the Amazon, also found high FIS values, indicating high inbreeding. With
microsatellite markers, Karasawa et al. (2007) and Brondani et al. (2005) also found high FIT (0.888
and 0.968) and FIS (0.788 and 0.794) values,
respectively, for O. glumaepatula populations. Karasawa et al. (2007) estimated a lower FST value
(0.491) than the value found in this study and that observed by Brondani et al. (2005) (FST = 0.847).
However, a high interpopulation variability was the main result from all of these studies.
Table 2 - Allele frequencies of six isozymic loci estimated from 333 individuals in 14 Oryza glumaepatula
populations.
Locus Allele PG-1 PG-2 PG-3 PG-4 JA-4 PU-1 TA-1
Aat-1 a1 0.833 1.000 1.000 1.000 0.143 0.000 0.000
a2 0.167 0.000 0.000 0.000 0.857 1.000 1.000
Aat-2 a1 0.318 0.182 - 0.167 0.905 1.000 1.000
a2 0.682 0.818 - 0.833 0.095 0.000 0.000
Aat-3 a1 1.000 1.000 1.000 1.000 1.000 1.000 1.000
Skd-1 a1 1.000 1.000 1.000 - 1.000 1.000 1.000
a2 0.000 0.000 0.000 - 0.000 0.000 0.000
a1 0.848 0.000 0.000 0.022 0.000 0.000 0.229
Pgm-1 a2 0.152 0.978 1.000 0.978 1.000 1.000 0.771
a3 0.000 0.022 0.000 0.000 0.000 0.000 0.000
Gdh-1 a1 1.000 1.000 1.000 1.000 1.000 1.000 1.000
(Cont. Table 2)
SO-6 SO-14 SO-17 SO-21 NE-18 NE-26 XI-1
0.000 0.000 0.000 0.000 0.000 0.000 1.000
1.000 1.000 1.000 1.000 1.000 1.000 0.000
1.000 1.000 1.000 1.000 1.000 1.000 0.000
0.000 0.000 0.000 0.000 0.000 0.000 1.000
1.000 1.000 1.000 1.000 1.000 1.000 1.000
1.000 0.556 0.300 1.000 0.167 1.000 0.000
0.000 0.444 0.700 0.000 0.833 0.000 1.000
0.000 0.111 0.000 0.000 0.521 0.000 0.000
1.000 0.889 0.152 0.978 0.479 0.978 0.500
0.000 0.000 0.000 0.022 0.000 0.000 0.500
1.000 1.000 1.000 1.000 1.000 1.000 1.000
Table 3 - Estimates of genetic diversity parameters based on six loci and 14 O. glumaepatula populations: mean number of individuals sampled/locus (N), mean number of alleles/locus (A), mean number of alleles/polymorphic locus (Ap), mean number of polymorphic loci (P), mean observed heterozygosity/locus (Ho), gene diversity (He), Wright’s fixation index (f) and apparent outcrosing rate (ta).
Pop N A Ap P (%) Ho He f tˆ
a
PG-1 35.0 1.50 2.00 50.0 0.023 0.164 0.858 0.0764
PG-2 21.0 1.33 2.00 16.6 0.007 0.059 0.877 0.0655
PG-3 27.0 1.00 - 0.0 0.000 0.000 0.000 -
PG-4 22.6 1.40 2.00 20.0 0.018 0.065 0.727 0.1581
Pantanal mean 26.4 1.31 2.00 21.6 0.012 0.072 0.832 0.0917
JA-4 19.2 1.33 2.00 33.3 0.000 0.071 1.000 0.0000
PU-1 21.0 1.00 - 0.0 0.000 0.000 0.000 -
TA-1 18.5 1.17 2.00 16.7 0.007 0.060 0.887 0.0599
SO-6 25.0 1.00 - 0.0 0.000 0.000 0.000 -
SO-14 9.0 1.33 2.00 33.3 0.000 0.122 1.000 0.0000
SO-17 30.0 1.17 2.00 16.7 0.000 0.071 1.000 0.0000
SO-21 23.0 1.17 2.00 0.0 0.000 0.014 1.000 0.0000
NE-18 24.0 1.33 2.00 33.3 0.021 0.132 0.845 0.0840
NE-26 23.0 1.00 - 0.0 0.000 0.000 0.000 -
Amazon mean 21.4 1.17 2.00 14.8 0.003 0.052 0.942 0.0298
XI-1 20.8 1.17 2.00 16.7 0.000 0.085 1.000 0.0000
Table 4 - F statistics estimates for all 14 populations for four populations from Pantanal and nine populations from the Amazon.
All populations Populations from the
Pantanal biome
Populations from
the Amazon biome
FIT FST FIS FIT FST FIS FIT FST FIS
Under all the loci 0.976 0.763 0.905 0.933 0.501 0.914 0.970 0.616 0.926
Upper (CI 95%) 0.981 0.875 0.926 0.963 0.798 0.918 1.000 0.653 1.000
Lower (CI 95%) 0.967 0.601 0.821 0.661 -0.002 0.612 0.949 0.075 0.920
FIS - deviation from Hardy-Weinberg expectations within populations; FST - measures the fixation of different alleles in different populations; FIT - deviations from Hardy-Weinberg expectation across the population system as a whole
IC: 95% confidence interval
Comparing the three biomes analysed (Amazon, Pantanal and Cerrado), lower interpopulational variability was found for the Pantanal populations (FST = 0.501) when compared to the
Amazonian populations (FST = 0.616), similar to
what was observed by Brondani et al. (2005) (FST = 0.713 for the Pantanal populations and
FST = 0.831 for the Amazonian populations).
Considering the high interpopulational variability found in this species, it would be important to sample fewer individuals from several populations when the objective is an ex situ conservation program. For in situ conservation programs, a larger area including
the conservation of several populations in both biomes is suggested from this data.
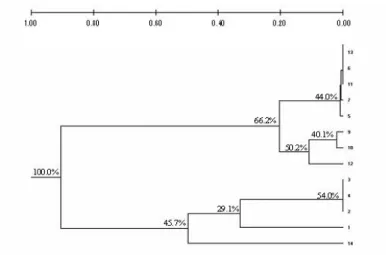
The cluster analysis (Fig. 2), based on Nei’s (1978) genetic distances (Table 5) classified the 14 populations in two major groups, one of them clustering the four Pantanal populations together with the Rio Xingu population, while the other group was formed by the Amazonian populations. This analysis showed a clear separation and genetic divergence between the two biomes (Pantanal and the Amazon), as well as the intermediate position of XI-1 population collected in the State of Mato Grosso, at the fringes of Rio Xingu.
Table 5 - Nei’s (1978) genetic distances between 14 Oryza glumaepatula populations in this study.
1 2 3 4 5 6 7 8 9 10 11 12 13 14 1 0.000
Figure 2 - Dendrogram using Nei’s (1978) genetic distances based on six isozymic loci and the UPGMA method, for the clustering of 14 Oryza glumaepatula populations, as described on Table 1.
At a parallel study (Rosa et al., 2006), eight O. glumaepatula populations assessed with 15 morphological traits showed the separation of the single Pantanal population (PG-4) evaluated on a distinct group, and also the clustering of Rio Xingu (XI-1) population at another single group, in comparison with the other Amazonian populations, except for a Rio Negro (NE-26) population, also clustered in a single group due to the morphological differentiation. Another parallel study on morphological characterization clustered in a separate group the single Pantanal population (PG-1) studied among 11 O. glumaepatula populations, plus 12 populations belonging to the species O. latifolia, O. grandiglumis and O. alta (Veasey et al., 2008). Comparing these studies, it was evident that besides an allelic divergence, there was also morphological diversity among the populations of these regions. As discussed above, for certain loci (Aat-1 and Aat-2) different alleles predominated in each of the two biomes, Pantanal and the Amazon, indicating that a genetic differentiation probably occurred in these populations due to the geographic isolation among O. glumaepatula populations.
Within the group of the Pantanal and Xingu populations, the PG-1 population, the most polymorphic of all, classified in a single group, was the only one to present the a2 allele at Aat-1 locus (Table 2). Besides, it was the only one to present a high frequency of allele a1 at Pgm-1 locus. The XI-1 population, also classified in a
single group, within this major group, differed from all the others for presenting a high frequency of the a3 allele (0.50) at Pgm-1 locus, and from the Pantanal populations for presenting a fixed a2 allele at Skd-1 locus.
Within the Amazonian populations, a separate group was formed with the populations SO-14, SO-17 and NE-18. All three populations showed the a2 allele at locus Skd-1, not shown by the other populations. The Rio Negro (NE-18) population differed from the others for presenting a higher frequency of allele a1 at locus Pgm-1.
ACKNOWLEGEMENTS
The authors wish to thank the Fundação de Amparo à Pesquisa no Estado de São Paulo (FAPESP) and the Conselho Nacional de Desenvolvimento Científico e Tecnológico (CNPq) for the financial support for the development of this research and scholarships.
RESUMO
genética e a estrutura genética dessas populações. Seis locos foram avaliados, mostrando variabilidade alozímica moderada (A= 1.21, P = 20.7%, H o = 0.005, H e = 0.060). As populações
do bioma Pantanal apresentaram níveis de diversidade mais altos que as da Amazônia. Alta diferenciação genética entre populações, esperada para espécies autógamas, foi observada (FST=0.763), com menor diferenciação encontrada
entre populações do Pantanal (FST=0.501). A taxa
média de cruzamento aparente foi maior para as populações do Pantanal (tˆa = 0.092) que da
Amazônia (tˆa = 0.003), enquanto que a taxa media para as 14 populações foi 0.047, em concordância com o sistema reprodutivo por autogamia.
REFERENCES
Ando, A. (1998), Coletas de germoplasma de espécies selvagens e relativas ao gênero Oryza no Brasil, Paraguay e Argentina. Paper presented at 15th Table Encontro Sobre Temas de Genética e Melhoramento, 13-14 October, Piracicaba, São Paulo.
Akimoto, M., Shimamoto, Y. and Morishima, H. (1998), Population genetic structure of wild Oryza glumaepatula distributed in the Amazon flood area influenced by its life-history traits. Mol. Ecol., 7, 1371-1381.
Alfenas, A.C.; Peters, I.; Brune, W. and Passador, G.C. (1991), Eletroforese de proteínas e isoenzimas de fungos e essências florestais. 2nd ed., UFV, Viçosa. Barbier, P. (1989), Genetic variation and ecotypic
differentiation in the wild rice species Oryza rufipogon. I. Population differentiation in life-history traits and isozymic loci. Jpn. J. Genet., 64, 259-271. Brondani, C., Rangel, P.H.N., Brondani, R.P.V. and
Ferreira, M.E. (2002), QTL mapping and introgression of yield-related traits from Oryza glumaepatula to cultivated rice (Oryza sativa) using microsatellite markers. Theor. Appl. Genet., 104, 1192-1203.
Brondani, R.P.V., Zucchi, M.I., Brondani, C., Rangel, P.H.N., Borba, T.C.O., Rangel, P.N., Magalhães, M.R. and Vencovsky, R. (2005), Genetic structure of wild rice Oryza glumaepatula populations in three Brazilian biomes using microsatellite markers.
Genetica, 125, 115-123.
Buso, G.S.C., Rangel, P.H. and Ferreira, M.E. (1998), Analysis of genetic variability of South American wild rice populations (Oryza glumaepatula) with isozymes and RAPD markers. Mol. Ecol., 7, 107-117. Gao, L.Z. and Hong, D.Y. (2000a), Allozyme variation and population genetic structure of common wild rice
Oryza rufipogon Griff. in China. Theor. Appl. Genet., 101, 494-502.
Gao, L.Z.; Ge, S. and Hong, D.Y. (2000b), Low levels of genetic diversity within populations and high differentiation among populations of a wild rice,
Oryza granulata Nees et Arn. ex Watt., from China.
Int. J. Plant Sci., 161, 691-697.
Gao, L.Z., Schaal, B.A., Zhang, C.H., Jia, J.Z. and Dong, Y.S. (2002a), Assessment of population genetic structure in common wild rice Oryza rufipogon Griff. using microsatellite and allozyme markers. Theor. Appl. Genet., 106, 173-180.
Gao, L.Z., Ge, S. and Hong, D.Y. (2002b), Low levels of allozyme diversity and conservation genetics of common wild rice Oryza rufipogon Griff. from Yunnan, China. Euphytica, 124, 273-281.
Ge, S., Oliveira, G.C.X., Schaal, B.A., Gao, L.Z. and Hong, D.Y. (1999), RAPD variation within and between natural populations of the wild rice Oryza rufipogon from China and Brazil. Heredity, 82, 638-644.
Goudet, J. (2001), FSTAT (Version 1.2): A computer program to calculate F-statistics. Heredity, 86, 485-486, http://www2.unil.ch/izea/softwares/fstat.html. Grover, A. and Pental, D. (1992), Interrelationships of
Oryza species based on electrophoretic patterns of alcohol dehydrogenase. Can. J. Bot., 70, 352-358. Hames, D.B. (1996), One-dimensional polyacrylamide
gel electrophoresis. In-Gel electrophoresis of proteins: a practical approach, ed, D.B. Hames; D. Rickwood. 2nd ed., Oxford University Press, New
York, pp.1-139.
Ishikawa, R.; Toki, N.; Imai, K.; Sato, Y.I.; Yamagishi, H.; Shimamoto, Y.; Ueno, K.; Morishima, H. and Sato, T. (2005), Origin of weedy rice grown in Bhutan and the force of genetic diversity. Genet. Resour. Crop Evol., 52, 395-403.
IRRI – International Rice Research Institute (2005),
Wild rice taxonomy. http://www.knowledgebank.irri.org.
Juliano, A.B.; Naredo, M.E.B. and Jackson, M.T. (1998) Taxonomic status of Oryza glumaepatula
Steud. I. Comparative morphological studies of New World diploids and Asian AA genome species.
Karasawa, M.M.G. (2005), Análise da estrutura genética de populações e sistema reprodutivo de
Oryza glumaepatula por meio de microssatélites. PhD Thesis, Escola Superior de Agricultura “Luiz de Queiroz”, Universidade de São Paulo, Piracicaba, Brazil.
Karasawa, M.M.G.; Vencovsky, R.; Silva, C.M.; Zucchi, M.I.; Oliveira, G.C.X.; Veasey, E.A. (2007), Genetic structure of Brazilian Oryza glumaepatula
Steud. (Poaceae) populations studied with microsatellite markers. Genet. Mol. Biol., 30, 400-410.
Lewis, P.O. and Zaykin, D. (2000), Genetic Data Analysis: computer program for the analysis of allelic data. Version 1.0 (d15).
http://alleyn.eeb.uconn.edu/gda
Mamani, E.M.C. (2002), Avaliação morfo-agronômica e seleção de famílias RC1F3 provenientes de
cruzamentos entre as espécies de arroz cultivado
Oryza sativa e silvestre O. glumaepatula. MSc Thesis, Escola Superior de Agricultura “Luiz de Queiroz”, Universidade de São Paulo, Piracicaba, Brazil.
Miller, M. (1997), Tools For Population Genetic Analyses (TFPGA) 1.3: A windows program for analysis of allozyme and molecular population genetic data. http: //www.public.asu.edu
Morishima, H. (1994), Backgound information about
Oryza species in tropical America. In-Investigations of plant genetic resources in the Amazon basin with the emphasis on the genus Oryza: Report of 1992/93 Amazon Project, eds. H. Morishima, P.S. Martins. The Monbusho International Scientific Research Program, Mishima, and Research Support Foundation of the State of São Paulo, São Paulo, pp.4-5.
Nei, M. (1978), Estimation of average heterozygosity and genetic distance from a small number of individuals. Genetics, 89, 583-590.
Quesada, T.; Lobo, J. and Espinoza, A.M. (2002), Isozyme diversity and analysis of the mating system of the wild rice Oryza latifolia Desv. in Costa Rica.
Genet. Resour. Crop Evol., 49, 633-643.
Ritland, K. (1989), Correlated matings in the partial selfer, Mimulus guttatus. Evolution, 43, 848-859.
Ritland, K. (1996), MLTR: multilocus mating system program. Version 1.1. Available from author.
Ritland, K. (2002), Extensions of models for the estimation of mating systems using n independent loci. Heredity,88, 221-228.
Ritland, K. and Jain, S. (1981), A model for the estimation of outcrossing rate and gene frequencies using n independent loci. Heredity, 47, 35-52.
Rosa, M.S., Santos, P.P. and Veasey, E.A. (2006) Caracterização agro-morfológica interpopulacional em Oryza glumaepatula. Bragantia, 65, 1-10.
Second, G. (1982), Origin of the genic diversity of cultivated rice (Oryza spp.): study of the polymorphism scored at 40 isozyme loci. Jpn. J. Genet., 57, 25-57.
Silva, C.M.; Karasawa, M.M.G.; Vencovsky, R. and Veasey, E.A. (2007), Elevada diversidade genética interpopulational em Oryza glumaepatula Steud. (Poaceae) avaliada com microssatélites. Biota Neotrop., 7, 165-172.
Suh, H.S.; Sato, Y.I. and Morishima, H. (1997), Genetic characterization of weedy rice (Oryza sativa L.) based on morpho-physiology, isozymes and RAPD markers. Theor. Appl. Genet., 94, 316-321.
Vaughan, D.A. (1994), The wild relatives of rice.International Rice Research Institute, Los Baños, Philippines.
Veasey, E.A., Silva, E.F., Schamass, E.A., Oliveira, G.C.X. and Ando, A. (2008), Morphoagronomic genetic diversity in American wild rice species. Braz. Arch. Biol. Technol., 51, 99-108.
Weeden, N.F. and Wendel, J.F. (1989) Genetics of plant isozymes. In-Isozymes in plant biology, eds. D.E. Soltis and P.S. Soltis. Dioscorides Press, Portland, pp. 46-72.
Weir, B.S. (1996), Genetic data analysis II: Methods for discrete population genetic data. Sinauer Associates Inc. Publishers, Sunderland.