Genetic diversity of table grape based on
morphoagronomic traits
Patrícia Coelho de Souza Leão
1*; Cosme Damião Cruz
2; Sérgio Yoshimitsu Motoike
31
Embrapa Semi-Árido, Rod. BR 428, km 152, C.P. 23 – 56300-970 – Petrolina, PE, Brasil. 2
UFV/Centro de Ciências Biológicas e da Saúde – BIOAGRO – 36570-000 – Viçosa, MG – Brasil. 3
UFV/CCA – Depto. de Fitotecnia, Setor de Fruticultura – 36571-000 – Viçosa, MG – Brasil. *Corresponding autor <[email protected]>
ABSTRACT:The conservation and characterization of grape (Vitis spp) genetic resources in germplasm banks have been the basis of its use in breeding programs that result in development of new cultivars. There are at least 10,000 grape cultivars kept in germplasm collection. The genetic diversity in 136 table grape accessions from the state of Bahia, Brazil, was evaluated. Continuous and discrete morphoagronomic traits were assessed. The clustering analysis by the Tocher otimization method resulted in 30 clusters (considering continuous morphoagronomic traits), and 9 clusters (taking into consideration multicategorical traits). There was no agreement between clusters obtained by both, continuous or discrete phenotypic descriptors, independent of the cluster method analysis used. A satisfactory genetic variability among the table grape accessions was observed.
Key words: Vitis spp., genetic resources, grape, multivariate analysis
Diversidade genética de acessos de uvas de mesa baseada em
caracteres morfoagronômicos
RESUMO: A conservação e caracterização dos recursos genéticos de videira (Vitis spp.) em bancos de germoplasma tem sido a base para a sua utilização nos programas de melhoramento, que resultam no desenvolvimento de novas cultivares, estimando-se a existência de pelo menos 10.000 cultivares de uva mantidos em coleções de germoplasma. Avaliou-se a diversidade genética presente em 136 acessos de uvas de mesa de uma coleção de germoplasma do estado da Bahia, com base em caraterísticas morfoagronômicas de variação contínua e discreta. A análise de agrupamento pelo método de Tocher resultou na formação de 30 grupos utilizando-se descritores morfo-agronômicos de variação contínua e 9 grupos, com base em caracteres multicategóricos. Não houve concordância entre os grupos obtidos pela análise de descritores fenotípicos contínuos e discretos, independente do método de agrupamento utilizado. Detectou-se a existência de variabilidade genética satisfatória entre os acessos de uvas de mesa da coleção.
Palavras-chave: Vitis spp., recursos genéticos, uva, análise multivariada
Introduction
Methods based on morphoagronomic traits, used to study genetic diversity, have been used since Mendel’s time. The ampelography is the field of botany con-cerned with identification and classification of grape an-chored in morphological traits of leaves, apical shoot tips, bunches, and berries (IPGRI, UPOV, OIV 1997; Galet 1998). The ampelography was the predominant method for grape germplasm characterization, since XIX century, until the advent of molecular markers.
The predictive methods based on morphological, agronomical, physiological or genetical traits of genitors, determined prior to the crosses, may help breeders to focus in promising combinations (Cruz et al., 2004). The heterosis, expressed in hybrids, is directly related to the genetic diversity among their genitors (Fal-coner, 1989).
The multivariate techniques in the analysis of quan-titative and qualitative characteristics have been applied
sity of genotypes for disease resistance (Nascimento et al., 2006), management (Intrieri et al., 2001), and morpho-logical and agronomic descriptors (Borges et al., 2008; Micheli et al., 1993; Cravero et al., 1994; Matheou et al., 1995a; Matheou et al., 1995b; Boselli et al., 2000; Coelho et al., 2004).
The diversity of 136 accessions was evaluated using twelve morpho-agronomic traits of continuous variation and six characters of discrete variation during four sea-sons, with the main objective to characterize and quan-tify the genetic variability among accessions of table grapes from the Grape Germplasm Collection of EMBRAPA Semiárido.
Material and Methods
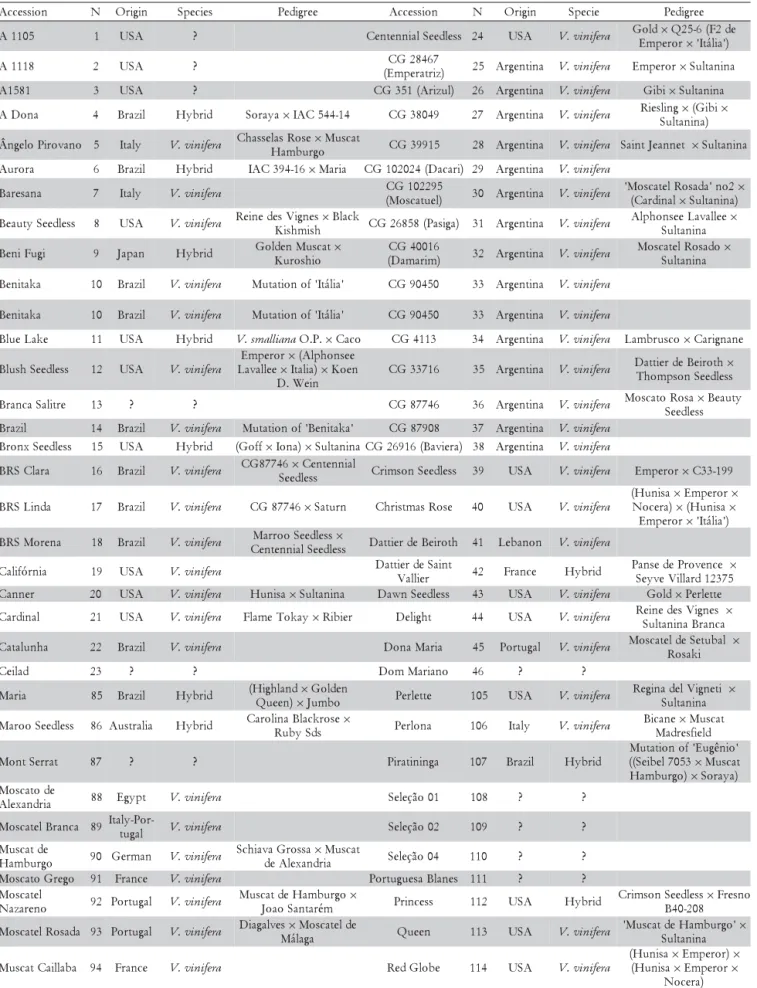
Table 1 – Table grape accession, classification according to origin, specie, and pedigree evaluated in this study. Contine... n o i s s e c c
A N Origin Species Pedigree Accession N Origin Specie Pedigree
5 0 1 1
A 1 USA ? CentennialSeedless 24 USA V.vinifera GEomldp×erQor25-6(F2de
× I'táila)' 8
1 1 1
A 2 USA ? (ECmGp2er8a4t6ri7z) 25 Argentina V.vinifera Emperor×Sutlanina
1 8 5 1
A 3 USA ? CG351(Arizu)l 26 Argentina V.vinifera Gibi×Sutlanina
a n o D
A 4 Brazli Hybrid Soraya×IAC544-14 CG38049 27 Argentina V.vinifera RiesSilungtla×ni(nGai)bi×
o n a v o r i P o l e g n
 5 Italy V.vinifera ChasseHlasamRobsuerg×oMuscat CG39915 28 Argentina V.vinifera SaintJeannet ×Sutlanina
a r o r u
A 6 Brazli Hybrid IAC394-16×Maria CG102024(Dacar)i 29 Argentina V.vinifera
a n a s e r a
B 7 Italy V.vinifera (CMGos1c0a2tu2e95)l 30 Argentina V.vinifera 'M(CoascrdaitnelalRosada'no2×
×Sutlanina)
s s e l d e e S y t u a e
B 8 USA V.vinifera ReinedeKsiVshigmniessh×Black CG26858(Pasiga) 31 Argentina V.vinifera AlphoSnusetleanLinavaallee×
i g u F i n e
B 9 Japan Hybrid GolKdeunroMshuisocat× (CDGam4a0r0i1m6) 32 Argentina V.vinifera MoscSauteltlaRnionsaado×
a k a ti n e
B 10 Brazli V.vinifera Mutationof I'táila' CG90450 33 Argentina V.vinifera
a k a ti n e
B 10 Brazli V.vinifera Mutationof I'táila' CG90450 33 Argentina V.vinifera
e k a L e u l
B 11 USA Hybrid V.smallianaO.P.×Caco CG4113 34 Argentina V.vinifera Lambrusco×Carignane
s s e l d e e S h s u l
B 12 USA V.vinifera
r o r e p m
E ×(Alphonsee e e ll a v a
L ×Itaila)×Koen
n i e W . D 6 1 7 3 3 G
C 35 Argentina V.vinifera DTahtotimerpdsoenBeSiereodtlhes×s
e r ti l a S a c n a r
B 13 ? ? CG87746 36 Argentina V.vinifera MoscatoSReeodslaes×sBeauty
li z a r
B 14 Brazli V.vinifera Mutationof'Bentiaka' CG87908 37 Argentina V.vinifera
s s e l d e e S x n o r
B 15 USA Hybrid (Goff×Iona)×SutlaninaCG26916(Baviera) 38 Argentina V.vinifera
a r a l C S R
B 16 Brazli V.vinifera CG8774S6ee×dlCesesntennial CrimsonSeedless 39 USA V.vinifera Emperor×C33-199
a d n i L S R
B 17 Brazli V.vinifera CG87746×Saturn ChristmasRose 40 USA V.vinifera
a s i n u H
( ×Emperor×
) a r e c o
N ×(Hunisa×
r o r e p m
E × I'táila)' a n e r o M S R
B 18 Brazli V.vinifera CMeanrtreononiSaeleSdeleedssle×ss DattierdeBeiroth 41 Lebanon V.vinifera
a i n r ó fi l a
C 19 USA V.vinifera DattVieraldileerSaint 42 France Hybrid PSaenysveedVeiPllraorvde1n2c3e75× r
e n n a
C 20 USA V.vinifera Hunisa×Sutlanina DawnSeedless 43 USA V.vinifera Gold×Perlette l a n i d r a
C 21 USA V.vinifera FlameTokay×Ribier Deilght 44 USA V.vinifera ReSiunetladneinsaVBigrannesca×
a h n u l a t a
C 22 Brazli V.vinifera DonaMaria 45 Portugal V.vinifera MoscateRldoesaSkeitubal ×
d a li e
C 23 ? ? DomMariano 46 ? ?
a i r a
M 85 Brazli Hybrid (HQiguheelann)d×Golden
×Jumbo Perlette 105 USA V.vinifera
i t e n g i V l e d a n i g e R × a n i n a tl u S s s e l d e e S o o r a
M 86 Austraila Hybrid CaroilRnuabBylaScdksrose× Perlona 106 Italy V.vinifera BicManader×esMfieuldscat
t a r r e S t n o
M 87 ? ? Piratininga 107 Brazli Hybrid (M(Suetibateioln70o5f3'×EuMgêunsicoa't
) o g r u b m a
H ×Soraya) e d o t a c s o M a i r d n a x e l
A 88 Egypt V.vinifera Seleção01 108 ? ?
a c n a r B l e t a c s o
M 89 Itatluy-gPalor- V.vinifera Seleção02 109 ? ? e d t a c s u M o g r u b m a
H 90 German V.vinifera
a s s o r G a v a i h c
S ×Muscat
a i r d n a x e l A e
d Seleção04 110 ? ?
o g e r G o t a c s o
M 91 France V.vinifera PortuguesaBlanes 111 ? ? l e t a c s o M o n e r a z a
N 92 Portugal V.vinifera
o g r u b m a H e d t a c s u M × m é r a t n a S o a o
J Princess 112 USA Hybrid
s s e l d e e S n o s m i r
C ×Fresno
8 0 2 -0 4 B a d a s o R l e t a c s o
M 93 Portugal V.vinifera DiagalveMs×álaMgoascatelde Queen 113 USA V.vinifera 'MuscatSduetlHanainmaburgo'×
a b a ll i a C t a c s u
M 94 France V.vinifera RedGlobe 114 USA V.vinifera
a s i n u H
( ×Emperor)×
a s i n u H
( ×Emperor×
of Bahia, Brazil (9º24’S, 40º26’W, 365.5m a.s.l.). The cli-mate is classified according to Koeppen, as Bswh, which corresponds to the semi-arid hot, with average annual precipitation of 505 mm, annual average relative humid-ity of 60.7%, annual average temperature, maximum, and minimum, respectively 26.7ºC, 32.0ºC, and 20.8ºC (www.cpatsa.embrapa.br/servicos/dadosmet/cem-anual.html).
Mean values were obtained from four plants in four seasons based on 12 morphoagronomic characteristics of continuous variation. The traits were chosen from the list of descriptors of the International Plant Genetic Re-sources Institute (1997), for its importance in the yield and fruit quality: i) duration of the phenological cycle (CD), measured from the date of pruning to harvest (days), ii) production of bunches per plant (PR) - weight of all bunches per plant (kg), iii) number of bunches per plant (NB); iv) mean bunches weight (BW) - total weight of all bunches divided by the total number of bunches per plant (g), v) bunches length (BL), measured between the top and bottom of the rachis (cm), vi) width of the bunches (WB), measured between both extremity side of the rachis (cm), vii) weight of berries (WBe) - mean weight of ten berries per bunch (g), viii) length of berry (LBe) - mean length of ten berries per bunch (mm), ix) diameter of berry (DBe) - mean diameter of ten berries per bunch (mm), x) total soluble solids (TSS), deter-mined from a sample of ten berries per bunch in ºBrix; xi) titratable acidity (TTA), determined from a sample of ten berries per bunch in percentage of tartaric acid / 100 mL of juice; and xii) the total soluble solids (TSS)/
tics were also evaluated, coded as follows: i) consistency of the pulp: crisp (1), fleshy (2), muscilaginous (3), or juicy (4); ii) Presence of seeds: present (1 ) or absent (2); iii) Taste: neutral (1), special (2) muscat (3) or foxy (4); iv) Format of bunches: cylindrical (1), cylindrical winged (2) or cone ( 3); v) Format berries: ovoid (1), globose (2) or elliptical (3); vi) Color: Black (1), red (2), green (3) or green-yellow (4).
Statistical analysis was performed using the software Genes (http://www.ufv.br/dbg/genes/Genes) EUA.htm (Cruz, 2008). To carry out the multivariate analysis, the genetic distances between all pairs of accessions were obtained, using Mean Euclidean distance for continuous variables, and the index of dissimilarity for multicategorical variables. The index of dissimilarity between each pair of accessions was set according to the: agreement (A) and disagreement (D) of categories or sta-tistical classes for the traits studied. Cluster analysis was performed by Tocher’s optimization procedure.
The diversity among accessions based on discrete variables was visualized through graphical projection of distances in three dimensional spaces. The efficiency of the projection was estimated by the following statistics: i) Degree of distortion, ii) Coefficient of correlation be-tween the original distances and those represented in the dispersion graph, and iii) Stress coefficient of Kruskal (1964).
Diversity was also analyzed using the method of mul-tivariate analysis of principal components (Cruz et al., 2004) for continuous variable. The relative importance of characters, used in the discrimination of clusters, was Table 1 – Continuation.
r i o N t a c s u
M 95 France V.vinifera ReginadeiVigneti 115 Hungary V.vinifera ErzseberKiralyneEmleke
×PerlevonCsaba t n i a S e d t a c s u M r e i l l a
V 96 France Hybrid
9 2 1 -2 1 d r a l l i V e v y e S × e s n a
P ReginaRoma 116 ? ?
t a c s u M o e
N 97 Japan V.vinifera MuscatdeAlexandria× u k a j n a S u h s o
K Reliance 117 USA Hybrid Ontario×SuffolkRed e n u t p e
N 98 USA Hybrid Rodi 118 Italy V.vinifera Zibibbo×Sultanina a d a s o R a r a g a i
N 99 Brazil V.labrusca Mutationof'Niágara' RoniRedi 119 ? ? t a c s u M e g n a r
O 100 France V.vinifera RosakiRosada 120 ? V.vinifera
e c o c e r P e s n a
P 101 Italy V.vinifera RubySeedless 121 USA V.vinifera Emperor×Sultana a t a c s o M a i c í r t a
P 102 Brazil Hybrid
a y a r o
S ×((Muscat o g r u b m a
H ×V.cinérea) ×(RedNiagara×
) ) o b m u J t e n n a e J t n i a
S 122 France V.vinifera
a h n i t s i l u a
P 103 Brazil Hybrid 'NiagaraBranca'× a n i n a t l u
S Saturn 123 USA Hybrid
0 1 2 n a t s n u
D ×NewYork 1 9 7 5 4 a i l a r G e d a l r e
P 104 ? ? SeyveVillard12327 124 France Hybrid Seibel6468×Seibel6905 d r a l l i V e v y e S 5 7 3 2
1 125 France Hybrid Seibel6468×Seibel6905 SuperiorSeedless 131 USA V.vinifera Cardinal×? d r a l l i V e v y e S 5 6 3 0
2 126 France Hybrid
e c n e v o r P e d e s n a P × 5 7 3 2 1 d r a l l i V e v y e
S SultaninaBranca 132 Turkey V.vinifera
n o s p m o h T e d e n o l C s s e l d e e S a y a r o
S 127 Brazil Hybrid Qu(Heeignh)l×anPdir×ovGaonlode2n15 SultanaMoscata 133 Italy V.vinifera Zibibbo×Sultanina a n a r v o S o n a v o r i
P 128 Italy V.vinifera
l a h t n e k a r
F ×Deliziade o i r p a
V TardiadeCaxias 134 Brazil Hybrid
a c n a r B a r a g a i
N ×Catawba a s o R r e v o t
S 129 USA Hybrid Mantey×Roucaneuf ThompsonSeedless 135 Turkey V.vinifera
d e R k l o f f u
S 130 USA Hybrid Fredonia×Kishmish i y n r e h
vectors. The eigenvectors and eigenvalues were obtained from the correlation matrix of standardized data of origi-nal values. The characters with higher weights in the last five eigenvectors, up to a value less than or equal to 0.70, have lower contribution in the discrimination of groups and should be discarded (Cruz et al., 2004). Then, the dissimilarities between accessions were viewed by means of dispersion imaging in three dimensional space.
Results and Discussion
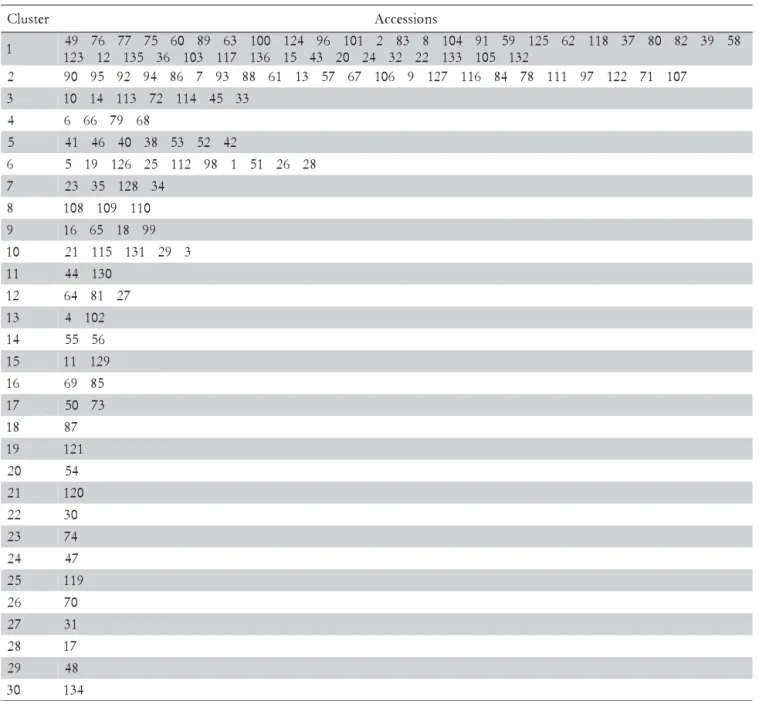
Thirty clusters were obtained by Tocher’s optimi-zation procedure for twelve continuous variables in 136 accessions of table grapes (Table 2). Cluster 1 included 30.14% of the accessions from the collection. In general, it was not possible to identify a trend in the formation
of clusters such as genealogy or geographical origin. Clusters 1 and 2 grouped cultivars of different geographi-cal origins, different species such as Vitis vinifera, Vitis labrusca, Vitis interspecific hybrids, and seeded and seed-less grape cultivars. These results agree with those ob-tained in guarana (Paullinia cupana Kunth.) (Nascimento Filho et al., 2001) and cowpea (Vigna unguiculata L.) (Oliveira et al., 2003), where there was no occurrence of correlation between geographical and genetical diver-sity. Martinelli et al. (2002) also did not obtain a separa-tion of the accessions of okra (Abelmoschus esculentus
Moench), according to their botanical specie, when us-ing multivariate analysis of quantitative traits. Accord-ing to Martinelli et al. (2002), characteristics controlled by many genes and affected by environmental factors may be a suitable explanation.
r e t s u l
C Accessions
1 49 76 77 75 60 89 63 100 124 96 101 2 83 8 104 91 59 125 62 118 37 80 82 39 58 2
3 1 5 0 1 3 3 1 2 2 2 3 4 2 0 2 3 4 5 1 6 3 1 7 1 1 3 0 1 6 3 5 3 1 2 1 3 2 1
2 90 95 92 94 86 7 93 88 61 13 57 67 106 9 127 116 84 78 111 97 122 71 107
3 10 14 113 72 114 45 33
4 6 66 79 68
5 41 46 40 38 53 52 42
6 5 19 126 25 112 98 1 51 26 28
7 23 35 128 34
8 108 109 110
9 16 65 18 99
0
1 21 115 131 29 3
1
1 44 130
2
1 64 81 27
3
1 4 102
4
1 55 56
5
1 11 129
6
1 69 85
7
1 50 73
8
1 87
9
1 121
0
2 54
1
2 120
2
2 30
3
2 74
4
2 47
5
2 119
6
2 70
7
2 31
8
2 17
9
2 48
0
3 134
Cluster 1 had a predominance of seedless grape cul-tivars, which represented 63.4% of this cluster; ‘Thomp-son Seedless’ and its synonyms ‘Catalunha’ and ‘Sultanina Branca’ were included in this group. Most cul-tivars of the muscat type were included in cluster 2. Clus-ter 3 was composed of clones of ‘Itália’ of red berries such as ‘Benitaka’ and ‘Brasil’, and ‘Itália Muscat’, which has soluble solids content and muscat flavor greater the cultivar ‘Itália’. Predominant cultivars in this cluster are distinguished by the size of their berries. Besides those already mentioned, also belong to this group: ‘CG 90450’, ‘Dona Maria’, ‘Queen’, and ‘Red Globe’. Clones and synonyms such as ‘Dattier de Saint Vallier’ and ‘Seyve Villard 20365’, ‘Emperatriz’ and ‘CG 28467’ were separated into distinct groups, showing that the tech-nique of grouping morphoagronomic traits using con-tinuous cluster was not efficient to group identical geno-types. The cluster 17, which has included the cultivars ‘Itália clone 1’ and ‘Estevão Marinho’, was highlighted by the production and bunches sizes.
Considering all the possible combinations for each accession, the majority presented maximum distances for two cultivars: ‘Tardia de Caxias’ (accession 134) and ‘Itália clone 1’ (accession 73), indicating that these cul-tivars were the more divergent of this table grape set. The maximum distance observed between both was d = 3.55,whereas, the cultivars Early Muscat and July Muscat showed the smallest distance (d = 0.21) between all pairs of accessions analyzed.
The mean value of a segregating population depends on the frequency of favorable alleles and the frequency of loci in heterozygosity. When the parents used are adapted, the frequency of favorable alleles is high. Vine has been selected and vegetatively propagated over thou-sands of years since the beginning of the process of do-mestication and cultivation, which contributed to the accumulation of favorable alleles. Being a species highly heterozygous, it is hoped, therefore, to obtain the maxi-mum heterotic effect in segregating generations from the crossing of divergent parents. Considering the multivari-ate statistics, it is expected to find high similarity be-tween the genotypes belonging to the same cluster. Thus, crossing within the same cluster should be avoided. According to Nascimento Filho et al. (2001), the crossing of more productive guarana clones, in the different clusters, allowed to obtain populations highly segregating.
There was genetic variability among accessions in this collection, revealed by the large number of clusters formed and satisfactory distribution of the accessions within these groups. This enables the identification of parents that may form segregating populations with broad genetic base. For the development of new table seedless grape cultivars, one of the strategies suggested is the use of ‘Thompson Seedless’ (cluster 1) as male par-ent, with cultivars that were more divergpar-ent, higher pro-ductive, and possess large berries such as ‘Italy clone 1’
ter 17. Other recommended crosses would be: ‘Thomp-son Seedless’ with ‘Itália melhorada’ (d = 2.03) (cluster 23), ‘Red Globe’ (d = 2.22) or ‘Dona Maria’(d = 2.08) (cluster 3).
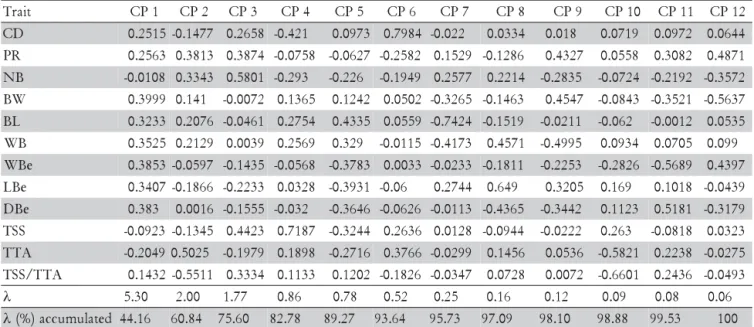
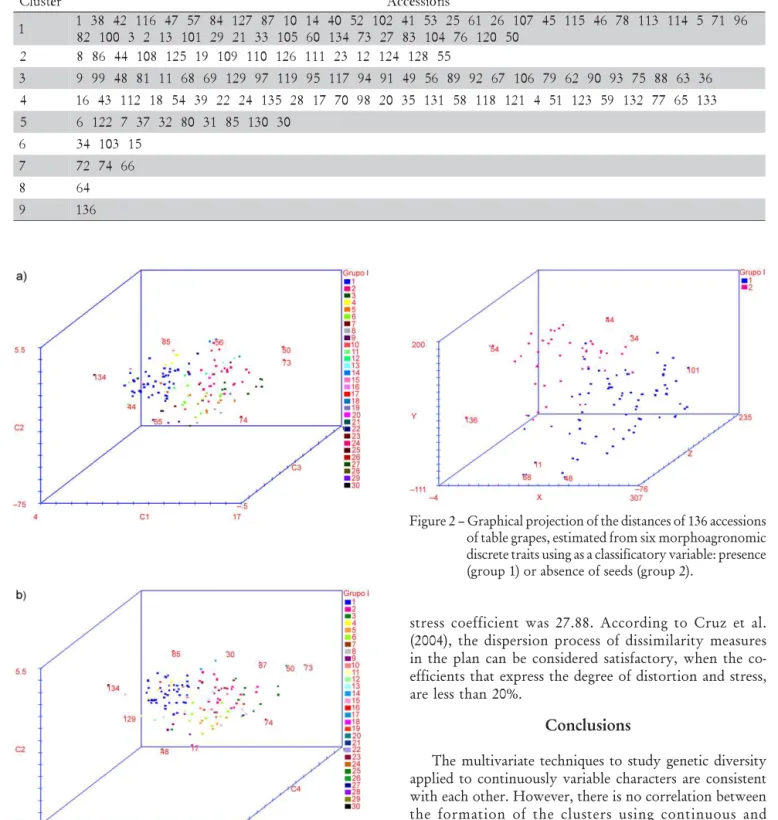
Using multivariate analysis by principal components, most of the variability was retained in the first four prin-cipal components that explained 82.78% of the variance and were used to plot the accessions in the three-dimen-sional space (Figure 1). The principal component 1, rep-resenting 44.16% of total variance, and the variables with higher weight in this component were bunches weigh, berry weight, and berry diameter (Table 3). Component 2 explained 16.67% of the total variance, and it was asso-ciated with the following characteristics: TSS/TTA and titratable acidity (TTA). Component 3 explained 14.77% of the variance of the original data and was represented mainly by the variable number of bunches per plant, to-tal soluble solids (TSS) and yield per plant. Component 4, represented 7.18% of total variance, and the variable with higher weight was the total soluble solids (TSS).
The characters with higher weights in the last five eigenvectors, up to a value less than or equal to 0.70, have lower contribution in the discrimination of groups and should be discarded (Cruz et al. 2004). They were, in decreasing order of importance: bunch weight (BW), weight of berries (WBe), TSS/TTA, width of bunch (WB), and length of berry (LBe).
The score graph of the four first principal components showed that there was consistency with the groups formed by Tocher’s optimization procedure. Borges et al. (2008) also found correlation between groups obtained by Tocher’s optimization procedure and principal compo-nents when studying a set of 58 accessions of this collec-tion. This can be seen in Figures 1A and 1B, considering the groups with the highest number of accessions, clus-ters 1 and 4 positioned to the right side of the X axis, while clusters 2 and 3 were located on the left, and clusters 5 and 6 in the lower portion. The cultivars ‘Tardia de Caxias’ (accession 134) and ‘Itália clone 1’ (accession 73), which showed maximum distance, were positioned at op-posite ends in three-dimensional space.
fu-table grapes using morpho-agronomic traits of continu-ous variation.
Cluster analysis by the Tocher’s optimization pro-cedure resulted in the formation of 9 groups, concentrat-ing 35.3% of accessions in group 1 (Table 5). Cluster 3 consisted only of accessions with muscilaginous and juicy pulp consistency and the vast majority of muscat type cultivars. The American cultivars were also in-cluded in this cluster. Cluster 4 was formed exclusively by seedless grape cultivars. The red clones of the culti-var Itália, ‘Benitaka’ and ‘Brasil’ were included in clus-ter 1 together with ‘Itália’ and clone ‘Itália 1’, both of
Table 3 – Estimates of eigenvalues (λ) and eigenvectors associated with the principal components in 136 accessions of table grapes and twelve morphological and agronomic of continuous variation. Bold values highlight the characteristic of greater weight in their eigenvector.
t i a r
T CP1 CP2 CP3 CP4 CP5 CP6 CP7 CP8 CP9 CP10 CP11 CP12 D
C 0.2515 -0.1477 0.2658 -0.421 0.0973 0.7984 -0.022 0.0334 0.018 0.0719 0.0972 0.0644 R
P 0.2563 0.3813 0.3874 -0.0758 -0.0627 -0.2582 0.1529 -0.1286 0.4327 0.0558 0.3082 0.4871 B
N -0.0108 0.3343 0.5801 -0.293 -0.226 -0.1949 0.2577 0.2214 -0.2835 -0.0724 -0.2192 -0.3572 W
B 0.3999 0.141 -0.0072 0.1365 0.1242 0.0502 -0.3265 -0.1463 0.4547 -0.0843 -0.3521 -0.5637 L
B 0.3233 0.2076 -0.0461 0.2754 0.4335 0.0559 -0.7424 -0.1519 -0.0211 -0.062 -0.0012 0.0535 B
W 0.3525 0.2129 0.0039 0.2569 0.329 -0.0115 -0.4173 0.4571 -0.4995 0.0934 0.0705 0.099 e
B
W 0.3853 -0.0597 -0.1435 -0.0568 -0.3783 0.0033 -0.0233 -0.1811 -0.2253 -0.2826 -0.5689 0.4397 e
B
L 0.3407 -0.1866 -0.2233 0.0328 -0.3931 -0.06 0.2744 0.649 0.3205 0.169 0.1018 -0.0439 e
B
D 0.383 0.0016 -0.1555 -0.032 -0.3646 -0.0626 -0.0113 -0.4365 -0.3442 0.1123 0.5181 -0.3179 S
S
T -0.0923 -0.1345 0.4423 0.7187 -0.3244 0.2636 0.0128 -0.0944 -0.0222 0.263 -0.0818 0.0323 A
T
T -0.2049 0.5025 -0.1979 0.1898 -0.2716 0.3766 -0.0299 0.1456 0.0536 -0.5821 0.2238 -0.0275 A
T T / S S
T 0.1432 -0.5511 0.3334 0.1133 0.1202 -0.1826 -0.0347 0.0728 0.0072 -0.6601 0.2436 -0.0493 λ 5.30 2.00 1.77 0.86 0.78 0.52 0.25 0.16 0.12 0.09 0.08 0.06
λ(%)accumulated 44.16 60.84 75.60 82.78 89.27 93.64 95.73 97.09 98.10 98.88 99.53 100 CD = duration of the phenological cycle (days), PR = production of bunches per plant (kg), NB = number of bunches per plant, BL = bunches length, WB = bunches weight, WBe = weight of berries, LBe = length of berry, DBe = diameter of berry, TSS = total soluble solids, TTA = total titratable acidity, TSS/TTA = ratio total soluble solids (TSS) / total titratable acidity (TTA).
t i a r
T DC PR NB BW BL WB WBe LBe DBe TSS TTA
D
C 0.24**
R
P 0.28** 0.1ns
B
N 0.46** 0.59** 0.23ns
W
B 0.30** 0.43** 0.07ns 0.76**
L
B 0.34** 0.57** 0.12ns 0.86** 0.78**
B
W 0.45** 0.31** 0.23** 0.76** 0.51** 0.58**
e B
W 0.34** 0.14ns 0.17* 0.61** 0.43** 0.46** 0.85**
e B
L 0.39** 0.36** 0.19* 0.76** 0.54** 0.61** 0.92** 0.81**
e B
D -0.05ns -0.01ns 0.05ns -0.18* -0.17* -0.16* -0.22** -0.19* -0.24**
S S
T -0.44** -0.09ns -0.1ns -0.28** -0.18* -0.19* -0.36** -0.39** -0.31** 0.03ns
A T
T 0.40** 0.01ns 0.07ns 0.16ns -0.05ns 0.09ns 0.24** 0.30** 0.16ns 0.33** -0.83**
Table 4 – Pearson’s correlation coefficients obtained among twelve traits, of continuous variation, in 136 accessions of table grapes from the vine germplasm collection of EMBRAPA Semi-Árido.
** and * significant at 1 and 5% of probability, respectively, by the t test. CD = duration of the phenological cycle (days), PR = production of bunches per plant (kg), NB = number of bunches per plant, BL = bunches length, WB = bunches weight, WBe = weight of berries, LBe = length of berry, DBe = diameter of berry, TSS = total soluble solids, TTA = total titratable acidity.
white berries. However, the clones ‘Itália melhorada’ and ‘Itália Muscat’, which are differentiated by the more accentuated moscatel taste, were placed in cluster 7. It was not possible to group the accessions that are syn-onyms, i.e., they represent the same phenotype when us-ing discrete variables.
stress coefficient was 27.88. According to Cruz et al. (2004), the dispersion process of dissimilarity measures in the plan can be considered satisfactory, when the co-efficients that express the degree of distortion and stress, are less than 20%.
Conclusions
The multivariate techniques to study genetic diversity applied to continuously variable characters are consistent with each other. However, there is no correlation between the formation of the clusters using continuous and multicategorical variables. The characteristic ‘weight of berry’ can be refuse in future work on morpho-agronomic evaluation of accessions of table grapes. Cluster analysis based on morpho-agronomic characters resulted in the separation of accessions according to common character-istics such as weight and berry production (continuous variables), consistency of the pulp and the presence of seeds (multicategorical variables), but is not efficient in r
e t s u l
C Accessions
1 1 38 42 116 47 57 84 127 87 10 14 40 52 102 41 53 25 61 26 107 45 115 46 78 113 114 5 71 96 0
5 0 2 1 6 7 4 0 1 3 8 7 2 3 7 4 3 1 0 6 5 0 1 3 3 1 2 9 2 1 0 1 3 1 2 3 0 0 1 2 8
2 8 86 44 108 125 19 109 110 126 111 23 12 124 128 55
3 9 99 48 81 11 68 69 129 97 119 95 117 94 91 49 56 89 92 67 106 79 62 90 93 75 88 63 36
4 16 43 112 18 54 39 22 24 135 28 17 70 98 20 35 131 58 118 121 4 51 123 59 132 77 65 133
5 6 122 7 37 32 80 31 85 130 30
6 34 103 15
7 72 74 66
8 64
9 136
Table 5 – Grouping according to Tocher’s optimization procedure, based on six multicategorical variables evaluated in 136 accessions of table grapes.
Figure 2–Graphical projection of the distances of 136 accessions of table grapes, estimated from six morphoagronomic discrete traits using as a classificatory variable: presence (group 1) or absence of seeds (group 2).
References
Borges, R.M.E.; Gonçalves N.P.S.; Gomes A.P.O.; Alves E.O.S. 2008. Phenotypic divergence among table grapes accesses in the Brazilian Semi-Arid. Pesquisa Agropecuária Brasileira 43: 1025-1030. (in Portuguese, with abstract in English).
Boselli, M.; Corso, C.; Monaco, A. 2000. Amplographic characterization of white grape varieties in Campania (Southern Italy) by multivariate analysis. Acta Horticulturae 528: 75-81. Coelho, I.; Cunha, J.; Cunha, J.P.; Carneiro, L.C.; Castro, R.; Eira
Dias, J.E. 2004. Ampelometric comparison of wild vine Vitis vinifera L. populations and old grapevine cultivars of the south of Portugal. Ciência e Técnica Vitivinícola, Dois Portos 19: 1-12. (in Portuguese, with abstract in English).
Cravero, M.C.; Guidoni, S.; Schneider, A.; Stefano, R. 1994. Morphological and biochemical characterisation of coloured berry-muscat grapevine cultivars. Vitis 33: 75-80.
Cruz, C.D. 2008. Genes Software: Genetic Diversity. Viçosa Press, Viçosa, MG, Brazil. (in Portuguese).
Cruz, C.D.; Regazzi, A.J.; Carneiro, P.C.S. 2004. Biometric Models Applied to Breeding. 3ed. Viçosa Press, Viçosa, MG, Brazil. (in Portuguese).
Falconer, D.S. 1989. Introduction to Quantitative Genetics. 3ed. Longman, New York, NY, USA.
Galet, P. 1998. Grape Varieties and Rootstocks Varieties. Oenoplurimédia, Paris, France, 315 p.
Intrieri, C.; Silvestroni, O.; Filipetti, I.; Bucchetti, B. 2001. Assessment of a cv. Sangiovese clone’s morphological variability in differing environmental and management conditions. Advances in Horticultural Science 15: 79-84.
International Plant Genetic Resources Institute. 1997. Descriptors for Grapevine (Vitis spp). IPGRI, Rome, Italy, 62 p.
Kruskal, J.B. 1964. Multidimensional scaling by optimizing goodness of fit to a non-metric hypothesis. Psychometrika 29: 1-27. Martinelli, G.E.; Leal, N.R.; Amaral Júnior, A.T.; Pereira, M.G.;
Daher, R.F. 2002. Genetic divergency of okra accessions based on morphological characteristics. Horticultura Brasileira 20: 52-58. (in Portuguese, with abstract in English).
Matheou, A.; Stavropoulos, N.; Samaras, S. 1995a. Studies on table grape germplasm grown in Northern Greece. I. Maturity time, bunch characteristics and yield. Vitis 34: 155-158.
Matheou, A.; Stavropoulos, N.; Samaras, S.1995b. Studies on table grape germplasm grown in Northern Greece. II. Seedlessness, berry and must characteristics. Vitis 34: 217-220.
Micheli, L.; Campostrini, F.; Iacono, F.; Stefanini, M. 1993. Evaluation of genetic divergence among clones by means of phyllometric techniques. Vignevine 20: 64-69.
Nascimento, A.R.P.; Michereff, S.J.; Mariano, R.L.R.; Viana, I.O. 2006. Reaction of grapevine clones to Xanthomonas campestris pv. viticola, based on epidemiological components of bacterial canker. Ciência Rural 36: 1-7. (in Portuguese, with abstract in English).
Nascimento Filho, F.J.; Atroch, A.L.; Souza, N.R.; Garcia, T.B.; Cravo, M.S.; Coutinho, E.F. 2001. Genetic divergence between clones of guarana. Pesquisa Agropecuária Brasileira 36: 501-506. (in Portuguese, with abstract in English).
Oliveira, F.J.O.; Anunciação Filho, C.J.A.; Bastos, G.Q.; Reis, O.V. 2003. Genetic divergence among cultivars of cowpea. Pesquisa Agropecuária Brasileira 38: 605-611. (in Portuguese, with abstract in English).