Joint analysis of phenotypic and molecular diversity provides new insights
on the genetic variability of the Brazilian physic nut germplasm bank
Alexandre Alonso Alves
1, Leonardo Lopes Bhering
2, Tatiana Barbosa Rosado
1, Bruno Galvêas Laviola
1,
Eduardo Fernandes Formighieri
1and Cosme Damião Cruz
21
Embrapa Agroenergia, Brasilia, DF, Brazil.
2
Universidade Federal de Viçosa, Viçosa, MG, Brazil.
Abstract
The genetic variability of the Brazilian physic nut (Jatropha curcas) germplasm bank (117 accessions) was assessed using a combination of phenotypic and molecular data. The joint dissimilarity matrix showed moderate correlation with the original matrices of phenotypic and molecular data. However, the correlation between the phenotypic dis-similarity matrix and the genotypic disdis-similarity matrix was low. This finding indicated that molecular markers (RAPD and SSR) did not adequately sample the genomic regions that were relevant for phenotypic differentiation of the ac-cessions. The dissimilarity values of the joint dissimilarity matrix were used to measure phenotypic + molecular diver-sity. This diversity varied from 0 to 1.29 among the 117 accessions, with an average dissimilarity among genotypes of 0.51. Joint analysis of phenotypic and molecular diversity indicated that the genetic diversity of the physic nut germplasm was 156% and 64% higher than the diversity estimated from phenotypic and molecular data, respec-tively. These results show thatJatropha genetic variability in Brazil is not as limited as previously thought.
Keywords: molecular variability,Jatropha curcasL., phenotypic variability.
Received: January 28, 2013, Accepted: April 18, 2013.
Introduction
The high quality of physic nut (Jatropha curcasL.)
oil (which meets Brazilian, US and European quality stan-dards) and the ease with which it can be converted into biodiesel by either chemical (Berchmans and Hirata, 2008) or biological transesterification reactions (Modi et al.,
2007) have made this species, together with the oil palm (Elaeis guineensis), the most promising plant species
(Laviola et al., 2010) for complementing soybean as a
source of oil for biodiesel production in the near future (Durães et al., 2011). The existence of an intense,
well-organized research program led by the Brazilian Agri-cultural Research Corporation (Embrapa) that addresses most of the problems related toJatrophacultivation and oil
production (Durãeset al., 2011) has favored this species to
the detriment of others that lack such an initiative. As one of the first steps to ensure thatJatrophamay
be cultivated in large scale production fields, Embrapa has initiated a breeding program. The initial results have been very promising (Drumondet al., 2010; Rosadoet al., 2010;
Gurgelet al., 2011; Laviolaet al., 2010, 2012a,b; Rochaet al., 2012; Bheringet al., 2012, 2013). Specifically, these
re-sults show that (1) it is possible to phenotypically select
su-perior physic nut families and individuals, regardless of the selection strategy used, (2) physic nut genotypes respond differentially to different selection methods, (3) combined selection and BLUP (Best Linear Unbiased Prediction) are the best methods for rapid improvement of the species, (4) the application of combined selection or BLUP to the Bra-zilian physic nut leads to high genetic gains in the initial stages of the breeding program and (5) genotypes with en-hanced productivity can be selected and released as im-proved cultivars. The application of molecular tools is also being investigated as a means of accelerating the domesti-cation of this species and for identifying superior genotypes to be released for commercial purposes (Durães et al., 2011; Silva-Junioret al., 2011).
Virtually all of these results rely on the evaluation of the Jatropha germplasm collection established by
Embrapa. This germplasm bank is one of the largest in the world in terms of absolute number of accessions (~200) and plants (> 2000), and is thought to represent most of the ge-netic variability of the species in Brazil (Rosado et al.,
2010). Initial characterization of the Brazilian Jatropha
germplasm bank using molecular markers (Rosadoet al., 2010) indicated the existence of limited genetic variability. Similarity-based clustering revealed only 43 unique multi-locus profiles in the 192 accessions evaluated. Con-sidering that the physic nut is preferentially an outcrossing
www.sbg.org.br
species (Ginwalet al., 2005) a high degree of genetic
varia-tion was expected to occur. Other reports that have exam-ined the genetic diversity ofJ. curcasusing different types
of molecular markers have also shown that in general there is limited variation in the most accessible germplasm re-sources of this species in various countries (Ramet al.,
2008; Sun et al., 2008; Pamidimarri et al., 2009;
Subramanyamet al., 2009).
The recurrent finding of low genetic diversity indi-cates that this is a worldwide phenomenon, probably be-cause physic nut dispersal has depended mainly on anthropic action. During the initial dispersal, seeds from a limited number of plants were probably collected and planted abroad. In addition, since physic nut plants often occur as isolated individuals interbreeding is not very fre-quent, and this may further limit the genetic diversity. Ex-perimentally, neutral molecular marker techniques such as RAPD (random amplified polymorphic DNA) or SSR (simple sequence repeats) that are commonly used in mo-lecular diversity studies may sample diversity in non-coding regions of the genome (Collardet al., 2005)
and may therefore have limited use in predicting the phenotypic diversity of individuals, especially in complex traits such as yield. Consequently, low molecular variabil-ity may not be accompanied by low phenotypic variabilvariabil-ity for important traits. In agreement with this conclusion, and as confirmation of the representativeness of the Embrapa germplasm collection, we have reported the existence of moderate phenotypic diversity that allows elevated genetic gains to be obtained within a short period (Laviolaet al.,
2010, 2012a,b).
Based on the foregoing considerations, it is clear that the genetic variability of the BrazilianJatrophagermplasm
bank has not been fully investigated. Given the importance of this germplasm bank, it would be interesting not only to measure genetic diversity based on molecular or phenotypic traits separately, but to combine them into a sin-gle analysis in order to get a clear picture of the actual di-versity available. Methods that allow such an analysis exist (Cruzet al., 2011), but are not used very often because only
a few germplasm collections have been characterized phenotypically and molecularly. Since the Brazilian
Jatrophagermplasm collection has already been
character-ized phenotypically and molecularly, the objectives of this study were to (1) determine the extent to which molecular diversity resembles phenotypic diversity, (2) determine how well the combined distance matrix correlates with dis-tance matrices based on phenotypic and molecular data, (3) evaluate the suitability of different procedures for perform-ing a joint analysis of phenotypic and molecular diversity, (4) verify whether a joint analysis of phenotypic and molec-ular diversity could help discriminate genotypes within the Brazilian Jatropha population and (5) verify whether a
joint analysis of phenotypic and molecular diversity can re-veal novel patterns of genotype grouping. By using two
complementary data sets (phenotypic and molecular data previously generated by our group) we sought to provide a better assessment of the existing diversity. The results of this study may be helpful in determining the need for addi-tional collections to improve the representativeness of the germplasm bank and allow further genetic characterization ofJatropha.
Material and Methods
Plant material and experimental design
A set of 117J. curcasaccessions collected in
differ-ent geographical regions throughout Brazil (Rosadoet al.,
2010) and belonging to the Embrapa germplasm bank was used in the experiment. The germplasm bank is located in the experimental area of Embrapa Cerrados at Planaltina, DF, Brazil (15°35’30” south latitude and 47°42’30” west longitude, at 1007 m altitude)]. The field experiment was done using a randomized blocks design with two replicates and five adult plants per plot arranged in rows (4 m x 2 m spacing). The cultural management practices,i.e., nutrition,
pest and disease control, for maintenance of the germplasm bank were those recommended for the species (Diaset al.,
2007; Laviolaet al., 2010).
Phenotypic and molecular characterization
Phenotypic evaluation of the 117 accessions was done in the second year of cultivation and was based on re-productive and vegetative traits (Laviolaet al., 2010). The
following phenotypic traits were evaluated: (1) grain yield (Yield, g), (2) weight of 100 seeds (W100, g), (3) number of
seeds per fruit (NSF, n), (4) endosperm/seed ratio (E/S), (5) seed length (SL, mm), (6) seed width (SW, mm), (7) seed thickness (ST, mm), (8) total number of branches per plant at 0.5 m above ground (TNB 0.5), (9) total number of branches per plant at 1 m above ground (TNB 1.0), (10) to-tal number of branches per plant at 1.5 m above ground (TNB 1.5), (11) plant height (height, m), (12) stem diame-ter (SD, mm), (13) canopy projection on the row measured as the extent of the canopy (in meters) in the planting row (CPR, m), (14) canopy projection between lines (CPBL, m),
(15) canopy volume, measured as the extent of the canopy (in meters) between adjacent planting lines (CV, m3), (16)
juvenility measured as the number of days from planting to first flowering (NDF, days) and (17) height of the first in-florescence (HFI, m). The canopy volume was estimated by approximating the volume of a cylinder with an elliptical base using the formula
Vcanopy = ×D ×D h
æ è
ç ö
ø ÷
p 1 2
2 2 ,
whereVcanopy= canopy volume (m3),p= 3.14159,D1=
can-opy diameter at the widest point (m),D2= canopy diameter
at the narrowest point (m) andh= plant height (m), as
estimated genetic and environmental parameters using mixed models (REML/BLUP) and have found that medium to high accuracies can be obtained for breeding values by using only one measure in a single environment (Laviolaet al., 2010, 2012a,b). This finding demonstrates that the type
of evaluation used in this experiment is useful for predict-ing the genetic value of accessions.
The molecular data used in this study were obtained as reported by Rosadoet al.(2010). Briefly, total genomic DNA was extracted from the young leaves of two plants per accession, i.e., two biological replicates, using a CTAB protocol (Grattapaglia and Sederoff, 1994). The DNA con-centration was measured using a Nanodrop spectrophoto-meter (Nanodrop Products, Wilmington, DE, USA) and the concentration of each sample was adjusted to 2-5 ng/mL. Fifteen RAPD primers (Operon Technologies, Inc., Huntsville, AL, USA; DT Technologies, Coralville, IA, USA) and two SSR primer pairs (jcps20-1 and jcps20-2) were scored. The selected primers were previously tested for polymorphism in this same set ofJatrophaaccessions
and found to amplify robust (reproducible) loci (Rosadoet al.,2010). RAPD and SSR loci were amplified by the
poly-merase chain reaction (PCR) using standard procedures (Rosadoet al., 2010). RAPD products were visualized on
1.5% agarose gels and SSR products were electroinjected in an ABI 3100XL Genetic Analyzer (Applied Biosystems, Foster City, CA, USA) and data were collected with virtual filter D using GeneScan 2.0. Alleles were declared using Genotyper 2.1 (Applied Biosystems). An internal size stan-dard labeled with ROX (Brondani and Grattapaglia, 2001) was used for sizing SSR alleles. All analyses related to the amplification, interpretation and robustness of RAPD markers were done as described by Grattapaglia and Se-deroff (1994) and Reis and Grattapaglia (2004).
Genetic diversity analyses
Since we had access to morphological and molecular data, different strategies for studying the genetic diversity of physic nut based on parallel molecular and phenotypic analyses were tested. Initially, the phenotypic data were used to generate a dissimilarity matrix based on Gower’s method (Gower, 1971) and the molecular data were used to generate a dissimilarity matrix based on Jaccard’s coeffi-cient (Jaccard, 1901). To combine phenotypic and molecu-lar data, the Gower and Jaccard dissimimolecu-larity matrices were summed algebraically to generate a new matrix referred to as the joint dissimilarity matrix. By combining dissimilar-ity matrices based on different data sets,i.e., phenotypic
and molecular, our aim was to simultaneously assess all in-formation at once, thereby capturing all available informa-tion.
Graphic representations of the matrices were gener-ated based on color gradients that were used to express the dissimilarity between genotypes. Red was used to indicate lower genetic dissimilarity while green was used to indicate
the most dissimilar accessions. A score of zero corre-sponded to the lowest genetic dissimilarity (represented by red) while a score of 1 corresponded to maximum genetic dissimilarity (represented by green). The correlation be-tween the dissimilarity matrices described above was also examined. The correlations and their significances were tested by using Mantel’s Z test with 1000 permutations (Manly, 1997). This procedure allowed us to assess the re-semblance between the genotypic and phenotypic matrices and between the genetic dissimilarity matrices and joint dissimilarity matrix.
After generating the dissimilarity matrices the genetic diversity of the Brazilian physic nut population was ini-tially assessed based on a 3D dispersion analysis. For this, the dissimilarity matrices generated with Gower’s index, Jaccard’s index and by combining the Gower and Jaccard information were used to produce three groups of x, y and z coordinates,i.e., a distance projection in three dimensional
space using Genes software (Cruz, 2009). The coordinates were later used to construct 3D scatter plots with SigmaPlot v.12.0. In these graphs, greater dot dispersion indicated greater genetic diversity of the population. We later ex-panded this group analysis by using Tocher’s clustering method. In this method the accessions were assigned to groups consisting of equivalent genotypes. The groups were presented using letter coded group profiles. Acces-sions allocated to the same group based on Tocher’s cluster analysis were presented in the same color in the 3D scatter plots.
Results
The phenotypic and molecular diversity of physic nut was assessed by generating various dissimilarity matrices based on Gower’s and Jaccard’s indices. Table 1 shows the minimum, maximum and mean genetic dissimilarities and Figure 1 shows the graphic representation of the dissimilar-ity matrices. The data in Table 1 and Figure 1 indicate that physic nut diversity is limited at the molecular and pheno-typic levels, as shown by the yellow and red points in the figure. Red and yellow points indicate highly and moder-ately similar genotype pairs, whereas green points indicate highly divergent genotype pairs. Although numerous re-ports have indicated low molecular diversity, the present data indicate that the mean molecular dissimilarity is greater than the mean phenotypic dissimilarity. However,
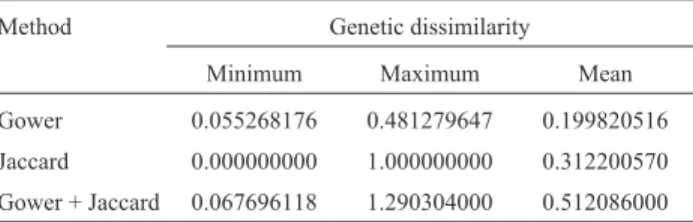
Table 1- Descriptive statistics for genetic diversity in the physic nut ac-cording to the method used to calculate genetic distances.
Method Genetic dissimilarity
Minimum Maximum Mean
Gower 0.055268176 0.481279647 0.199820516
Jaccard 0.000000000 1.000000000 0.312200570
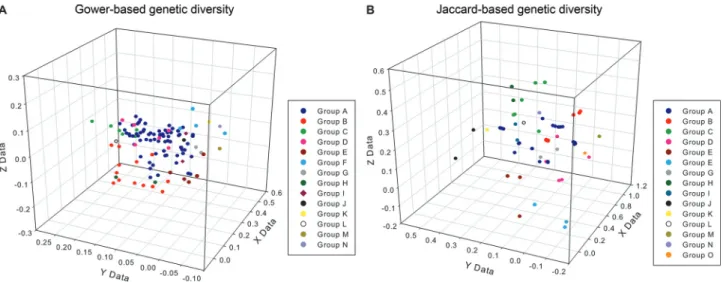
more genotypic pairs are closely related to each other based on molecular markers than on phenotypic data (Figure 1). The higher individual dissimilarities in the molecular data compared to phenotypic data most likely accounted for the higher general mean in the former. In accordance with this conclusion, the 3D dispersion graphs representing the rela-tionship among genotypes (accessions) based on the two dissimilarity indices (Figure 2) demonstrated that most of the genotypes were concentrated in a dense dot “cloud” when analyzed with phenotypic data. On the other hand, the
molecular data allowed genotypes to be allocated into dis-tinct groups that were more divergent among each other. Table 2 shows the results of the statistical analysis of the 3D scatterplots, including the distortion associated with the es-timated coordinates. As can be seen, the projections pre-sented in Figure 3 were not error free since there was a small distortion in all cases.
Since the grouping of genotypes into significant clus-ters was found to be impossible based on visual examina-tion of the scatter plots, we undertook a cluster analysis
Figure 1- (A) Gower’s dissimilarity matrix and (B) Jaccard’s dissimilarity matrix. A color gradient was used to graphically express the dissimilarity be-tween genotypes. Red indicates the most similar accessions,i.e., lowest genetic dissimilarity, while green indicates the most dissimilar accessions,i.e., lowest genetic similarity. A value of zero corresponded to the lowest genetic dissimilarity (represented by red) while 1 corresponded to the maximum ge-netic dissimilarity (represented by green). The dissimilarity matrices were symmetric and, consequently, the dissimilarity values below the diagonal were equivalent to those above the diagonal.
based on Tocher’s method (Tables 3 and 4). This analysis revealed 14 and 15 distinct groups for the 117 accessions based on phenotypic and molecular data, respectively. Dots representing distinct groups of accessions were then differ-entiated in the scatter plot using different colors (Figure 2). Interestingly, nearly 60% of 117 accessions occurred in a single group (Group A) based on phenotypic and molecular information, thus confirming the previous conclusion re-garding limited phenotypic and molecular diversity in the Brazilian cultivated germplasm.
Although the diversity analyses based on phenotypic or molecular data resulted in a similar number of indistin-guishable groups and a similar concentration of genotypes in a single group, the correlation between Gower’s dissimi-larity matrix and Jaccard’s dissimidissimi-larity matrix was never-theless low (Table 5). This finding indicates that molecular markers (RAPDs and SSRs) are not sampling the same genomic regions that are relevant to phenotypic differentia-tion of the accessions.
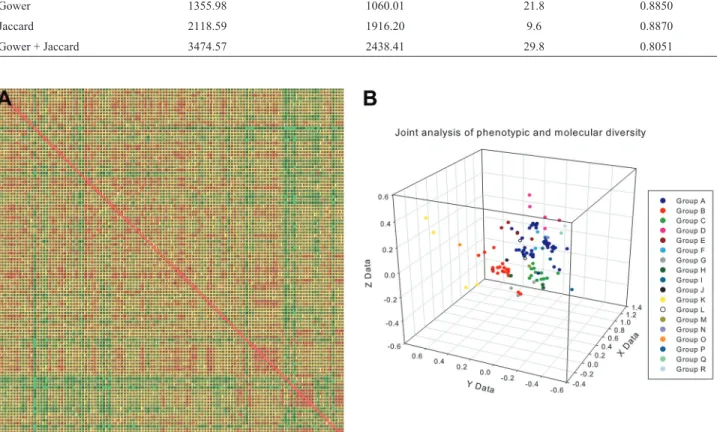
After these analyses, the phenotypic dissimilarity ma-trix was combined with the molecular dissimilarity mama-trix generated using Jaccard’s index. The combination was done by algebraically summing the matrices. No data stan-dardization was required since these indices generated dis-similarity coefficients that varied between 0 and 1. The cor-relation between the joint dissimilarity matrix and the original dissimilarity matrices was then examined. As shown in Table 5, the new dissimilarity matrix displayed moderate correlation with the original matrices (phenotypic or molecular). This finding indicated a moderate degree of likelihood between this matrix and the original informa-tion, and that the procedure may be employed when one de-sires to use both phenotypic and molecular information in a single analysis. The dissimilarity values in the joint dissim-ilarity matrix were used to measure phenotypic + molecular diversity. This diversity varied from 0 to 1.29 among the 117 accessions, with an average dissimilarity among geno-types of 0.51 (Table 1). Figure 3 shows the combined
dis-Figure 3- (A) Joint dissimilarity matrix. A color gradient was used to express the dissimilarity between genotypes. Red indicates the most similar acces-sions,i.e., lowest genetic dissimilarity, while green indicates the most dissimilar accessions,i.e., lowest genetic similarity. A value of zero corresponded to the lowest genetic dissimilarity (represented by red) while 1 corresponded to the maximum genetic dissimilarity (represented by green). The dissimilar-ity matrices were symmetric and, consequently, the dissimilardissimilar-ity values below the diagonal were equivalent to those above the diagonal. (B) 3D scatter plots showing the relationship among physic nut accessions assessed using phenotypic and molecular data jointly. The dots representing distinct groups of accessions (based on Tocher’s cluster analysis) are show in different colors. X, Y and Z axis coordinates were calculated based on the distance projec-tion. Note the different scales of the graph.
Table 2- Statistics for the graphic dispersion of physic nut accessions in three dimensional space, according to the method used to calculate genetic dis-tances.
Method Sum of original distances (od) Sum of estimated distances (ed) Distortion (%) od-ed Correlation
Gower 1355.98 1060.01 21.8 0.8850
Jaccard 2118.59 1916.20 9.6 0.8870
similarity matrix along with the 3D dispersion graph repre-senting the relationship among genotypes (accessions) in terms of their joint phenotypic and molecular diversity. Comparison of this graphical representation with the gra-phical representation of Gower’s or Jaccard’s dissimilarity matrices (Figure 1) suggests that the joint dissimilarity trix shares a high degree of likelihood with the original ma-trices (shown earlier by correlation analysis) and, at the
same time, that this procedure is efficient in enhancing the sampling of genetic diversity. Such a matrix is therefore probably more realistic than the other matrices.
The results of Tocher’s cluster analysis, based on the joint dissimilarity matrix, are presented in Table 6. Com-pared to previous studies, the joint analysis of phenotypic and molecular diversity revealed new insights into the ge-netic diversity of the germplasm of cultivated physic nut.
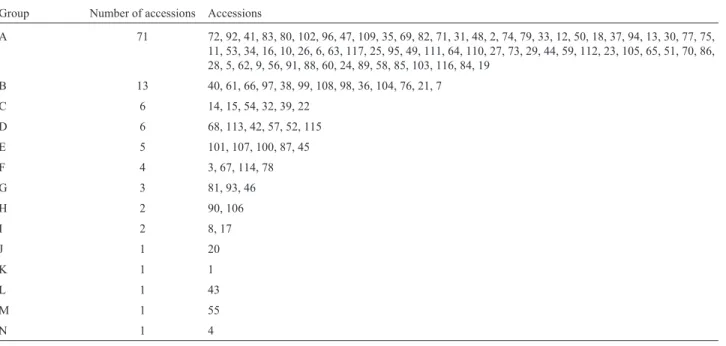
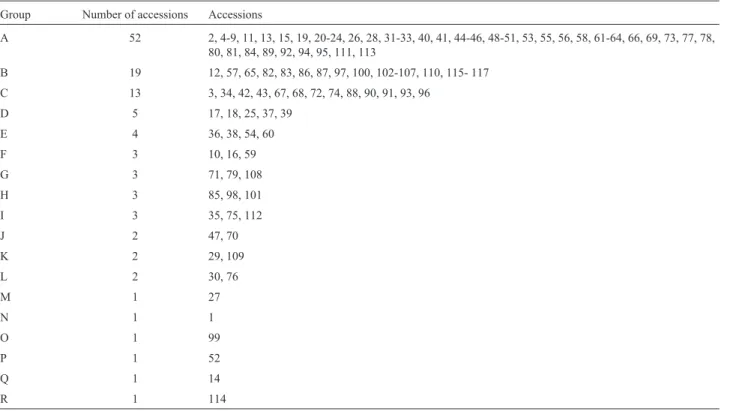
Table 3- Results for Tocher’s cluster analysis based on Gower’s dissimilarity matrix. Indistinguishable accessions (Gower’s similarity = 1.0) were grouped in letter-coded groups.
Group Number of accessions Accessions
A 71 72, 92, 41, 83, 80, 102, 96, 47, 109, 35, 69, 82, 71, 31, 48, 2, 74, 79, 33, 12, 50, 18, 37, 94, 13, 30, 77, 75, 11, 53, 34, 16, 10, 26, 6, 63, 117, 25, 95, 49, 111, 64, 110, 27, 73, 29, 44, 59, 112, 23, 105, 65, 51, 70, 86, 28, 5, 62, 9, 56, 91, 88, 60, 24, 89, 58, 85, 103, 116, 84, 19
B 13 40, 61, 66, 97, 38, 99, 108, 98, 36, 104, 76, 21, 7
C 6 14, 15, 54, 32, 39, 22
D 6 68, 113, 42, 57, 52, 115
E 5 101, 107, 100, 87, 45
F 4 3, 67, 114, 78
G 3 81, 93, 46
H 2 90, 106
I 2 8, 17
J 1 20
K 1 1
L 1 43
M 1 55
N 1 4
Table 4- Results for Tocher’s cluster analysis based on Jaccard’s dissimilarity matrix. Accessions with indistinguishable multilocus marker genotypes (Jaccard’s dissimilarity = 0) were grouped in letter-coded groups.
Group Number of accessions Accessions
A 70 2, 11, 20, 21, 26, 32, 36, 45, 46, 48, 49, 55, 69, 4, 6, 7, 9, 15, 24, 28, 31, 33, 40, 41, 44, 51, 53, 56, 58, 63, 64, 77, 78, 1, 5, 42, 81, 35, 8, 13, 19, 22, 23, 61, 62, 66, 73, 84, 89, 92, 94, 95, 113, 38, 54, 60, 80, 111, 3, 34, 43, 50, 67, 68, 72, 88, 90, 91, 93, 59
B 17 57, 65, 82, 86, 97, 100, 102, 104, 105, 106, 107, 115, 116, 117, 83, 103, 110
C 6 12, 87, 71, 47, 70, 96
D 5 25, 39, 17, 37, 18
E 3 29, 109, 114
F 3 85, 101, 98
G 2 10, 16
H 2 79, 108
I 2 75, 112
J 2 30, 76
K 1 74
L 1 27
M 1 52
N 1 99
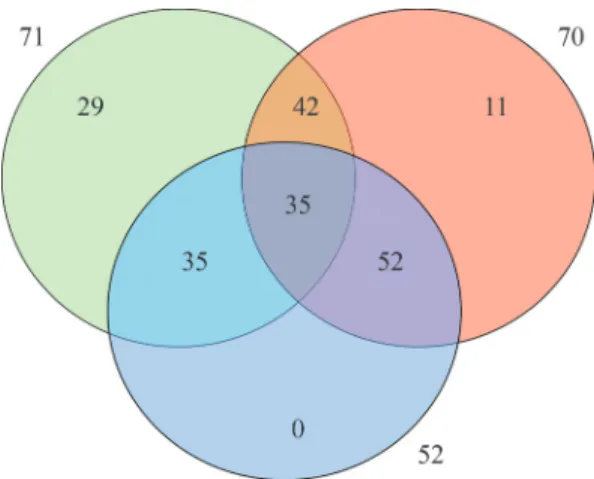
The joint dissimilarity was greater than phenotypic or mo-lecular dissimilarity (156% and 64% higher, respectively). Tocher’s clustering method revealed an increase in the number of indistinguishable groups among the 117 acces-sions (18 groups). Interestingly, the largest group (group A) generated by the joint analysis of phenotypic and molecular data contained only 44% of the 117 accessions. Compared to the largest group generated using phenotypic and molec-ular independently, this number is nearly 27% smaller. Moreover, considering only this major group in the cluster-ing generated by Tocher/Gower, Tocher/Jaccard and Tocher phenotypic/molecular data analyses, 42 of the ac-cessions that were grouped in Group A based on molecular markers were also grouped based on phenotypic data, 35 of the accessions grouped in Group A based on phenoty-pic/molecular data were also grouped based on phenotypic data, 52 of the accessions grouped in Group A based on
phenotypic/molecular data were also grouped based on mo-lecular data and 35 accessions were consistently grouped together, regardless of the dissimilarity matrix in which the cluster analysis was performed (Figure 4). This result indi-cates that some genotypes are always grouped together, re-gardless of the strategy used to study genetic diversity and should really be considered as duplicates or close geno-types when assessing germplasm conservation.
Together, these results indicate that the genetic diver-sity in the germplasm bank of the Brazilian physic nut is small, but not as limited as previously thought based on the studies by Rosadoet al. (2010) and Laviolaet al. (2010,
2012b). These results also indicate that the joint analysis of phenotypic and molecular data is effective in capturing all existing genetic variability.
Discussion
To the best of our knowledge this is the most compre-hensive assessment of the genetic diversity of the cultivated physic nut germplasm in Brazil, and one of the first to be based on phenotypic and molecular data. The phenotypic data used in this study were derived from two of the most comprehensive studies of genetic parameters in physic nut performed to date (Laviolaet al., 2010, 2012b). The traits
list encompassed vegetative (tree architecture traits) and re-productive traits, including grain yield, considered to be the most important trait to be improved in forthcoming years to
Table 5- Correlation coefficients between the dissimilarity matrices for phenotypic and molecular data.
Matrices Correlation
Jaccard (Jac) and Gower (Gow) 0.26360+*
Jaccard (Jac) and Joint (Jac+Gow) 0.94380++**
Gower (Gow) and Joint (Jac+Gow) 0.35516++**
*,**p < 0.05 and 0.01, respectively (t-test).+,++p < 0.05 and p, < 0.01,
re-spectively (Mantel test with 1000 simulations). Gow: dissimilarity matrix obtained with Gower’s method; Jac: dissimilarity matrix obtained with Jaccard’s dissimilarity coefficient.
Table 6- Results of Tocher’s cluster analysis based on a summed Gower and Jaccard dissimilarity matrix. Indistinguishable accessions were grouped in letter coded group profiles.
Group Number of accessions Accessions
A 52 2, 4-9, 11, 13, 15, 19, 20-24, 26, 28, 31-33, 40, 41, 44-46, 48-51, 53, 55, 56, 58, 61-64, 66, 69, 73, 77, 78, 80, 81, 84, 89, 92, 94, 95, 111, 113
B 19 12, 57, 65, 82, 83, 86, 87, 97, 100, 102-107, 110, 115- 117
C 13 3, 34, 42, 43, 67, 68, 72, 74, 88, 90, 91, 93, 96
D 5 17, 18, 25, 37, 39
E 4 36, 38, 54, 60
F 3 10, 16, 59
G 3 71, 79, 108
H 3 85, 98, 101
I 3 35, 75, 112
J 2 47, 70
K 2 29, 109
L 2 30, 76
M 1 27
N 1 1
O 1 99
P 1 52
Q 1 14
makeJatrophaa truly viable biofuel crop (Durãeset al.,
2011; Laviolaet al., 2012a,b; Rochaet al., 2012).
The extensive list of phenotypic traits evaluated en-sured that the phenotypic diversity data generated and, con-sequently, the results of this study, have a direct, fast application in the breeding program [see Laviola et al.
(2012a,b) for more information regarding the genetic pa-rameters and potential of this population for breeding pur-poses]. The RAPD and SSR markers used in this study provided a robust platform for an initial assessment of physic nut molecular diversity and allowed us to be confi-dent about the conclusions reached [see Rosado et al.
(2010) for information regarding marker polymorphism, SSR allele frequencies, RAPD reproducibility, band infor-mativeness and RAPD primer resolving power].
Physic nut genetic diversity was low based on both molecular and phenotypic data. The average dissimilarity among the 117 genotypes was 0.31 and 0.19 based on mo-lecular and phenotypic data, respectively. These values agree with those previously reported for the most accessi-ble physic nut germplasm worldwide (Ram et al., 2008;
Sunet al., 2008; Kumaret al., 2009; Pamidimarri et al.,
2009; Subramanyamet al., 2009; Rosadoet al., 2010; Sunil et al., 2011). The average genetic dissimilarity estimated
among the 117 accessions was also low when compared to another preferentially allogamous and closely related Euphorbiaceae species (Asante and Offei, 2003; Colombo
et al., 2000). Compared to the levels of genetic diversity
found in 307 plant studies surveyed with molecular
mark-ers (Nybom, 2004), the genetic divmark-ersity in the germplasm of the cultivated Brazilian physic nut is limited. According to Rosadoet al. (2010) the limited genetic diversity and
considerable extent of duplications found in this germplasm collection despite its widespread origin and large size most likely reflects a common ancestry, drift and intensive selection of the currently cultivated material since its introduction into Brazil. Rosadoet al.(2010) also
sug-gested the occurrence of extensive homozygosity in the germplasm of cultivatedJ. curcas, despite its allogamous
habit (Divakaraet al., 2010). Other recent reports that have
sampled diversity using different molecular markers have reached similar conclusions regarding the limited variation in the most accessible germplasm resources ofJ. curcasin
various countries (Kumaret al., 2009; Pamidimarriet al.,
2009; Subramanyamet al., 2009).
Comparison of the genetic dissimilarity determined here based on molecular markers with the data provided by Rosadoet al.(2010) revealed a slight increase in the
corre-sponding value (from 0.11 to 0.31). This may be related to the set of accessions used. Whereas Rosadoet al.(2010)
analyzed 192 accessions our analysis was based on a set of 117 accessions, for which we had good quality phenotypic data; the remaining 75 accessions were all related, [accord-ing to Rosadoet al.(2010); data not shown]. Consequently,
our optimized set of physic nut accessions consisted of the most diverse collection of Brazilian genotypes. This obser-vation indicates that the germplasm collection can be opti-mized by maintaining only a set of the most diverse genotypes.
The limited genetic diversity and considerable homozygosity found in the Brazilian germplasm collection contrasted with previous reports of phenotypic variability (Laviolaet al., 2010, 2012a,b; Rochaet al., 2012). In this
regard, we have previously unequivocally demonstrated the breeding potential of this population. Laviola et al.
(2010) first described the genetic parameters for the traits used here to assess the phenotypic diversity of this germplasm. Based on the existence and magnitude of the additive genetic variance we considered that this popula-tion was adequate for selecpopula-tion purposes. Laviola et al.
(2012b) latter re-estimated the genetic parameters using new data and confirmed the existence of genetic variability for traits such as grain yield. Laviolaet al. (2012a) and
Bheringet al.(2012, 2013) later demonstrated that the
ex-isting genetic variability could support high genetic gains, regardless of the selection strategy used.
Based on these findings, it is clear that there is some discordance between the data corresponding to molecular variability and those related to the variability available for breeding purposes (phenotypic variability). We anticipated (Laviolaet al., 2012b) that this disparity could arise from
the fact that neutral molecular markers, such as RAPD or SSR, commonly used in molecular diversity studies, may be located in non-coding regions of the genome (Collardet
al., 2005) and therefore be of limited use in predicting the
phenotypic diversity of individuals, especially in complex traits such as yield.
As shown here, the molecular markers used to assess molecular diversity indeed do not sample the same geno-mic regions that are involved in the genetic control of phe-notypes. The correlation between the genetic dissimilarity matrices obtained using molecular data and phenotypic data was very low. If the markers were sampling the genes responsible for the phenotypic expression of the traits eval-uated then a high correlation between the dissimilarity ma-trices would be expected. Many studies have found weak relationships between genetic distances estimated from molecular data and genetic distances estimated from mor-phological data (Lewontin, 1984; Reed and Frankham, 2001; Koehler-Santoset al., 2003; Martinset al., 2011).
For instance, Sunilet al.(2011) detected such a weak
rela-tionship in aJatrophagermplasm in India. In their study,
the accessions identified as the most diverse based on the analysis of eight phenotypic traits (quantitative traits) were not corroborated as diverse by molecular analysis. Simi-larly, the accessions that were detected as outliers in our molecular analysis were also not unique based on pheno-typic data. Hamzaet al.(2011), in a study of the genetic
di-versity of date palm (Phoenix dactyliferaL.), also did not
detect significant correlation between the genetic distances estimated based on morphological data and genetic dis-tances estimated based on molecular data in which SSR markers were instead of RAPD. In both cases, the natural and human selective forces acting on molecular variation apparently differed from those acting on morphological traits. A further consideration is that morphological traits are heavily affected by the environment when they are ex-pressed, whereas molecular markers are not subject to such variation and their variation is based directly on DNA se-quence variation (Collardet al., 2005).
Together, these findings indicate that arbitrary mo-lecular markers such as RAPD and anonymous markers such as SSR are not efficient in capturing the polymor-phism that results in phenotypic variation in physic nuts. This scenario could change if, instead of a small battery of RAPD markers and anonymous SSR, a battery encompass-ing thousands of sencompass-ingle nucleotide polymorphisms (SNPs) densely covering the entire genome (and possibly every predicted gene-model) and EST-derived SSR are used. In this regard, some reports have indicated that when an ade-quate set of molecular markers is used to assess the genetic diversity of germplasm collections, the estimated molecu-lar genetic distances can be successfully correlated with phenotypic variation (Sestiliet al., 2011). Since we have
al-ready developed a large number of SNPs for Jatropha
(Silva-Junioret al., 2011) and in view of the availability of
genomic resources (EST sequences generated using Illumina’s GA IIx) that could be used to design primers to amplify EST-derived SSR (primer design is underway), a
more detailed study of molecular diversity and of its rela-tionship with phenotypic variation is within the reach in the near future.
By analyzing phenotypic and molecular data to-gether, the average dissimilarity among genotypes in-creased by 156% and 64% with respect to the original mean phenotypic and molecular dissimilarities. This occurred ba-sically because non-overlapping information was com-bined into one data set. By combining phenotypic and molecular data the sampling intensity of the genetic diver-sity was markedly increased; a similar trend was described by Bosettiet al.(2011) and Martinset al.(2011).
Our results indicate that physic nut variability in Bra-zil is indeed limited (more than 50% of the average similar-ity), but not as much as previously thought. The slight change in the sampling intensity also affected the clustering of genotypes, and indicated that the joint analysis of pheno-typic and molecular data was effective in capturing most existing genetic variability. Considering Tocher’s cluster-ing based on the Gower and Jaccard dissimilarity matrix, respectively, joint analysis provided an increase of nearly 29% and 6% in the number of groups. Joint analysis also decreased the genotype concentration in a single group and was effective in discriminating among genotypes. Geno-types that were considered to be most diverse based solely on phenotypic or molecular data were now grouped to-gether with other genotypes. The opposite also occurred,
i.e., some genotypes that could not be correctly
discrimi-nated based solely on phenotypic or molecular data were now placed in single accession groups.
These associations completely changed the picture regarding the genetic diversity of physic nuts in Brazil. For a species that is only now starting to be improved based on systematic methods, the clear definition of sets of diverse genotypes is an extremely important finding as it can be used to guide future crosses and breeding strategies (Cruz
et al., 2011; Bheringet al., 2012; Laviolaet al., 2012b;
Bheringet al., 2013). However, considering that the
Brazil-ian physic nut germplasm collection forms the basis of the breeding program for the species, it is important not only to identify the existing genetic diversity, but also to use the genetic diversity data to establish some guidelines. The finding that genetic dissimilarity among physic nut geno-types is indeed limited reinforces the need of adding more diversity to the germplasm bank to ensure long-term use of the germplasm in breeding programs. This initiative would be ideally performed by collecting new samples from the center of origin/diversity of the species, as suggested by Rosadoet al.(2010) and Laviolaet al. (2012b) in Brazil
and other countries (Divakaraet al., 2010).
to successfully perform a joint genetic diversity analysis, (3) the combination of phenotypic and molecular diversity matrices increases sampling of the physic nut genetic sity, (4) joint analysis of phenotypic and molecular diver-sity reveals that physic nut variability in Brazil is indeed limited, but not as much as previously thought, and (5) ad-ditional collections are urgently needed to enhance the germplasm representativeness and usefulness in terms of species improvement.
Acknowledgments
We thank the Embrapa Agroenergy support staff for their assistance during the experiments, as well as our stu-dents, research collaborators and breeders for their constant scientific input and discussions. We also thank the anony-mous reviewers for their detailed analyses and helpful com-ments on the manuscript. This work was supported by the Brazilian Ministry of Science, Technology and Innovation (MCTI) through a FINEP grant (BRJATROPHA). CDC was supported by a research fellowship from the Brazilian National Research Council (CNPq).
References
Asante IK and Offei SK (2003) RAPD-based genetic diversity study of fifty cassava (Manihot esculenta Crantz)
geno-types. Euphytica 131:113-119.
Berchmans HJ and Hirata S (2008) Biodiesel production from crudeJatropha curcasL. seed oil with a high content of free
fatty acids. Bioresource Technol 99:1716-1721.
Bhering LL, Laviola BG, Sanchez CFB, Salgado CC, Rosado TB and Alves AA (2012) Prediction of genetic gains in
Jatropha using selection indexes. Pesqui Agropecu Bras
47:402-408.
Bhering LL, Sanchez CFB, Ortega D, Laviola BG, Alves AA, Rosado TB and Cruz CD (2013) Differential response of
Jatrophagenotypes to different selection methods indicates that combined selection is more suited than other methods for rapid improvement of the species. Ind Crop Prod 41:260-265.
Bosetti F, Zucchi MI and Pinheiro JB (2011) Molecular and mor-phological diversity in Japanese rice germplasm. Plant Genet Resourc Charact Util 9:229-232.
Brondani RPV and Grattapaglia D (2001) Cost-effective method to synthesize a fluorescent internal DNA standard for auto-mated fragment sizing. Biotechniques 31:793-800. Collard BCY, Jahufer MZZ, Brouwer JB and Pang ECK (2005)
An introduction to markers, quantitative trait loci (QTL) mapping and marker-assisted selection for crop improve-ment: The basic concepts. Euphytica 142:169-196. Colombo C, Second G and Charrier A (2000) Diversity within
American cassava germ plasm based on RAPD markers. Genet Mol Biol 23:189-199.
Cruz CD (2009) Genes: A software for genetics analysis. Univer-sidade Federal de Viçosa, Viçosa, MG.
Cruz CD, Ferreira FM and Pessoni LA (2011) Biometria Aplicada ao Estudo da Diversidade Genética, vol. 1. Editora UFV, Viçosa, 620 pp.
Dias LAS, Leme LP, Laviola BG, Pallini Filho A, Pereira OL, Carvalho M, Manfio CE, Santos AS, Sousa LCA, Oliveira TS,et al.(2007) Cultivo de Pinhão Manso (Jatropha curcas
L.) para Produção de Óleo Combustível. Universidade Fed-eral de Viçosa, Viçosa, 40 pp.
Divakara BN, Upadhyaya HD, Wani SP and Laxmipathi Gowda CL (2010) Biology and genetic improvement of Jatropha curcasL.: A review. Appl Energy 87:732-742.
Drumond MA, Santos CAF, Oliveira VR, Martins JC, Anjos JB and Evangelista MRV (2010) Agronomic performance of different genotypes of physic nut in the semi-arid zone of Pernambuco state. Ciênc Rural 40:44-57.
Durães FMO, Laviola BG and Alves AA (2011) Potential and challenges in making physic nut (Jatropha curcasL.) a
via-ble biofuel crop: The Brazilian perspective. CAB Reviews: Perspectives in Agriculture, Veterinary Science, Nutrition and Natural Resources 6:43.
Ginwal HS, Phartyal SS, Rawat PS and Srivastava RL (2005) Seed source variation in morphology, germination and seed-ling growth ofJatropha curcasLinn. in central India. Silvae
Genet 54:76-80.
Gower JC (1971) A general coefficient of similarity and some of its properties. Biometrics 27:857-871.
Grattapaglia D and Sederoff R (1994) Genetic-linkage maps of
Eucalyptus grandis and Eucalyptus urophylla using a
pseudo-testcross - Mapping strategy and rapd markers. Ge-netics 137:1121-1137.
Gurgel FD, Laviola BG, da Silva DM, Kobayashi AK and Rosado TB (2011) Phenology and biometry of physic nut in the Bra-zilian savannah. Cienc Agrotec 35:1122-1131.
Hamza H, Elbekkay M, Ben Abederrahim MA and Ali AF (2011) Molecular and morphological analyses of date palm ( Phoe-nix dactyliferaL.) subpopulations in southern Tunisia. Span
J Agric Res 9:484-493.
Jaccard P (1901) Étude comparative de la distribution florale dans une portion des Alpes et des Jura. Bull Soc Vaud Sci Nat 37:547-579 [In French].
Koehler-Santos P, Dornelles ALC and de Freitas LB (2003) Char-acterization of mandarin citrus germplasm from southern Brazil by morphological and molecular analyses. Pesqui Agropecu Bras 38:797-806.
Kumar RV, Tripathi YK, Shukla P, Ahlawat SP and Gupta VK (2009) Genetic diversity and relationships among germ-plasm of Jatropha curcasL. revealed by RAPDs. Trees-Struct Funct 23:1075-1079.
Laviola BG, Rosado TB, Bhering LL, Kobayashi AK and Re-sende MDV (2010) Genetic parameters and variability in physic nut accessions during early developmental stages. Pesqui Agropecu Bras 45:1117-1123.
Laviola BG, Alves AA, Gurgel FD, Rosado TB, Costa RD, Rocha RB and Bhering LL (2012a) Estimate of genetic parameters and predicted genetic gains with early selection of physic nut families. Cienc Agrotec 36:163-170.
Laviola BG, Alves AA, Gurgel FD, Rosado TB, Rocha RB and Albrecht JC (2012b) Estimates of genetic parameters for physic nut traits based in the germplasm two years evalua-tion. Ciência Rural 42:429-435.
Manly BFJ (1997) Randomization, Bootstrap and Monte Carlo Methods in Biology. Chapman & Hall, London, 399 pp. Martins FA, Carneiro PCS, da Silva DJH, Cruz CD and Carneiro
JED (2011) Integration of data in studies of genetic diversity of tomato. Pesqui Agropecu Bras 46:1496-1502.
Modi MK, Reddy JRC, Rao BVSK and Prasad RBN (2007) Lipase-mediated conversion of vegetable oils into biodiesel using ethyl acetate as acyl acceptor. Bioresource Technol 98:1260-1264.
Nybom H (2004) Comparison of different nuclear DNA markers for estimating intraspecific genetic diversity in plants. Mol Ecol 13:1143-1155.
Pamidimarri DVNS, Singh S, Mastan SG, Patel J and Reddy MP (2009) Molecular characterization and identification of markers for toxic and non-toxic varieties ofJatropha curcas
L. using RAPD, AFLP and SSR markers. Mol Biol Rep 36:1357-1364.
Ram SG, Parthiban KT, Kumar RS, Thiruvengadam V and Para-mathma M (2008) Genetic diversity amongJatropha spe-cies as revealed by RAPD markers. Genet Resour Crop Ev 55:803-809.
Reed DH and Frankham R (2001) How closely correlated are mo-lecular and quantitative measures of genetic variation? A meta-analysis. Evolution 55:1095-1103.
Reis AMM and Grattapaglia D (2004) RAPD variation in a germplasm collection of Myracrodruon urundeuva
(Anacardiaceae), an endangered tropical tree: Recommen-dations for conservation. Genet Resour Crop Evol 51:529-538.
Rocha RB, Ramalho AR, Teixeira AL, Laviola BG, da Silva FCG and Militao JSLT (2012) Selection efficiency for increasing physic nut oil content. Pesqui Agropecu Bras 47:44-50.
Rosado TB, Laviola BG, Faria DA, Pappas MR, Bhering LL, Quirino B and Grattapaglia D (2010) Molecular markers re-veal limited genetic diversity in a large germplasm collec-tion of the biofuel cropJatropha curcasL. in Brazil. Crop Sci 50:2372-2382.
Sestili S, Giardini A and Ficcadenti N (2011) Genetic diversity among Italian melon inodorus (Cucumis melo L.)
germ-plasm revealed by ISSR analysis and agronomic traits. Plant Genet Resourc Charact Util 9:214-217.
Silva-Junior OB, Rosado TB, Laviola BG, Pappas MR, Pappas GJ and Grattapaglia D (2011) Genome-wide SNP discovery from a pooled sample of accessions of the biofuel plant
Jatropha curcas based on whole-transcriptome Illumina resequencing. BMC Proc 5:P57.
Subramanyam K, Muralidhararao D and Devanna N (2009) Ge-netic diversity assessment of wild and cultivated varieties of
Jatropha curcas (L.) in India by RAPD analysis. Afr J
Biotechnol 8:1900-1910.
Sun QB, Li LF, Li Y, Wu GJ and Ge XJ (2008) SSR and AFLP markers reveal low genetic diversity in the biofuel plant
Jatropha curcasin China. Crop Sci 48:1865-1871. Sunil N, Sujatha M, Kumar V, Vanaja M, Basha SD and
Vara-prasad KS (2011) Correlating the phenotypic and molecular diversity inJatropha curcasL. Biomass Bioenerg
35:1085-1096.
Associate Editor: Marcio C. Silva Filho