Nonlinear models to describe height and diameter of sugarcane RB92579
variety
1Modelos não lineares na descrição da estatura e diâmetro da cana-de-açúcar variedade
RB92579
Sérgio Alberto Jane2, Felipe Augusto Fernandes3, Joel Augusto Muniz4* and Tales Jesus Fernandes4
ABSTRACT - Brazil is the world’s largest sugarcane producer (Saccharum spp.), followed by India and China. In 2019,
Brazil produced 642.7 million tons of sugarcane, having collected 1.44 billion and 983.52 million dollars from sugar and ethanol exports, respectively. For crop management, it is important to monitor plant growth, duration of growth phases and point of physiological maturation. The aim of this study was to evaluate the fit of nonlinear Logistic, Gompertz, Brody and von Bertalanffy models to the height and diameter growth of ratoon cane stalk RB92579 variety, considering age in days. The parameters of models were estimated using R software routines, applying the least squares method and the iterative Gauss-Newton process. The adjustment of models was compared using the following evaluators: determination coefficient (R2), residual standard deviation (RSD) and corrected Akaike information criterion (AICc). In all models, parameters were
significant by the t test at 1% level, except for the Brody model. When using the Shapiro-Wilk, Durbin-Watson and Breusch-Pagan tests, it was found that residues were normal, homoscedastic and independent at 1% significance level. All models fitted well to data, except for the Brody model for stalk height. Based on results, the Gompertz and Logistic models presented higher R2values and lower RSD and AICc values; thus, it could be concluded that these models are suitable to describe the height and
diameter of sugarcane RB92579 cultivar, respectively.
Key words: Growth curves. Logistic. Gompertz.
RESUMO - O Brasil é o maior produtor mundial de cana-de-açúcar (Saccharum spp.), seguido pela Índia e China. Em 2019
Brasil produziu 642,7 milhões de toneladas de cana, tendo arrecadado 1.44 bilhões e 983,52 milhões de dólares com exportação de açúcar e etanol, respectivamente. No manejo da cultura é importante monitorar o crescimento das plantas, a duração das fases de crescimento e o ponto de maturação fisiológica. O objetivo deste estudo foi avaliar o ajuste dos modelos não lineares Logistico, Gompertz, Brody e von Bertalanffy ao crescimento dos colmos da cana soca variedade RB92579, em estatura e diâmetro, considerando a idade em dias. Os parâmetro dos modelos foram estimados por meio de rotinas do software R, aplicando o método de mínimos quadadrados e o processo iterativo de Gauss-Newton. O ajuste dos modelos foi comparado utilizando os avaliadores: coeficiente de determinação (R2), desvio padrão residual (DPR) e critério de Akaike corrigido (AICc).
Em todos os modelos, os modelos, parâmetros foram significativos pelo test t ao nível de 1%, exceto o modelo Brody. Ao realizar os testes Shapiro-Wilk, Durbin-Watson e Breusch-Pagan, verificou-se que os resíduos foram normais, homocedásticos e independentes, ao nível de 1% de significância. Todos os modelos ajustaram-se bem aos dados, exceto o modelo Brody para estatura dos colmos. Com base nos resultados, os modelos Gompertz e Logístico apresentaram maiores valores de R2 e
menores DPR e AICc, desta forma conclui-se que estes modelos são adequados para descrever a altura e o diâmetro da cultivar RB92579, respectivamente.
Palavras-chave: Curvas de crescimento. Logístico. Gompertz.
DOI: 10.5935/1806-6690.20200062
Editor do artigo: Professor Bruno França da Trindade Lessa - bruno.ftlessa@univasf.edu.br *Author for correspondence
Received for publication in 20/03/2019; approved in 16/06/2020
1Trabalho realizado durante a frequência do Mestrado em Estatística e Experimentação Agropecuária por parte do primeiro autor, no Departamento de
Estatística, Universidade Federal de Lavras
2Departamento de Produção e Proteção Vegetal, Faculdade de Ciências Agrárias, Universidade Lúrio, Niassa - Moçambique, serztjane@gmail.com
(ORCID 0000-0001-9666-8117)
3Doutorando em Estatística e Experimentação Agropecuária, Departamento de Estatística/DES, Universidade Federal de Lavras/UFLA, Lavras-MG,
Brasil, fernandesfelipest@gmail.com (ORCID 0000-0003-2552-3433)
4Departamento de Estatística/DES, Universidade Federal de Lavras/UFLA, Lavras-MG, Brasil, joamuniz@ufla.br (ORCID 0000-0002-1069-4136),
INTRODUÇAO
Sugarcane (Saccharumspp) is originally from New Guinea and produced in tropical and subtropical countries, and Brazil is the world’s largest producer, followed by India and China (MIRAJKAR et al., 2019). This crop plays an important role for Brazilian agriculture, as it is one of the largest crops, occupying 8.4 million hectares. It is the main source of sugar and ethanol, also producing Cachaça and electricity. In 2019, production amounted to 642.7 million tons (t), which accounted for US$ 1.44 billion in sugar and US$ 983.52 million in ethanol exports (COMPANHIA NACIONAL DE ABASTECIMENTO, 2020).
Sugarcane is a crop that has three growth stages, from bud germination to tillering, vegetative growth and maturation. Plant growth is positively or negatively affected by several factors, mainly water stress, temperature and light, which directly affect morphological variables, mainly stalk diameter and height. Therefore, due to these and other factors such as crop aging and low renewal rate, the estimates from the National Supply Company (2020) for the 2020/21 harvest indicate reduction of 1.9% and 10.3% in the production of sugarcane and ethanol, respectively.
To recover the levels of sugarcane production, producers must adopt good cultural management practices, and the study of sugarcane growth patterns helps identifying the duration of phenological phases, the inflection point where plants reach physiological maturation, and from which, the crop needs water stress and high temperatures to ensure greater sucrose accumulation (JANE et al., 2020).
The study of the growth patterns of agricultural crops is usually conducted based on regression models that help identifying morphological differences of plants, to quantify production and to adapt management with phenological phases (FERNÁNDEZ-CHUAIREY et al., 2019). In general, linear models are more widely used; however, nonlinear models have an advantage because they are more parsimonious, as they present better adjustments with fewer parameters, and may also present practical or biological interpretation (ARCHONTOULIS; MIGUEZ, 2015; FERNANDES et al., 2015).
Several authors have studied the adjustment of nonlinear models in the growth of sugarcane plants (BATISTA et al., 2013; COSTA et al., 2011; JANE et al., 2020; MAMET; GALWEY, 1999; MCMARTIN, 1979; OLIVEIRA et al., 2010) mainly for stalk height. Nonlinear Logistic and Gompertz models are the most commonly found in studies on sugarcane growth; therefore, there is need for further studies mainly to compare various models
including other variables and decide which best describe crop growth, in addition to determining growth rates.
Thus, this work aims to evaluate the fit of nonlinear Logistic, Gompertz, Brody and von Bertalanffy models to describe the stalk height and diameter growth of sugarcane RB92579 variety.
MATERIAL AND METHODS
Data used in the study refer to the average stalk height (ASH) and average stalk diameter (ASD) of ratoon
cane (2ndcycle), RB92579 variety, both in centimeters,
being extracted from Silva et al. (2012). The experiment was carried out in a commercial plot with dimensions of
30 x 30 m (900 m2) in the São Francisco River valley,
municipality of Juazeiro, Bahia, during the 2007/2008 harvest.
Cultivation was carried out in soil belonging to the class of Vertisols, limestone, from dark olive to dark yellowish color, developed from the caatinga limestone, with CR horizon (soil / rock transition). Based on the soil
type, 157.5 kg ha-1 of commercial fertilizer based on organic
nitrogen (N, 45%) and 0.5 L ha-1of foliar organomineral
fertilizer (N, 3%; P2O5, 17%; Organic matter, 15%) were
applied, and 1L ha-1 of herbicides with active ingredients
2,4D Amine and glyphosate-isopropylammonium were applied for weed control.
Planting was carried out with spacing of 1.5 m between rows; plants were irrigated using the superficial system by grooves, in which water is conducted in windowed tubes. The frequency of application was determined based on the soil water content, monitored three times a week using a FDR (Frequency Domain Reflectometer) probe and the reference evapotranspiration values were estimated using the Penman Monteith method, parameterized in the FAO bulletin 56.
Twelve ASH measurements were made from the base to the +1 leaf (first leaf developed from top to bottom with visible ligula), and ASD in the third internode of tillers with the aid of measuring tape and caliper, respectively, in 15 tillers for each experimental plot subarea, from 70 to 381 days after cutting (DAC).
Nonlinear Logistic, Gompertz, Brody and von Bertalanffy models were adjusted for height and stalk diameter, as they are the most used in literature to describe the growth of living beings, especially in agriculture. According to Ribeiro et al. (2018a), these models are respectively represented by the following expressions: (1)
(2) (3) (4)
where Yi represents the observed EMC and DMC values
in i = 1,...,12 observations as a function of the independent
variable time (DAC), and xiis the i-th measurement time
of the response variable or independent variable. Models presented three parameters: α representing the maximum horizontal asymptote, that is, maximum EMC and DMC to be reached by plants, k is the growth rate (the higher the
k, the less time plants take to reach α) and β represents the
abscissa of the inflection point, or a value associated with it depending on the model and parameterization, from which
growth decelerates, while εi corresponds to the random
error, which is assumed to be independent and identically distributed following a normal distribution with zero mean
and constant variance, that is, ε ~ N(0,σ2) (FERNANDES,
2017; MUIANGA et al., 2016; MUNIZ; NASCIMENTO; PRADO et al., 2020; SILVA et al., 2020).
According to Ribeiro et al. (2018a), the four models are sigmoid; however, the Brody model has a different characteristic from the others, as it presents inflection point before the first observed value. In the Logistic model, the inflection point occurs halfway
through the asymptote Yi = α/2 = 0.5α, in the Gompertz
model, Yi= α/ε where ε = 2.7182..., that is Yi≈ 0.37α,
and in the von Bertalanffy model, Yi = 8α/27 ≈ 0.30α,
indicating that the inflection point estimated by the von Bertalanffy, Gompertz and Logistics models occurs in 30%, 37% and 50% of the horizontal asymptote, respectively.
The estimation of model parameters was based on the least squares method, using the iterative Gauss-Newton process, as can be seen in the works by Bem et al. (2020), Carneiro et al. (2014), Prado et al. (2013), Ribeiro et al. (2018b), Savian and Muniz (2007) and Sousa et al. (2014). The significance of parameters was verified by the t test at level of 1%, testing the following hypothesis: estimates are equal to zero (θi = 0), that is, they do not contribute to the adjusted model. Residual analysis was carried out using the Shapiro-Wilk, Breusch-Pagan and Durbin-Watson tests, which are the most used to verify assumptions of normality, homogeneity of variances and independence of residues.
To select the model that best described ASH and ASD, three fit quality evaluators were used, determination
coefficient (R2), residual standard deviation (RSD) and
the corrected Akaike information criterion (AICc) given by the expressions presented below:
(5)
(6) (7) where SSR is the sum of the squared residuals; SST is the total square sum; n is the number of observations and p is the number of parameters of the adjusted models. The best
model is the one with the highest R2 value and the lowest
RSD and AICc values.
All analyses were obtained using specific routines and packages (nls, nlme, car, lmtest, qpcR, Rsq and
AICcmodavg) from the R software (R CORE TEAM,
2018).
RESULT AND DISCUSSION
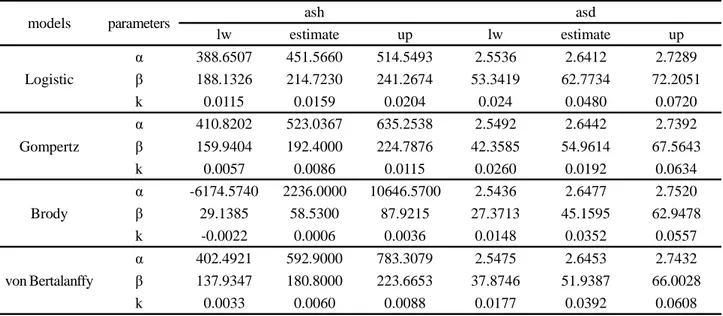
The estimates of parameters and respective 95% confidence intervals of Logistical, Gompertz, Brody and von Bertalanffy models adjusted for height and stalk diameter variables are shown in Table 1. All estimates were significant by the t test (p<0.01), except for the Brody model, which obtained non-significant α and k parameters. Thus, the significant parameters contribute to the adjusted models, since their p-values indicate the rejection of the null hypothesis. The Logistic and Gompertz models presented lower amplitudes of confidence intervals of parameters for both variables (height and diameter), while the Brody model presented confidence interval not different from zero for α and k parameters, indicating that this model is not suitable to describe the ASH growth curve.
Analyzing the horizontal asymptote α in Table 1, it was observed that the Logistic model had the lowest stalk height value, 452 cm, with growth index of 0.0159
cm day-1, similar to those observed by Silva et al. (2012),
followed by Gompertz and von Bertalanffy models, with averages of 523.04 cm and 592.90 cm. Estimates α of the Logistic model are within the range observed by Capone
et al. (2011), which is from 420.00 to 523.00 cm, when
evaluating the growth of 15 ratoon cane varieties in the state of Tocantins, but different from Gompertz and Brody models.
For diameter, the estimated values of asymptote α were very close in the four models. The lowest value was for the Logistic model, which is 2.64 cm, and the highest for the Brody model, which is 2.65 cm. These values are close to that observed by Oliveira et al. (2010), which is 2.70 cm, but differ from value observed by Oliveira, Braga and Walker (2015), about 2.18 cm, both evaluating the diameter of sugarcane RB92579 variety.
models parameters ash asd lw estimate up lw estimate up Logistic α 388.6507 451.5660 514.5493 2.5536 2.6412 2.7289 β 188.1326 214.7230 241.2674 53.3419 62.7734 72.2051 k 0.0115 0.0159 0.0204 0.024 0.0480 0.0720 Gompertz α 410.8202 523.0367 635.2538 2.5492 2.6442 2.7392 β 159.9404 192.4000 224.7876 42.3585 54.9614 67.5643 k 0.0057 0.0086 0.0115 0.0260 0.0192 0.0634 Brody α -6174.5740 2236.0000 10646.5700 2.5436 2.6477 2.7520 β 29.1385 58.5300 87.9215 27.3713 45.1595 62.9478 k -0.0022 0.0006 0.0036 0.0148 0.0352 0.0557 von Bertalanffy α 402.4921 592.9000 783.3079 2.5475 2.6453 2.7432 β 137.9347 180.8000 223.6653 37.8746 51.9387 66.0028 k 0.0033 0.0060 0.0088 0.0177 0.0392 0.0608
Table 1 - Estimates of parameters and lower (Lw) and upper (Up) limits of confidence intervals for the fit of Logistic, Gompertz, Brody
and von Bertalanffy models to data of average stalk height (ASH) and average stalk diameter (ASD) of ratoon cane RB92579 variety
Differences from results observed in the studies by Oliveira et al. (2010), and Oliveira, Braga and Walker (2015) are due to the fact that they evaluated the growth of ratoon cane in different growing seasons, second and third cycles, respectively. The growth of sugarcane stalks decreases with increasing production cycles, which can affect final productivity in each cut.
Table 2 shows the results of the residual analysis of models, indicating that the normality of residues, homogeneity of variances and independence of residues verified since the Shapiro-Wilk (SW), Breusch-Pagan (BP) and Durbin-Watson (DW) tests were not significant (p-value > 0.01), that is, the probability of not rejecting the null hypothesis of SW, BP and DW tests was greater than 1%. Thus, inferences to be made with the results of parameter estimates are valid. Similar results were
observed by Jane et al. (2020), who described the stalk height growth curves of sugarcane RB92579 variety using nonlinear Logistic and Gompertz models.
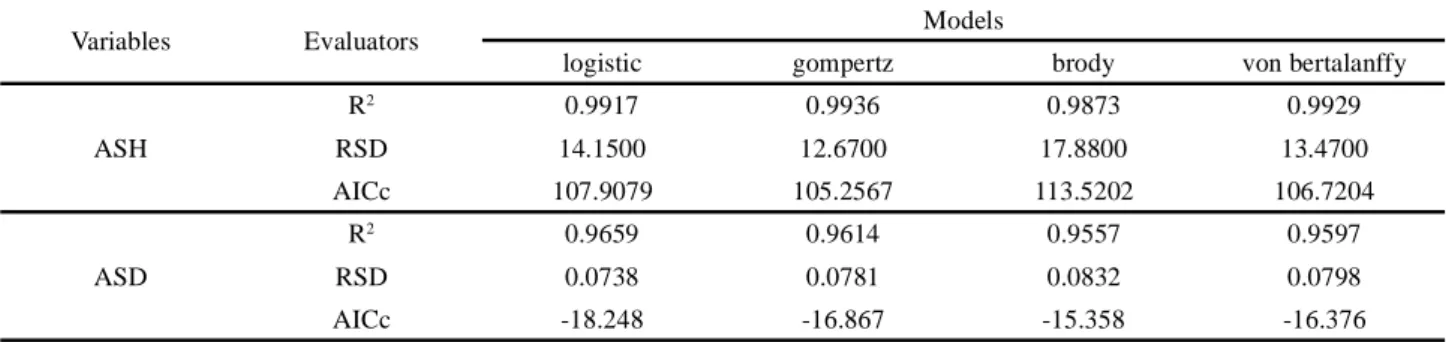
As all assumptions of the residual analysis were observed, the quality of the fit of models was evaluated.
Based on R2, RSD and AICc evaluators, the four models
showed good adjustments for the average stalk height and diameter (Table 3). For height, the Gompertz model
showed higher R2, above 0.99, close to that observed by
Batista et al. (2013), working with the same variety. The Gompertz model also showed lower RSD and AICc values, thus indicating that it is the model that best describes the height growth of sugarcane RB92579 variety. For diameter, the Logistic model was the one that obtained the
best fit, with R2 of approximately 0.97 and lower RSD and
AICc values.
variables tests models
logistic gompertz brody von bertalanffy
ASH SW 0.9127 0.2143 0.4454 0.2025 BP 0.0742 0.6242 0.8195 0.9439 DW 0.4440 0.9740 0.1000 0.7600 ASD SW 0.3795 0.5951 0.7463 0.6409 BP 0.5526 0.3599 0.2396 0.3122 DW 0.5980 0.7020 0.8160 0.6740
Table 2 - P-values of the statistics of Shapiro-Wilk (SW), Breusch-Pagan (BP) and Durbin-Watson (DW) tests for the analysis of
residuals of the Logistic, Gompertz, Brody and von Bertalanffy models for the average stalk height (ASH) and average stalk diameter (ASD) of sugarcane RB92579 variety
Variables Evaluators Models
logistic gompertz brody von bertalanffy
ASH R2 0.9917 0.9936 0.9873 0.9929 RSD 14.1500 12.6700 17.8800 13.4700 AICc 107.9079 105.2567 113.5202 106.7204 ASD R2 0.9659 0.9614 0.9557 0.9597 RSD 0.0738 0.0781 0.0832 0.0798 AICc -18.248 -16.867 -15.358 -16.376
Table 3 - Fit quality evaluators (R2, RSD and AICc) of the Logistic, Gompertz, Brody and von Bertalanffy models for the average stalk
height (ASH) and average stalk diameter (ASD) of sugarcane RB92579 variety
The results in Table 3 corroborate those observed by Jane et al. (2020), who obtained better fit of the Gompertz model when describing the stalk height growth of sugarcane RB92579 variety also in the ratoon cane cycle. Oliveira et al. (2010), obtained the best evaluators of the fit quality for the Logistic model, corroborating results of this study. Varieties that show less stalk height growth generally show greater stalk diameter growth in, leading the plant to reach the inflection point in shorter time. This fact justifies the superiority of the Gompertz model in relation to the Logistic model, since its inflection points occur to 37% and 50% of the upper horizontal asymptote. The graphs of adjustments of Logistic, Gompertz, Brody and von Bertalanffy models for height (cm) and diameter (cm) are shown in Figures 1 and 2 respectively. Both for height and diameter, there is a sigmoid growth pattern, which is a growth characteristic in living beings (ARCHONTOULIS; MIGUEZ, 2015; FERNANDES et al., 2014).
Based on Figures 1 and 2, it is noteworthy that all models adjusted well to stalk height and diameter data. Based on Figure 1, it was observed that for the average stalk height, the asymptote estimates of the Gompertz model were very close to observed values, followed by the Logistic model, while Brody model overestimated this parameter, with value above the normal growth of the crop.
The inflection point of the Gompertz model curve occurred 192 days after cut when stalks reached 523.0367/2.7182 = 192.42 cm. Mamet and Galwey (1999) studied the growth of 64 sugarcane varieties and obtained inflection points ranging from 183 and 213 days. It should be noted that, when it comes to ratoon cane, the inflection point must occur very quickly compared to plant-cane; ratoon cane uses nutrients and water after harvest. Thus, the estimate obtained by the Gompertz model for RB92579 variety is adequate, as it reaches the maximum accelerated growth at the end of the phase of
Figure 1 - Adjustment of the Logistic, Gompertz, Brody and
von Bertalanffy models for average stalk height of ratoon cane RB92579 variety
Figura 2 - Adjustment of the Logistic, Gompertz, Brody and von
Bertalanffy models for the average stalk diameter of ratoon cane RB92579 variety
relation to the observation times. Regarding height, the RB92579 variety developed more rapidly up to 192
days, reaching 1.6548 cm day-1 and, from this day on,
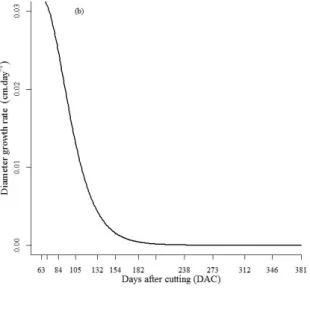
it presented a decrease in growth until it stabilized at the end of the evaluation at 381 DAC. In the diameter analysis, the accelerated growth occurred before the first observation at approximately 63 days, when it
presented growth rate of 0.0317 cm day-1, as shown in
Figure 3.
These results corroborate those obtained by Santos et al. (2009), who observed the highest growth rate of sugarcane between 120 and 240 days, and with Costa et al. (2011), between 90 and 180 days, respectively. Based on the results above, it was observed that the stalk diameter reached the inflection point 1/3 of the height time, given that plants need to gain greater stability even in the bud germination and tillering phase to support the greatest height growth, and of leaves, which occurs in the next phase. Inflection points coincide with the maximum height and diameter growth rates.
most suitable to describe stalk height and diameter, respectively;
2. Based on the Gompertz model, height reached maximum
growth rate at 192 DAC, growing 1.6548 cm day-1,
and its growth stabilized after 380 DAC, while using the Logistic model, the diameter reached the inflection
point at 63 DAC with growth rate of 0.0317 cm day-1,
stabilizing at 180 DAC.
Figure 3 - Growth rate (cm day-1) of stalk height (a) and diameter (b) of Gompertz and Logistic models, respectively, for ratoon cane
RB92579 variety
CONCLUSIONS
1. All models adjusted well to the growth data of ratoon cane RB92579 variety, except for the Brody model, which obtained non-significant parameters in the height analysis. The Gompertz and Logistic
models obtained the highest R2 values and the lowest
RSD and AICc values, indicating that they are the greatest vegetative growth, allowing plants to have longer period of water stress, which is necessary to accumulate greater amount of sucrose.
For diameter, Figure 2 shows that the average estimates of the asymptote in the Logistic model were close to observed values. Growth was accelerated until approximately 180 days, stabilizing from this point until the end of the crop cycle. Based on the Logistic model, the inflection point occurred at 63 days, with average stalk diameter estimated by α/2 = 2.6412/2 = 1.32 cm. These results corroborate those obtained by Oliveira et al. (2010), who observed a rapid increase in stalk diameter with RB92579 variety in plant-cane up to 90 days, with average of 2.70 cm. The slight difference in the inflection points may have been caused by the fact that the plant-cane cycle is longer than that of ratoon cane.
The maximum growth rate values in nonlinear models coincide with the inflection point, and can be obtained by means of the order-1 partial derivative in
ACKNOWLEDGMENTS
To the Mozambican Scholarship Institute (IBE) and the National Council for Scientific and Technological Development (CNPq) for grants awarded to the first and second authors, respectively.
REFERENCES
ARCHONTOULIS, S. V.; MIGUEZ, F. E. Nonlinear regression models and applications in agricultural research. Agronomy
Journal, v. 107, n. 2, p. 786-798, 2015.
BATISTA, E. L. da S. et al. Modelagem do crescimento de cultivares de cana-de-açúcar no período de formação da cultura.
Revista Brasileira de Engenharia Agrícola e Ambiental, v. 17,
n. 10, p. 1080-1087, 2013.
BEM, C. M. de et al. Univariate and multivariate nonlinear models in productive traits of the sunn hemp. Revista Ciência Agronômica, v. 51, n. 1, e20196673, 2020.
CAPONE, A. et al. Avaliação do comportamento de quinze cultivares de cana-de-açúcar na Região Sul do Tocantins. Journal of
Biotechnology and Biodiversity, v. 2, n. 3, p. 72-80, 2011.
CARNEIRO, A. P. S. et al. Identidade de modelos não lineares para comparar curvas de crescimento de bovinos da raça Tabapuã.
Pesquisa Agropecuária Brasileira, v. 49, n. 1, p. 57-62, 2014.
COMPANHIA NACIONAL DE ABASTECIMENTO (BRASIL).
Acompanhamento da safra brasileira: cana-de-açúcar: quarto
levantamento: safra 2019-2020. v. 6, n. 4, 2020.
COSTA, C. T. S. et al. Crescimento e produtividade de quatro variedades de cana-de-açúcar no quarto ciclo de cultivo. Revista
Caatinga, v. 24, n. 3, p. 56-63, 2011.
FERNANDES, T. J. et al. Parametrization effects in nonlinear models to describe growth curves. Acta Scientiarum. Technology, v. 37, n. 4, p. 397-402, 2015.
FERNANDES, T. J. et al. Seleção de modelos não lineares para a descriação das curvas de crescimento do fruto do cafeeiro. Coffee
Science, v. 9, n. 2, p. 207-215, 2014.
FERNÁNDEZ-CHUAIREY, L. et al. Statistical-mathematical modeling in agrarian processes: an application in agricultural engineering. Revista Ciencias Técnicas Agropecuarias, v. 28, n. 2, p. 1-7, 2019.
JANE, S. A. et. al. Adjusting the growth curve of sugarcane varieties using nonlinear models. Ciência Rural, v. 50, n. 3, e20190408, 2020.
MAMET, L. D.; GALWEY N. W. A relationship between stalk elongation and earliness of ripening in sugarcane. Experimental
Agriculture, v. 35, p. 283-291, 1999.
MCMARTIN, A. The logistic curve of plant growth and its application to sugarcane. Proceedings of The South African Sugar
Technologist` Association, v. 53, p. 189-93, 1979.
MIRAJKAR S. J. et al. Sugarcane (Saccharum spp.): breeding and genomics. In: AL-KHAYRI, J. M. et al. Advances in plant
breeding strategies: industrial and food crops. 6. ed. Switzerland:
Springer, 2019. cap. 11, p. 363-406.
MUIANGA, C. A. et al. Descrição da curva de crescimento de frutos do cajueiro por modelos não lineares. Revista Brasileira de
Fruticultura, v. 38, n. 1, p. 22-32, 2016.
MUNIZ, J. A.; NASCIMENTO, M. da S.; FERNANDES, T. J. Nonlinear models for description of cacao fruit growth with assumption violations. Revista Caatinga, v. 30, n. 1, p. 250-257, 2017.
OLIVEIRA, A. R. de; BRAGA, M. B.; WALKER, A. M. Comportamento vegetativo e qualidade tecnológica de cultivares de cana-de-açúcar submetidas ao estresse hídrico em condições Semiáridas do Brasil. Revista Brasileira de Geografia Física, v. 8, p. 525-541, 2015. Número especial (IV SMUD).
OLIVEIRA, E. C. A. de et al. Crescimento e acúmulo de matéria seca em variedades de cana-de-açúcar cultivadas sob irrigação plena. Revista Brasileira de Engenharia Agrícola e Ambiental, v. 14, n. 9, p. 951-960, 2010.
PRADO, T. K. L. et al. Ajuste dos modelos Gompertz e Logístico aos dados de crescimento de frutos de coqueiro anão verde. Ciência
Rural, v. 43, n. 5, p. 803-809, 2013.
PRADO, T. K. L. et al. Study of the growth curve of the internal cavity of fruit dwarf green coconut. Revista Ciência Agronômica, v. 51, n. 3, e20154591, 2020.
R CORE TEAM. R: a language and environment for statistical computing. Vienna, Austria, 2018. Disponível em: https://www.R-project.org/. Acesso em: 2 jul. 2018.
RIBEIRO, T. D. et al. Description of the growth of pequi fruits by nonlinear models. Revista Brasileira de Fruticultura, v. 40, n. 4, e-949, 2018a.
RIBEIRO, T. D. et al. The use of the nonlinear models in the growth of pears of ‘Shinseiki’ cultivar. Ciência Rural, v. 48, n. 1, e20161097, 2018b.
SANTOS, V. R. et al. Growth and yield of sugarcane under different phosphorus sources. Revista Brasileira de Engenharia Agrícola e
Ambiental, v. 13, n. 4, p. 389-396, 2009.
SAVIAN, T. V.; MUNIZ, J. A. A study of in situ degradability: heterogeneity of variances and correlated errors. Scientia Agricola, v. 64, n. 5, p. 548-554, 2007.
SILVA, É. M. da et al. Description of blackberry fruit growth by nonlinear regression models. Revista Brasileira de Fruticultura, v. 42, n. 2, e-177, 2020.
SILVA, T. G. F. da et al. Biometria da parte aérea da cana soca irrigada no Submédio do Vale do São Francisco. Revista Ciência
Agronômica, v. 43, n. 3, p. 500-509, 2012.
SOUSA, I. F. et al. Fitting nonlinear autoregressive models to describe coffee seed germination. Ciência Rural, v. 44, n. 11, p. 2016-2021, 2014.