© 2018 Sociedade Brasileira de Zootecnia ISSN 1806-9290
www.sbz.org.br
R. Bras. Zootec., 47:e20170247, 2018 https://doi.org/10.1590/rbz4720170247
Breeding, genetics, and reproduction
Effect of
STAT1
,
OLR1
,
CSN1S1
,
CSN1S2
, and
DGAT1
genes on milk yield and
composition traits of Holstein breed
Sena Ardicli
1, Bahadir Soyudal
1, Hale Samli
1, Deniz Dincel
1, Faruk Balci
1*1 Uludag University, Faculty of Veterinary Medicine, Department of Genetics, Nilufer, Bursa, Turkey.
ABSTRACT - The objectives of the study were to evaluate allelic frequencies and test the association between STAT1, OLR1, CSN1S1, CSN1S2, and DGAT1 gene polymorphisms and milk production traits including lactation milk yield, 305 days milk yield, days before peak milk production, and peak milk yield. In addition, samples of milk were analysed for fat, protein, lactose, and total solid contents. A total of 168 purebred Holstein-Fresian cows were genotyped using polymerase chain reaction and restriction fragment length polymorphism methods. Statistical analysis was carried out using least square methods of the general linear model procedure. Significant differences were found between genotypes of the CSN1S2 locus in relation to milk protein content. In addition, DGAT1 was significantly associated with peak milk production. These results suggested that CSN1S2 and DGAT1 markers may be evaluated to achieve various commercial goals in dairy cattle production.
Key Words: cattle, dairy cow, milk composition, polymorphism
Received: September 23, 2017
Accepted: May 23, 2018
*Corresponding author: [email protected]
Copyright © 2018 Sociedade Brasileira de Zootecnia. This is an Open Access article distributed under the terms of the Creative Commons Attribution License (http://creativecommons.org/licenses/by/4.0/), which permits unrestricted use, distribution, and reproduction in any medium, provided the original work is properly cited.
Introduction
The trend of improving dairy cattle breeding programs
has gradually changed from traditional phenotypical
selection methods to genotypic selection by utilising
molecular markers. Identifying genes underlying the genetic
variability of selected economically important traits is a
major focus of dairy cattle genomics, and a large number of
candidate genes have been potentially associated with milk
yield and quality (Rychtářová et al., 2014). Candidate genes
related to milk production traits, which are polygenically
inherited, may be found in pathways of fat synthesis and
metabolism. Single nucleotide polymorphisms (SNP)
in the signal transducer and activator of transcription
(
STAT1
), oxidised low-density lipoprotein receptor (
OLR1
),
alpha
S1-casein (
CSN1S1
), alpha
S2-casein (
CSN1S2
), and
diacylglycerol acyltransferase 1 (
DGAT1
) genes have been
shown to affect bovine milk production and composition
traits in different cattle populations (Kucerova et al., 2006;
Khatib et al., 2007; Schennink et al., 2007; Rychtářová
et al., 2014).
STAT1
gene is located on chromosome 2 between 60
and 63 cM interval (Band et al., 2000) and is regulated
during mammary gland development (Khatib et al.,
2009).
STAT1
is associated with improved milk yield,
composition, and production traits (Chu and Zan, 2009;
Khatib et al., 2009; Rychtářová et al., 2014).
OLR1
gene encodes surface receptors of vascular endothelial
cells and degrades the oxidised forms of low-density
lipoproteins (Mehta and Li, 2002; Khatib et al., 2006). The
oxidised lipids are known to impair glucose metabolism
and influence lipid metabolism in liver and mammary
glands (Ringseis et al., 2007; Liao et al., 2008).
OLR1
gene is located in the interval of 106 to 108 cM of bovine
chromosome 5, in which the functional and positional
genes related to fatty acid contents in milk are localised.
Results of previous whole-genome scan studies suggested
OLR1
as a candidate gene affecting milk composition
traits (Khatib et al., 2006).
CSN1S1
and
CSN1S2
genes
belong to the casein (
CN
) gene family, which is situated
on bovine chromosome 6. These genes are relevant in
relation to milk production parameters and milk protein
quality (Kucerova et al., 2006; Ibeagha-Awemu et al.,
2007).
CSN1S1
codes for α
S1-CN; the most frequent alleles
in this gene are B and C, and allele A occurs occasionally
(Boettcher et al., 2004; Kucerova et al., 2006).
CSN1S2
the most frequently observed variant in all breeds, whereas
variants B and C are specific to zebu and yaks, respectively
(Grosclaude et al., 1979; Ibeagha-Awemu et al., 2007).
In addition, variant D is relevant in some European and
African breeds (Ibeagha-Awemu et al., 2007).
DGAT1
gene, located on chromosome 14, encodes the DGAT1
enzyme, which catalyses the final step in triglyceride
synthesis (Kong et al., 2007; Thaller et al., 2003a). A
non-conservative lysine-to-alanine substitution (p.Lys232Ala)
in this gene has been proven to significantly influence
milk components (Banos et al., 2008; Hradecká et al.,
2008; Cerit et al., 2014) and intramuscular fat content
(Thaller et al., 2003b; Li et al., 2013; Tait et al., 2014)
in different cattle breeds. However, studies on various
cattle populations could not substantiate a consistent
association between
DGAT1
variants and fertility traits
(Kaupe et al., 2007; Oikonomou et al., 2009; Berry et al.,
2010; Rychtářová et al., 2014).
The cattle population in Turkey is about 16 million.
Within this population, dairy cattle plays an important
role in the animal production sector and Turkish economy.
In 2017, approximately 20.7 million tonnes of milk were
produced from 28.5 million dairy animals, including 5.9
million cattle, 17.5 million sheep, 4.9 million goats, and
69,497 water buffaloes. Of this production, 18.8 million
tonnes (approximately 91% of total) were obtained
from cows (Turkish Statistical Institute, 2018). Holstein
comprises by far the most common cattle breed in Turkish
dairy cattle industry with approximately 6.5 millions
purebreds. Despite high number of milking cows, average
milk yield per cow (3.143 kg) remains very low compared
with those of developed countries (Turkish Statistical
Institute, 2018). Hence, there is still room for improvements
in national milk production of Turkey.
Much research evaluating the association between milk
production traits and genetic markers used in this study has
been conducted and has revealed inconsistent results in
various cattle populations (Kucerova et al., 2006; Khatib
et al., 2009; Rychtářová et al., 2014). Milk production
traits are under the control of polygenic inheritance, and
the phenotypic expression of these traits is highly variable
among breeds and even between different populations
of the same breed (Braunschweig et al., 2000; Boettcher
et al., 2004). Hence, focusing on novel associations
and characterisation of genomic regions related to
milk production traits is highly relevant. Therefore, the
objective of this study was to determine allele and genotype
frequencies of the
STAT1
,
OLR1
,
CSN1S1
,
CSN1S2
, and
DGAT1
genes and evaluate their relation to milk production
parameters.
Material and Methods
The study was carried out from March 5, 2012
to December 31, 2013 under commercial cattle farm
conditions. The farm was located in Karacabey, which
is a district of Bursa province in the Marmara Region of
Turkey (40°15
'
09.5
"
N and 28°17
'
59.9
"
E). Maximum and
minimum ambient air temperatures (°C) in the farm area
during the period of the study were 21.6 and 9.9 in autumn,
10.6 and 2.3 in winter, 18.9 and 7.4 in spring, and 30.1 and
16.9 in summer; relative humidity percentages (%) were
69.6, 71.3, 67.1, and 59.6; and total precipitation amounts
(mm) were 68.3, 84.1, 57.6, and 23.4 in the same seasons,
respectively.
All animals were recorded to the Pedigree Project of
the Turkish Ministry of Food, Agriculture and Livestock,
and Cattle Breeders Association. All experiments were
carried out in compliance with the ethical requirements and
were approved by the local Ethics Committee for Animal
Research (case no. 2010-08/06). The herd consisted of 168
purebred Holstein cows housed in three free-stall barns.
All animals were fed the same diets and had full access
to water throughout the experiment. All animals were
milked three times per day at the time of sampling for the
determination of
STAT1
,
OLR1
,
CSN1S1
,
CSN1S2
, and
DGAT1
genotypes. Milk yield of each animal was recorded
daily in milking parlors equipped with electronic devices
that automatically recorded the quantity of milk produced
by every individual animal. Furthermore, lactation
milk yield, 305 days milk yield, days before peak milk
production, and peak milk yield were recorded separately.
Daily milk yield (three times per day) and management
records for each cow were collected in the Alpro 2000
system (DeLaval, Tumba, Sweden). The 305 days milk
yield was calculated for each cow based on total milk yield
(Lucy et al., 1993). In addition, milk samples were analysed
monthly for fat, protein, lactose, and solid content with a
Bentley 150 (Bentley Instruments Inc., Chaska, MN, USA)
milk analyser. Milk fat yield, lactose yield, protein yield,
and total milk solids were calculated based on the milk
production levels obtained from the analysis. To calculate
fat, lactose, protein yield, and total milk solids, the first
milk control was performed five days after the beginning of
lactation and monthly thereafter. The yields obtained in the
first control was multiplied by the period between calving
and first control. Further, the average of fat, lactose, protein
yield, and total milk solids obtained in consecutive controls
was multiplied by the number of days between controls to
calculate the corresponding total yield. Days before peak
between the beginning of lactation and the day when a peak
milk yield was achieved.
DNA for molecular analyses was extracted from
4 mL of peripheral blood samples that were collected in
K
3EDTA tubes (Vacutest Kima, SRL, Italy) by using the
phenol chloroform procedure, as described by Green and
Sambrook (2012). The concentration range (ng/µL) and
purity (absorbance at 260-280 nm) of the DNA samples
were measured with a spectrophotometer (NanoDrop
2000c, Thermo Scientific, Wilmington, DE, USA).
Genotypes of
STAT1
,
OLR1
,
CSN1S1
,
CSN1S2
, and
DGAT1
genes were detected using a polymerase chain reaction and
restriction fragment length polymorphism method
(PCR-RFLP) (Table 1). The PCR amplification was carried out
in a total volume of 50 μL containing 33.5 μL ddH
2O, 5 μL
10 × buffer, 5 μL MgSO
4, 1 μL dNTPs (2.5 mM), 2.5 U
Taq DNA polymerase (Biomatik, A1003-500 U, 5 U/μL),
1 μL (0.025 μM) of each primer, and 3 μL of the DNA
sample at a concentration of 100 ng/μL. Afterwards, 15 µL
of the amplified product with each SNP was digested with
15 U of the corresponding restriction enzyme (Table 2).
Electrophoresis on agarose gel (Sigma Aldrich, Steinheim,
Germany) was used for visualisation of fragments in a
gel imaging system (DNR-Minilumi, DNR Bio-Imaging
Systems, Israel).
Indices of genetic diversity including gene
heterozygosity (He), effective allele numbers (Ne), and
polymorphism information content (PIC) were estimated as
described by Nei and Roychoudhury (1974) and Botstein
et al. (1980).
Statistical analyses were performed with the general
linear model (GLM) procedure of Minitab (Minitab Inc.,
State College, PA, USA, version 17.1.0) to evaluate
individual effects of each genotype. Levene’s test was used
to evaluate homogeneity of the variances. To achieve best
subset through a proper statistical model, initially, sire
effect was added to the model, but afterwards, this effect
was excluded from the model because of a very large
number of sires. The same implementation was performed
for the effect of age of cow. In this context, the following
optimal model was chosen by evaluating the adjusted R
2to
compare the explanatory power of models with different
numbers of predictors to determine possible significant
differences between the genotypes:
Table 1 - Description of the single nucleotide polymorphisms (SNP) considered in this study
Locus symbol Chromosomal location GenBank Acc. no. SNP location Position Functional significance Substitution
STAT1 2 AW289395 3’UTR g.3141C>T C/T
OLR1 5 NM_174132 3’UTR g.8232C>A C/A
CSN1S1 6q31 X59856 Exon XVII g.17807A>G E192G A/G
CSN1S2 6q31 M94327 Exon VIII g.8879G>T G/T
DGAT1 14 AY065621 Exon VIII g.10433G>A
g.10434C>A K232A1 AA/GC
STAT1 - signal transducer and activator of transcription 1; OLR1 - oxidized low-density lipoprotein receptor 1; CSN1S1 - alphaS1-casein; CSN1S2 - alphaS2-casein; DGAT1 -
diacylglycerol acyltransferase 1.
1
The two SNP in the DGAT1 gene lie immediately adjacent to one another in exon VIII, and the two alleles at this locus are AA and GC, encoding lysine (K) and alanine (A) at
the amino acid position 232.
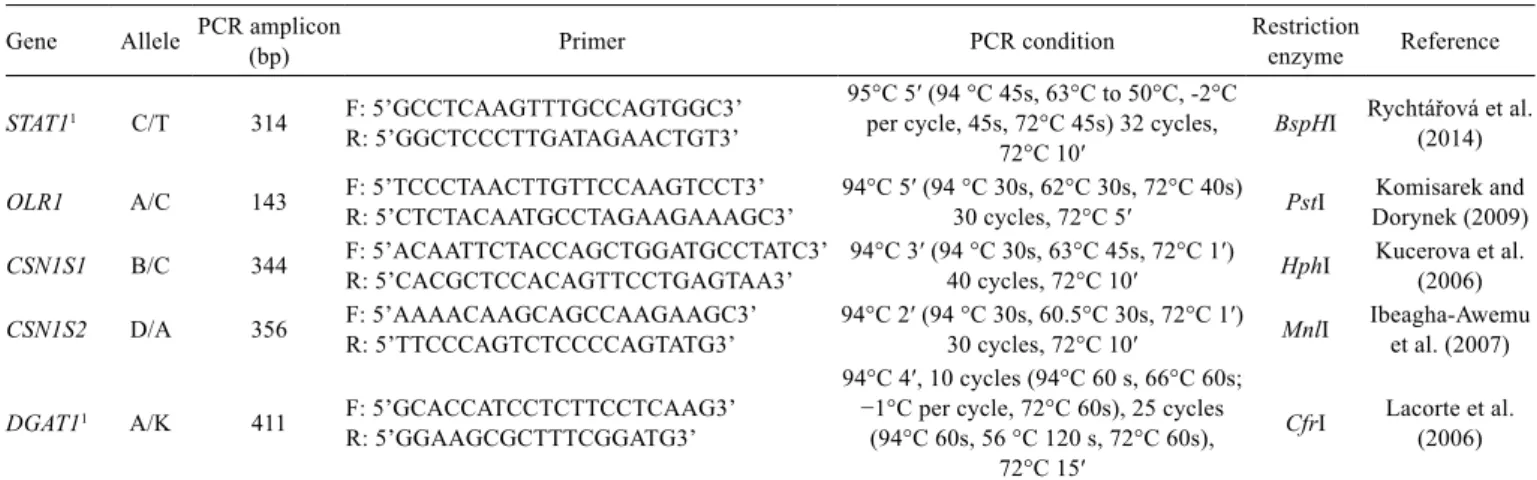
Table 2 - Primer sequences (from 5′ to 3′), PCR conditions, and restriction enzymes used for genotyping the polymorphisms in the current
study
Gene Allele PCR amplicon (bp) Primer PCR condition Restriction enzyme Reference
STAT11 C/T 314 F: 5’GCCTCAAGTTTGCCAGTGGC3’
R: 5’GGCTCCCTTGATAGAACTGT3’
95°C 5′ (94 °C 45s, 63°C to 50°C, -2°C per cycle, 45s, 72°C 45s) 32 cycles,
72°C 10′ BspHI
Rychtářová et al. (2014)
OLR1 A/C 143 F: 5’TCCCTAACTTGTTCCAAGTCCT3’
R: 5’CTCTACAATGCCTAGAAGAAAGC3’ 94°C 5′ (94 °C 30s, 62°C 30s, 72°C 40s) 30 cycles, 72°C 5′ PstI Dorynek (2009)Komisarek and
CSN1S1 B/C 344 F: 5’ACAATTCTACCAGCTGGATGCCTATC3’R: 5’CACGCTCCACAGTTCCTGAGTAA3’ 94°C 3′ (94 °C 30s, 63°C 45s, 72°C 1′) 40 cycles, 72°C 10′ HphI Kucerova et al. (2006)
CSN1S2 D/A 356 F: 5’AAAACAAGCAGCCAAGAAGC3’R: 5’TTCCCAGTCTCCCCAGTATG3’ 94°C 2′ (94 °C 30s, 60.5°C 30s, 72°C 1′) 30 cycles, 72°C 10′ MnlI Ibeagha-Awemu et al. (2007)
DGAT11 A/K 411 F: 5’GCACCATCCTCTTCCTCAAG3’
R: 5’GGAAGCGCTTTCGGATG3’
94°C 4′, 10 cycles (94°C 60 s, 66°C 60s; −1°C per cycle, 72°C 60s), 25 cycles
(94°C 60s, 56 °C 120 s, 72°C 60s), 72°C 15′
CfrI Lacorte et al.(2006)
PCR - polymerase chain reaction; STAT1 - signal transducer and activator of transcription 1; OLR1 - oxidized low-density lipoprotein receptor 1; CSN1S1 - alphaS1-casein; CSN1S2 -
alphaS2-casein; DGAT1 - diacylglycerol acyltransferase 1.
Y
ijklmnop= µ + S
i+ P
j+ R
k+ AG
l+ BG
m+ CG
n+ DG
o+ EG
p+ e
ijklmnop,
in which Y
ijklmnop= studied traits; µ = overall mean;
S
i= fixed effect of lactation season (i = autumn, winter,
spring, and summer); P
j= fixed effect of service period
(j = ≤50, 51-80, 81-110, 111-140, 140≥); R
k= fixed effect
of lactation rank (k = 1,2,3,4); AG
l= fixed effect of the
STAT1
genotype (l = CC, TC, TT); BG
m= fixed effect of
the
OLR1
genotype (m = AA, AC); CG
n= fixed effect of
the
CSN1S1
genotype (n = BB, BC); DG
o= fixed effect of
the
CSN1S2
genotype (o = DA, DD); EG
p= fixed effect
of the
DGAT1
genotype (p = KA, KK) and e
ijklmnop= the
random residual effect.
For all statistical comparisons, a probability level of
P<0.05 was accepted as statistically significant. When
significant associations were identified, the mean values for
each effect were contrasted using Tukey’s test.
Results
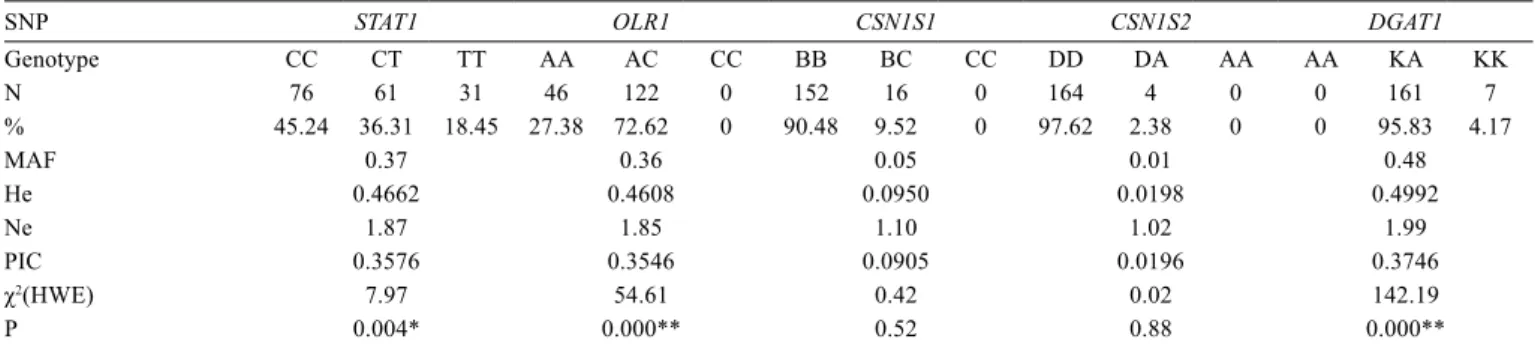
We investigated five polymorphisms corresponding
to
STAT1
,
OLR1
,
CSN1S1
,
CSN1S2
, and
DGAT1
. Results
indicated that the population was not under
Hardy-Weinberg Equilibrium (HWE) for the locus
STAT1
,
OLR1
, and
DGAT1
(P<0.05). The minor allele frequencies
(MAF) ranged from 0.01 to 0.48 (Table 3). Our results
indicated that
CSN1S1
and
CSN1S2
markers showed high
frequency of allele B (0.95) and D (0.99), respectively,
and hence, only markers
STAT1
,
OLR1
, and
DGAT1
were
polymorphic. The
CSN1S1
and
CSN1S2
markers showed
very low frequency of alleles C (0.05%) and A (0.01%),
resulting in low genetic variabilities of He, Ne, and PIC
compared with other markers showing relatively high
values of He (0.4608-0.4992), Ne (1.85-1.99), and PIC
(0.3546-0.3746) (Table 3).
Non-significant differences among
STAT1
,
OLR1
,
CSN1S1
,
CSN1S2
, and
DGAT1
genotypes were found for
lactation milk yield, 305 days milk yield, and total milk
components including fat, protein, lactose, and solids
(P>0.05) (Table 4).
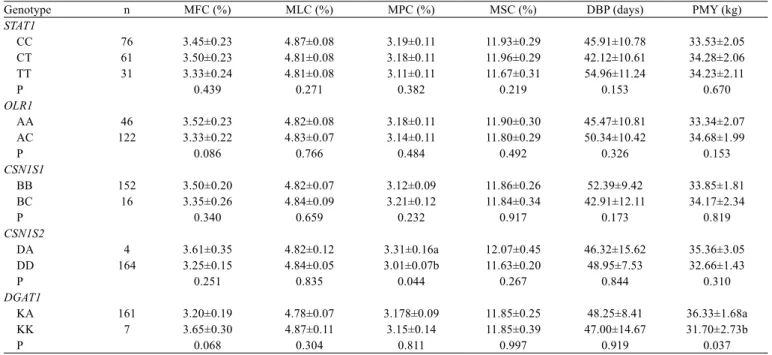
Milk protein content was significantly different in the
CSN1S2
genotypes in the current study (P<0.05) (Table 5).
In this context, DD genotype was associated with higher
protein contents compared with DA genotype. In addition,
the results indicated that
DGAT1
was significantly
associated with maximum peak milk yield (P<0.05), and
heterozygous genotype was associated with a higher peak
milk yield compared to KK genotype (Table 6).
Discussion
This study reports the association between
STAT1
,
OLR1
,
CSN1S1
,
CSN1S2
, and
DGAT1
variants and milk
production traits in Holstein dairy cattle. These genes were
chosen because of their involvement in the development
of the mammary gland. The genes are also located in the
region of QTL influencing milk yield and composition
traits (Khatib et al., 2006; Banos et al., 2008; Khatib et al.,
2009). The present results showed a deviation from HWE
for the
STAT1
,
OLR1,
and
DGAT1
polymorphisms in
Holstein population. Deviations from HWE can indicate
inbreeding, population stratification, and even problems in
genotyping (Wigginton et al., 2005). It is worth noting that
indirect selection for these loci from the selection of milk
production traits in Holstein may be another explanation for
the mentioned disequilibrium. Polymorphism information
content value is commonly used in genetic studies as a
measure of polymorphism for a marker locus and suggests
the quality of a marker (Nei and Roychoudhury, 1974;
Shete et al., 2000). In this respect, a marker with a PIC
value lower than 0.25 is considered low or not informative,
Table 3 - Allele and genotype frequencies of polymorphisms in STAT1, OLR1, CSN1S1, CSN1S2,and DGAT1 genes, population genetic
indices (He, Ne, PIC), and compatibility with the Hardy-Weinberg equilibrium
SNP STAT1 OLR1 CSN1S1 CSN1S2 DGAT1
Genotype CC CT TT AA AC CC BB BC CC DD DA AA AA KA KK
N 76 61 31 46 122 0 152 16 0 164 4 0 0 161 7
% 45.24 36.31 18.45 27.38 72.62 0 90.48 9.52 0 97.62 2.38 0 0 95.83 4.17
MAF 0.37 0.36 0.05 0.01 0.48
He 0.4662 0.4608 0.0950 0.0198 0.4992
Ne 1.87 1.85 1.10 1.02 1.99
PIC 0.3576 0.3546 0.0905 0.0196 0.3746
χ2(HWE) 7.97 54.61 0.42 0.02 142.19
P 0.004* 0.000** 0.52 0.88 0.000**
χ2(HWE) - Hardy-Weinberg equilibrium χ2 value; N - number of experimental cows; MAF - minor allele frequency; He - heterozygosity; Ne - effective allele number; PIC - polymorphism information content.
whereas values between 0.25 and 0.5 are mildly
informative. Markers with PIC values of 0.5 or higher are
highly informative for genetic studies and are extremely
useful in distinguishing the polymorphism rate of a marker
at a specific locus (Botstein et al., 1980). According to this
classification, markers used in the present study were mildly
informative, except for
CSN1S1
and
CSN1S2
. The reason
may be due to very low frequency of minor alleles for
both polymorphisms; a similar interpretation can be given
to gene heterozygosity. In this case, low heterozygosity
values could be explained by high level of inbreeding or
high selection pressure.
Table 4 - Levels of significance, least squares means, and standard errors for the effect of STAT1, OLR1, CSN1S1, CSN1S2 and DGAT1 on
milk yield traits in Holstein cows
Genotype n TMY (kg) 305-dMY (kg) MFY (kg) MLY (kg) MPY (kg) TMS (kg)
STAT1
CC 76 7,771±1,090 6,680±624 289.43±32.60 415.27±39.61 269.33±24.00 1020.30±95.01
CT 61 8,376±1,097 7,037±628 280.32±33.10 386.65±40.23 254.32±24.40 958.10±96.47
TT 31 8,395±1,119 6,983±641 284.22±34.22 411.24±41.52 260.71±25.20 994.41±99.57
P 0.376 0.395 0.839 0.287 0.417 0.385
OLR1
AA 46 8,131±1,102 6,700±631 293.01±32.91 403.32±40.01 263.03±24.22 995.90±95.96
AC 122 8,231±1,058 7,099±606 276.32±32.23 405.48±39.10 259.92±23.71 986.02±93.85
P 0.840 0.161 0.293 0.912 0.793 0.829
CSN1S1
BB 152 8,630±963 7,045±552 298.22±28.80 414.27±35.00 264.01±21.28 1018.21±83.90
BC 16 7,732±1,244 6,755±712 271.01±37.80 394.55±45.91 258.92±27.82 964.00±110.00
P 0.219 0.488 0.236 0.480 0.762 0.414
CSN1S2
DA 4 8,158±1,620 6,911±927 279.53±49.81 372.74±60.50 253.82±36.73 936.00±145.00
DD 164 8,204±760 6,888±435 289.72±22.02 436.01±26.75 269.11±16.28 1046.3±64.00
P 0.974 0.977 0.817 0.238 0.636 0.389
DGAT1
KA 161 7,997±893 7,356±511 266.64±28.25 401.22±34.23 262.52±20.71 983.52±82.00
KK 7 8,365±1,449 6,444±830 302.65±42.99 407.52±52.12 260.33±31.62 998.00±125.00
P 0.754 0.176 0.315 0.883 0.933 0.885
TMY - total milk yield; 305-dMY - 305-day milk yield; MFY - milk fat yield; MLY - milk lactose yield; MPY - milk protein yield; TMS - total milk solids.
Table 5 - Levels of significance, least squares means, and standard errors for the effect of STAT1, OLR1, CSN1S1, CSN1S2, and DGAT1 on
milk content and peak milk production traits in Holstein cows
Genotype n MFC (%) MLC (%) MPC (%) MSC (%) DBP (days) PMY (kg)
STAT1
CC 76 3.45±0.23 4.87±0.08 3.19±0.11 11.93±0.29 45.91±10.78 33.53±2.05
CT 61 3.50±0.23 4.81±0.08 3.18±0.11 11.96±0.29 42.12±10.61 34.28±2.06
TT 31 3.33±0.24 4.81±0.08 3.11±0.11 11.67±0.31 54.96±11.24 34.23±2.11
P 0.439 0.271 0.382 0.219 0.153 0.670
OLR1
AA 46 3.52±0.23 4.82±0.08 3.18±0.11 11.90±0.30 45.47±10.81 33.34±2.07
AC 122 3.33±0.22 4.83±0.07 3.14±0.11 11.80±0.29 50.34±10.42 34.68±1.99
P 0.086 0.766 0.484 0.492 0.326 0.153
CSN1S1
BB 152 3.50±0.20 4.82±0.07 3.12±0.09 11.86±0.26 52.39±9.42 33.85±1.81
BC 16 3.35±0.26 4.84±0.09 3.21±0.12 11.84±0.34 42.91±12.11 34.17±2.34
P 0.340 0.659 0.232 0.917 0.173 0.819
CSN1S2
DA 4 3.61±0.35 4.82±0.12 3.31±0.16a 12.07±0.45 46.32±15.62 35.36±3.05
DD 164 3.25±0.15 4.84±0.05 3.01±0.07b 11.63±0.20 48.95±7.53 32.66±1.43
P 0.251 0.835 0.044 0.267 0.844 0.310
DGAT1
KA 161 3.20±0.19 4.78±0.07 3.178±0.09 11.85±0.25 48.25±8.41 36.33±1.68a
KK 7 3.65±0.30 4.87±0.11 3.15±0.14 11.85±0.39 47.00±14.67 31.70±2.73b
P 0.068 0.304 0.811 0.997 0.919 0.037
The expression of
STAT1
gene is under the control of
prolactin hormone. The binding of prolactin to its receptor
initiates the activation of the
STAT1
,
STAT3
, and
STAT5
proteins that regulate genes related to milk proteins and
components (Bole-Feysot et al., 1998). Several studies
have indicated that
STAT1
is significantly associated
with production traits (Ashwell et al., 1997; Mosig et
al., 2001; Ron et al., 2004). Rychtářová et al. (2014)
reported that genotypes CC and CT were associated
with significant increases in milk protein percentage.
Significant differences were also observed between the
mentioned genotypes in estimated breeding value for
protein percentage and fat percentage. However, results
from this study showed, conversely, that there was no
association between the
STAT1
marker and milk yield and
components.
The animal breed, environmental factors, and
production procedures determine milk-related traits
(Butler et al., 1981; Palmquist et al., 1993). The population
substructure, presence of null alleles or high selection
pressure, and inbreeding or indirect selection for these
loci in the Holstein breed should be taken into account in
association studies (Lacorte et al., 2006). The inconsistency
between our findings and results of previous studies may
be attributable, at least in part, to the above-mentioned
circumstances. Hence, further genetic studies investigating
STAT1
marker need to be performed with larger populations
before using them in marker-assisted selection. It is worth
noting that milk production traits, which are under the
control of polygenic inheritance, may vary between breeds
and even between different populations of the same breed
(Braunschweig et al., 2000; Boettcher et al., 2004). In
addition, evaluating non-allelic interactions and linkage
should be considered to perform an adequate association
analysis (Boettcher et al., 2004). Inconsistent results are
not surprising for the mentioned reasons.
Many QTL related to milk yield and quality were
mapped on the bovine chromosome 5, near the location of
the
OLR1
gene (Koning et al., 2001; Olsen et al., 2002;
Rychtářová et al., 2014). However, marker C223A, an SNP
at the 3´ untranslated region of the bovine
OLR1
gene,
was not associated with either milk yield or composition
traits in this study. Similarly, Rychtářová et al. (2014)
also found no significant association between the
OLR1
C223A marker and any of the milk production traits or
reproduction traits in the Czech Fleckvieh population.
Conversely, Khatib et al. (2006) reported an association
of this marker with milk fat percentage and milk fat yield
in a population of the North American Holstein cattle.
Schennink et al. (2009) reported that
OLR1
C223A had
a significant effect on milk fat percentage in
Holstein-Friesian cattle.
OLR1
gene contributes to the balance of
oxidised low-density lipoproteins, which affect glucose
and lipid metabolism in the mammary gland (Khatib et al.,
2006; Schennink et al., 2009; Rychtářová et al., 2014). In
addition, bovine chromosome 5, in which the
OLR1
gene
is located, has been shown to be associated with milk fat
content (Khatib et al., 2006; Rychtářová et al., 2014).
However, inconsistent results are found in the literature;
moreover, there is insufficient information that outlines the
association of
OLR1
C223A marker with milk production
traits. Further studies are needed to confirm the present
results and to observe novel associations.
Our results suggested that the
CSN1S1
locus
was not
associated with any of the traits analysed in this study.
Kucerova et al. (2006) reported a significant association
Table 6 - Variance components (percentages) estimated in the present study
Traits Genetic markers
STAT1 OLR1 CSN1S1 CSN1S2 DGAT1
TMY 11581.8 (0.16%) −111312 (0%) 168123 (2.37%) −972554 (0%) −610535 (0%)
305-dMY 802.445 (0.03%) 38660.5 (1.55%) −38205.8 (0%) −319713 (0%) 191921 (7.71%)
MFY −117.734 (0%) 23.0729 (0.33%) 163.761 (2.35%) −872.123 (0%) 7.6469 (0.11%)
MLY 73.8357 (0.68%) −174.415 (0%) −120.946 (0%) 920.128 (8.43%) −917.171 (0%)
MPY −10.7015 (0%) −56.113 (0%) −119.251 (0%) −366.285 (0%) −339.271 (0%)
TMS −16.7618 (0%) −887.28 (0%) −258.516 (0%) −560.515 (0%) −5303.04 (0%)
MFC −0.00261 (0%) 0.00985 (2.30%) −0.00031 (0%) 0.01208 (2.82%) 0.07285 (17.02%)
MLC 0.00013 (0.32%) −0.00069 (0%) −0.00138 (0%) −0.00545 (0%) 0.00019 (0.46%)
MPC 0.00052 (0.17%) −0.00091 (0%) 0.00195 (1.76%) 0.03607 (32.53%)* −0.00621 (0%)
MSC 0.00357 (0.63%) −0.00533 (0%) −0.02042 (0%) 0.01293 (2.29%) −0.04949 (0%)
DBP 219.091 (4.63%) 110.699 (2.34%) 733.387 (15.50%) 934.381 (19.75%) −258.712 (0%)
PMY −0.31986 (0%) 0.56867 (1.70%) −0.86174 (0%) 0.34154 (1.02%) 8.2674 (24.68%)*
TMY - total milk yield; 305-dMY - 305 day milk yield; MFY - milk fat yield; MLY - milk lactose yield; MPY - milk protein yield; TMS - total milk solids; MFC - milk fat content; MLC - milk lactose content; MPC - milk protein content; MSC - milk solid content; DBP - days before peak milk production; PMY - peak milk yield.
of
CSN1S1
with milk yield. Van Eenennaam and Medrano
(1991) also found that protein content and milk yield were
different between the
CSN1S1
genotypes. In addition,
Boettcher et al. (2004) suggested a significant association
between
CN
haplotypes and production traits of Italian
Holstein and Brown Swiss. The reason for the lack of a
correlation in our study may be due to genetic constitution
of the population and the highly unbalanced genotype
distribution. Hence, it is difficult to evaluate the genotypic
associations for the
CSN1S1
locus. A significant effect of
CSN1S2
locus was found only on milk protein content in
the present study. Heterozygous genotype was associated
with higher protein content compared with DD genotype.
However, it is worth noting that the frequency of DA
genotype was rather low (2.38%). Moreover, AA genotype
was absent in the present study. Further studies should be
carried out to perform an adequate evaluation.
Caseins are a family of phosphoproteins that comprise
the major protein component of ruminant milk (Corral
et al., 2013) and are functionally regulated by
CN
genes
(Caroli et al., 2009). The
CN
gene family, including
CSN1S1
and
CSN1S2
, is located on bovine chromosome 6,
which is associated with milk components and milk quality
(Boettcher et al., 2004; Kucerova et al., 2006; Caroli et al.,
2009). Focusing on novel associations and characterisation
of
CSN1S2
locus may be highly relevant for elucidating
the influence of this genomic region on observed milk
production traits.
Many studies in dairy cattle have shown that a QTL
with a major influence on milk production is located on
bovine chromosome 14 (Coppieters et al., 1998; Looft et al.,
2001; Farnir et al., 2002), and the
DGAT1
gene is located
at this genomic region (Grisart et al., 2002; Winter et al.,
2002). Polymorphism of K232A in exon 8 of the
DGAT1
gene has been associated with milk yield (Spelman et al.,
2002; Kaupe et al., 2007; Kuehn et al., 2007; Szyda and
Komisarek, 2007; Banos et al., 2008; Berry et al., 2010),
fat yield (Berry et al., 2010) and content (Spelman et al.,
2002; Kaupe et al., 2007; Kuehn et al., 2007; Szyda and
Komisarek, 2007), and protein content (Grisart et al., 2002;
Spelman et al., 2002; Thaller et al., 2003a; Kaupe et al.,
2007; Berry et al., 2010). In the current study,
DGAT1
K232A marker did not have any significant effect on the
mentioned traits. However, a novel association between this
marker and peak milk production was observed (P<0.05).
Animals with KA genotype had + 4.63 kg higher milk yield
in peak compared with KK animals. Berry et al. (2010)
reported that K allele was associated with decreased milk
yield in Holstein-Friesian cattle. Previous studies focused
on the effect of the
DGAT1
locus on milk production traits
in various cattle populations. However, information about
the association of this locus with peak milk production
is insufficient. Economically, the configuration of the
lactation curve and details about the position and duration
of peak yield are important in dairy cattle (Wood, 1967).
Hence, genotypic information and novel associations that
influence the lactation curve and peak milk production may
be useful in improving milk production traits.
In the literature,
STAT1
,
OLR1
,
CSN1S1
,
CSN1S2
,
and
DGAT1
genes were found to be effective in milk
production traits (Boettcher et al., 2004; Kaupe et al.,
2007; Khatib et al., 2006; Rychtářová et al., 2014). Two
aspects have been commonly used for analysing the relation
between individual and combined genotypic effects and
milk production parameters. Some studies reported the
association between genotypes and phenotypes of cows,
while other studies evaluated the possible associations by
using data from sires and determining their breeding values
(Kucerova et al., 2006). In the current study, non-significant
differences (P>0.05) among
STAT1
,
OLR1
,
CSN1S1
,
CSN1S2
, and
DGAT1
genotypes were found for lactation
milk yield, 305 days milk yield, total milk components
(including fat, protein, lactose, and solids), lactose and solid
content, and days before peak milk production in Holstein
cows. The
CSN1S2
and
DGAT1
markers
significantly
affected
protein content and peak milk production,
respectively (P<0.05). However, further results from studies
for larger populations might be useful to draw more reliable
conclusions and to perform an adequate evaluation.
Conclusions
Milk protein content is significantly different between
the
CSN1S2
genotypes in Holstein cows. Moreover, results
indicated a novel effect of the
DGAT1
K232A marker on
peak milk production. Such genotypic information may
have potential for management systems in dairy cattle,
but it should be confirmed in larger populations. Thus, a
selection of animals with the favourable single nucleotide
polymorphisms genotypes may result in animals with
higher milk yield and protein content.
Acknowledgments
The authors would like to thank Matli Incorporated
Company, for their help in managing the animals and
collecting blood samples. This research was supported by
References
Ashwell, M. S.; Rexroad, C. E.; Miller, R.; VanRaden, P. M. and Da, Y. 1997. Detection of loci affecting milk production and health traits in an elite US Holstein population using microsatellite markers. Animal Genetics 28:216-222. https://doi.org/10.1111/ j.1365-2052.1997.00115.x
Band, M. R.; Larson, J. H.; Rebeiz, M.; Green, C. A.; Heyen, D. W.; Donovan, J.; Windish, R.; Steining, C.; Mahyuddin, P. and Womack, J. E. 2000. An ordered comparative map of the cattle and human genomes. Genome research 10:1359-1368. https://doi. org/10.1101/gr.145900
Banos, G.; Woolliams, J.; Woodward, B.; Forbes, A. and Coffey, M. 2008. Impact of single nucleotide polymorphisms in leptin, leptin receptor, growth hormone receptor, and diacylglycerol acyltransferase (DGAT1) gene loci on milk production, feed, and body energy traits of UK dairy cows. Journal of Dairy Science 91:3190-3200. https://doi.org/10.3168/jds.2007-0930
Berry, D. P.; Howard, D.; O’Boyle, P.; Waters, S.; Kearney, J. and McCabe, M. 2010. Associations between the K232A polymorphism in the diacylglycerol-O-transferase 1 (DGAT1) gene and performance in Irish Holstein-Friesian dairy cattle. Irish Journal of Agricultural and Food Research 49:1-9.
Boettcher, P.; Caroli, A.; Stella, A.; Chessa, S.; Budelli, E.; Canavesi, F.; Ghiroldi, S. and Pagnacco, G. 2004. Effects of casein haplotypes on milk production traits in Italian Holstein and Brown Swiss cattle. Journal of Dairy Science 87:4311-4317. https://doi.org/10.3168/jds.S0022-0302(04)73576-6
Bole-Feysot, C.; Goffin, V.; Edery, M.; Binart, N. and Kelly, P. A. 1998. Prolactin (PRL) and its receptor: actions, signal transduction pathways and phenotypes observed in PRL receptor knockout mice. Endocrine Reviews 19:225-268. https://doi.org/10.1210/edrv.19.3.0334 Botstein, D.; White, R. L.; Skolnick, M. and Davis, R. W. 1980.
Construction of a genetic linkage map in man using restriction fragment length polymorphisms. American Journal of Human Genetics 32:314-331.
Braunschweig, M.; Hagger, C.; Stranzinger, G. and Puhan, Z. 2000. Associations between casein haplotypes and milk production traits of Swiss brown cattle. Journal of Dairy Science 83:1387-1395. https://doi.org/10.3168/jds.S0022-0302(00)75007-7
Butler, W.; Everett, R. and Coppock, C. 1981. The relationships between energy balance, milk production and ovulation in postpartum Holstein cows. Journal of Animal Science 53:742-748. https://doi.org/10.2527/jas1981.533742x
Caroli, A.; Chessa, S. and Erhardt, G. 2009. Invited review: Milk protein polymorphisms in cattle: Effect on animal breeding and human nutrition. Journal of Dairy Science 92:5335-5352. https://doi.org/10.3168/jds.2009-2461
Cerit, H.; Dumen, E. and Sezgin, F. H. 2014. Comparison of DGAT1 K232a polymorphism and its effects on some milk quality parameters in Holstein and native black race cattles. Journal of the Faculty of Veterinary Medicine Kafkas University 20:301-305. Chu, M. and Zan, L. S. 2009. Association between polymorphism of
STAT1 gene and milk production traits in Chinese Holstein Cattle. Chinese Journal of Animal and Veterinary Sciences 40:309-314. Coppieters, W.; Riquet, J.; Arranz, J.-J.; Berzi, P.; Cambisano, N.;
Grisart, B.; Karim, L.; Marcq, F.; Moreau, L. and Nezer, C. 1998. A QTL with major effect on milk yield and composition maps to bovine chromosome 14. Mammalian Genome 9:540-544. https://doi.org/10.1007/s003359900815
Corral, J.; Padilla, J.; Izquierdo, M.; Martínez-Trancón, M.; Parejo, J.; Salazar, J. and Hernández-García, F. 2013. Detection and genetic characterization of ovine CSN1S2*B polymorphisms and their associations with milk production traits. Livestock Science 153:10-19. https://doi.org/10.1016/j.livsci.2013.01.008
Farnir, F.; Grisart, B.; Coppieters, W.; Riquet, J.; Berzi, P.; Cambisano, N.; Karim, L.; Mni, M.; Moisio, S. and Simon, P. 2002. Simultaneous mining of linkage and linkage disequilibrium to fine map quantitative trait loci in outbred half-sib pedigrees: revisiting the location of a quantitative trait locus with major effect on milk production on bovine chromosome 14. Genetics 161:275-287. Green, M. and Sambrook, J. 2012. Isolation and quantification of
DNA. Molecular Cloning: A Laboratory Manual 1:11-80. Grisart, B.; Coppieters, W.; Farnir, F.; Karim, L.; Ford, C.; Berzi, P.;
Cambisano, N.; Mni, M.; Reid, S. and Simon, P. 2002. Positional candidate cloning of a QTL in dairy cattle: identification of a missense mutation in the bovine DGAT1 gene with major effect on milk yield and composition. Genome Research 12:222-231. https://doi.org/10.1101/gr.224202
Grosclaude, F.; Joudrier, P. and Mahe, M. 1979. A genetic and biochemical analysis of a polymorphism of bovine αS2-casein. Journal of Dairy Research 46:211-213. https://doi.org/10.1017/ S0022029900017052
Hradecká, E.; Citek, J.; Panicke, L.; Rehout, V. and Hanusova, L. 2008. The relation of GH1, GHR and DGAT1 polymorphisms with estimated breeding values for milk production traits of German Holstein sires. Czech Journal of Animal Science 53:238-245. https://doi.org/10.17221/362-CJAS
Ibeagha-Awemu, E.; Prinzenberg, E. M.; Jann, O.; Lühken, G.; Ibeagha, A.; Zhao, X. and Erhardt, G. 2007. Molecular characterization of bovine CSN1S2* B and extensive distribution of zebu-specific milk protein alleles in European cattle. Journal of Dairy Science 90:3522-3529. https://doi.org/10.3168/jds.2006-679
Kaupe, B.; Brandt, H.; Prinzenberg, E. and Erhardt, G. 2007. Joint analysis of the influence of CYP11B1 and DGAT1 genetic variation on milk production, somatic cell score, conformation, reproduction, and productive lifespan in German Holstein cattle. Journal of Animal Science 85:11-21. https://doi.org/10.2527/jas.2005-753 Khatib, H.; Leonard, S.; Schutzkus, V.; Luo, W. and Chang, Y.
2006. Association of the OLR1 gene with milk composition in Holstein dairy cattle. Journal of Dairy Science 89:1753-1760. https://doi.org/10.3168/jds.S0022-0302(06)72243-3
Khatib, H.; Rosa, G.; Weigel, K.; Schiavini, F.; Santus, E. and Bagnato, A. 2007. Additional support for an association between OLR1 and milk fat traits in cattle. Animal Genetics 38:308-310. https://doi.org/10.1111/j.1365-2052.2007.01584.x
Khatib, H.; Huang, W.; Mikheil, D.; Schutzkus, V. and Monson, R. 2009. Effects of signal transducer and activator of transcription (STAT) genes STAT1 and STAT3 genotypic combinations on fertilization and embryonic survival rates in Holstein cattle. Journal of Dairy Science 92:6186-6191. https://doi.org/10.3168/jds.2009-2439 Komisarek, J. and Dorynek, Z. 2009. Effect of ABCG2, PPARGC1A,
OLR1 and SCD1 gene polymorphism on estimated breeding values for functional and production traits in Polish Holstein-Friesian bulls. Journal of Applied Genetics 50:125-132. https://doi.org/10.1007/BF03195663
Kong, H.; Oh, J.; Lee, J.; Yoon, D.; Choi, Y.; Cho, B.; Lee, H. and Jeon, G. 2007. Association of sequence variations in DGAT 1 gene with economic traits in Hanwoo (Korea cattle). Asian-Australasian Journal of Animal Sciences 20:817-820. https://doi.org/10.5713/ ajas.2007.817
Koning, D. J.; Schulmant, N.; Elo, K.; Moisio, S.; Kinos, R.; Vilkki, J. and Mäki-Tanila, A. 2001. Mapping of multiple quantitative trait loci by simple regression in half-sib designs. Journal of Animal Science 79:616-622. https://doi.org/10.2527/2001.793616x Kucerova, J.; Matejicek, A.; Jandurova, O.; Sorensen, P.; Nemcova,
Kuehn, C.; Edel, C.; Weikard, R. and Thaller, G. 2007. Dominance and parent-of-origin effects of coding and non-coding alleles at the acylCoA-diacylglycerol-acyltransferase (DGAT1) gene on milk production traits in German Holstein cows. BMC Genetics 8:62-70. https://doi.org/10.1186/1471-2156-8-62
Lacorte, G.; Machado, M.; Martinez, M.; Campos, A.; Maciel, R.; Verneque, R.; Teodoro, R.; Peixoto, M.; Carvalho, M. and Fonseca, C. 2006. DGAT1 K232A polymorphism in Brazilian cattle breeds. Genetics and Molecular Research 5:475-482.
Li, X.; Ekerljung, M.; Lundström, K. and Lunden, A. 2013. Association of polymorphisms at DGAT1, leptin, SCD1, CAPN1 and CAST genes with color, marbling and water holding capacity in meat from beef cattle populations in Sweden. Meat Science 94:153-158. https://doi.org/10.1016/j.meatsci.2013.01.010 Liao, C. H.; Shaw, H. M. and Chao, P. M. 2008. Impairment of
glucose metabolism in mice induced by dietary oxidized frying oil is different from that induced by conjugated linoleic acid. Nutrition 24:744-752. https://doi.org/10.1016/j.nut.2008.03.010 Looft, C.; Reinsch, N.; Karall-Albrecht, C.; Paul, S.; Brink,
M.; Thomsen, H.; Brockmann, G.; Kuhn, C.; Schwerin, M. and Kalm, E. 2001. A mammary gland EST showing linkage disequilibrium to a milk production QTL on bovine Chromosome 14. Mammalian Genome 12:646-650. https://doi.org/10.1007/ s003350020003
Lucy, M.; Hauser, S.; Eppard, P.; Krivi, G.; Clark, J.; Bauman, D. and Collier, R. 1993. Variants of somatotropin in cattle: gene frequencies in major dairy breeds and associated milk production. Domestic Animal Endocrinology 10:325-333. https://doi.org/ 10.1016/0739-7240(93)90036-B
Mehta, J. L. and Li, D. 2002. Identification, regulation and function of a novel lectin-like oxidized low-density lipoprotein receptor. Journal of the American College of Cardiology 39:1429-1435. https://doi.org/10.1016/S0735-1097(02)01803-X
Mosig, M. O.; Lipkin, E.; Khutoreskaya, G.; Tchourzyna, E.; Soller, M. and Friedmann, A. 2001. A whole genome scan for quantitative trait loci affecting milk protein percentage in Israeli-Holstein cattle, by means of selective milk DNA pooling in a daughter design, using an adjusted false discovery rate criterion. Genetics 157:1683-1698.
Nei, M. and Roychoudhury, A. 1974. Sampling variances of heterozygosity and genetic distance. Genetics 76:379-390. Oikonomou, G.; Angelopoulou, K.; Arsenos, G.; Zygoyiannis,
D. and Banos, G. 2009. The effects of polymorphisms in the DGAT1, leptin and growth hormone receptor gene loci on body energy, blood metabolic and reproductive traits of Holstein cows. Animal Genetics 40:10-17. https://doi.org/10.1111/j.1365-2052.2008.01789.x
Olsen, H.; Gomez-Raya, L.; Vage, D.; Olsaker, I.; Klungland, H.; Svendsen, M.; Adnoy, T.; Sabry, A.; Klemetsdal, G. and Schulman, N. 2002. A genome scan for quantitative trait loci affecting milk production in Norwegian dairy cattle. Journal of Dairy Science 85:3124-3130. https://doi.org/10.3168/jds.S0022-0302(02)74400-7
Palmquist, D.; Beaulieu, A. D. and Barbano, D. 1993. Feed and animal factors influencing milk fat composition. Journal of Dairy Science 76:1753-1771. https://doi.org/10.3168/jds.S0022-0302(93)77508-6
Ringseis, R.; Dathe, C.; Muschick, A.; Brandsch, C. and Eder, K. 2007. Oxidized fat reduces milk triacylglycerol concentrations by inhibiting gene expression of lipoprotein lipase and fatty acid transporters in the mammary gland of rats. The Journal of Nutrition 137:2056-2061. https://doi.org/10.1093/jn/137.9.2056 Ron, M.; Feldmesser, E.; Golik, M.; Tager-Cohen, I.; Kliger, D.; Reiss,
V.; Domochovsky, R.; Alus, O.; Seroussi, E. and Ezra, E. 2004.
A complete genome scan of the Israeli Holstein population for quantitative trait loci by a daughter design. Journal of Dairy Science 87:476-490. https://doi.org/10.3168/jds.S0022-0302(04)73187-2 Rychtářová, J.; Sztankóová, Z.; Kyselová, J.; Zink, V.; Štípková, M.;
Vacek, M. and Štolc, L. 2014. Effect of DGAT1, BTN1A1, OLR1, and STAT1 genes on milk production and reproduction traits in the Czech Fleckvieh breed. Czech Journal of Animal Science 59:45-53. https://doi.org/10.17221/7228-CJAS
Schennink, A.; Bovenhuis, H.; Leon‐Kloosterziel, K. M.; Van Arendonk, J. A. and Visker, M. H. 2009. Effect of polymorphisms in the FASN, OLR1, PPARGC1A, PRL and STAT5A genes on bovine milk‐fat composition. Animal Genetics 40:909-916. https://doi.org/10.1111/j.1365-2052.2009.01940.x
Schennink, A.; Stoop, W. M.; Visker, M. W.; Heck, J. M.; Bovenhuis, H.; Poel, J. J.; Van Valenberg, H. J. and Van Arendonk, J. A. 2007. DGAT1 underlies large genetic variation in milk-fat composition of dairy cows. Animal Genetics 38:467-473. https://doi.org/10.1111/ j.1365-2052.2007.01635.x
Shete, S.; Tiwari, H. and Elston, R. C. 2000. On estimating the heterozygosity and polymorphism information content value. Theoretical population biology 57:265-271. https://doi.org/ 10.1006/tpbi.2000.1452
Spelman, R.; Ford, C.; McElhinney, P.; Gregory, G. and Snell, R. 2002. Characterization of the DGAT1 gene in the New Zealand dairy population. Journal of Dairy Science 85:3514-3517. https://doi.org/10.3168/jds.S0022-0302(02)74440-8
Szyda, J. and Komisarek, J. 2007. Statistical modeling of candidate gene effects on milk production traits in dairy cattle. Journal of Dairy Science 90:2971-2979. https://doi.org/10.3168/jds.2006-724 Tait, R.; Shackelford, S.; Wheeler, T.; King, D.; Keele, J.; Casas,
E.; Smith, T. and Bennett, G. 2014. CAPN1, CAST, and DGAT1 genetic effects on preweaning performance, carcass quality traits, and residual variance of tenderness in a beef cattle population selected for haplotype and allele equalization. Journal of Animal Science 92:5382-5393. https://doi.org/10.2527/jas.2014-8211 Thaller, G.; Krämer, W.; Winter, A.; Kaupe, B.; Erhardt, G. and
Fries, R. 2003a. Effects of variants on milk production traits in German cattle breeds. Journal of Animal Science 81:1911-1918. https://doi.org/10.2527/2003.8181911x
Thaller, G.; Kühn, C.; Winter, A.; Ewald, G.; Bellmann, O.; Wegner, J.; Zühlke, H. and Fries, R. 2003b. DGAT1, a new positional and functional candidate gene for intramuscular fat deposition in cattle. Animal Genetics 34:354-357. https://doi.org/10.1046/ j.1365-2052.2003.01011.x
Turkish Statistical Institute (TSI). 2018. Livestock statistics. Available at: <http://www.turkstat.gov.tr>. Accessed on: Feb. 26, 2018. Van Eenennaam, A. and Medrano, J. F. 1991. Milk protein
polymorphisms in California dairy cattle. Journal of Dairy Science 74:1730-1742. https://doi.org/10.3168/jds.S0022-0302(91)78336-7 Wigginton, J. E.; Cutler, D. J. and Abecasis, G. R. 2005. A note on
exact tests of Hardy-Weinberg equilibrium. The American Journal of Human Genetics 76:887-893. https://doi.org/10.1086/429864 Winter, A.; Kramer, W.; Werner, F. A.; Kollers, S.; Kata, S.;
Durstewitz, G.; Buitkamp, J.; Womack, J. E.; Thaller, G. and Fries, R. 2002. Association of a lysine-232/alanine polymorphism in a bovine gene encoding acyl-CoA: diacylglycerol acyltransferase (DGAT1) with variation at a quantitative trait locus for milk fat content. p.9300-9305. In: Proceedings of the National Academy of Sciences. United States of America.