Received February 14, 2008 and accepted January 9, 2009. Corresponding author: [email protected]; [email protected]
ISSN 1806-9290 (on-line) www.sbz.org.br
Polymorphism of alpha
s1-casein gene in a dairy goat herd in the
southeastern region of Brazil
1Maria Amélia Menck Soares2, Marcelo Teixeira Rodrigues3, Giuliana Patrícia Mognol4, Lucinéia de Fátima Chasko Ribeiro5, José Luis da Conceição Silva5, Rose Meire Costa
Brancalhão2
1Apoio financeiro: Fundação de Amparo à Pesquisa do Estado de Minas Gerais - FAPEMIG.
2Centro de Ciências Biológicas e da Saúde, Universidade Estadual do Oeste do Paraná, CEP: 85819-110, Cascavel, Paraná, Brasil. 3Departamento de Zootecnia, Universidade Federal de Viçosa, CEP: 36570-000. Viçosa, Minas Gerais, Brasil.
4Instituto Nacional do Câncer – INCA, Rio de Janeiro, Brasil.
5Centro de Ciências Médicas e Farmacêuticas, Universidade Estadual do Oeste do Paraná.
ABSTRACT - Three different regions of the alphas1-casein gene (CSN1S1) were investigated to determine the frequencies of major alleles for null, low, intermediate and high milk protein expression in a herd of dairy goats raised in the southeastern region of Brazil. Genomic DNA samples were obtained from leukocytes of 145 dairy goats and regions of interest in the gene were amplified through Polymerase Chain Reaction (PCR), then evaluated in both agarose (O and E allele) and polyacrylamide gels (F allele). For better characterization of the F allele, a PCR-RFLP (PCR-Restriction Fragment Length Polymorphism) study was performed employing the endonuclease XmnI. The allelic frequencies in the herd of 62 Saanen goats studied were: CSN1S1E = 0.35; CSN1S1F = 0.30; CSN1S1O1 = 0.02; CSN1S1A+B+C = 0.30, other alleles = 0.03. In another
group of 83 Alpine animals, the frequencies were: CSN1S1E = 0.48; CSN1S1F = 0.28; CSN1S1O1 = 0.01; CSN1S1A+B+C = 0.20,
other alleles = 0.03. In the region of exon 9 and intron downstream, where mutations that characterize the F allele occur, it was verified that different intragenic haplotypes may exist, involving the deletion of the 23rd nucleotide in the ninth exon in addition to the insertion of 11bp on intron. These haplotypes may be used to make direct association with other alleles. Although rare, a higher number of combinations were found in this work by evaluating in conjunction the region of the insertion of 3bp in the referred intron, which may allow a higher number of associations. A complete characterization of these combinations will allow elaborating simplified protocols to identify animals concerning the alleles of CSN1S1 gene in goats.
Key Words: Alpine, Capra hircus, CSN1S1, genotyping, milk proteins, Saanen
Polimorfismo do gene da alpha
s1-caseína em um rebanho leiteiro na região
sudeste do Brasil
RESUMO - Foram investigadas três regiões do gene da alphas1-caseína (CSN1S1) para determinar as frequências dos principais alelos para nula, baixa, média e alta expressão desta proteína no leite em um rebanho de cabras leiteiras na Região Sudeste do Brasil. O DNA genômico foi isolado a partir de amostras de leucócitos provenientes de 145 cabras leiteiras e as regiões de interesse no gene foram amplificadas pela técnica da Reação em Cadeia da Polimerase (PCR) e avaliadas posteriormente em gel de agarose (alelos O e E) e gel de poliacrilamida (alelo F). Para melhor caracterização do alelo F, após a PCR, também foi verificado o polimorfismo no comprimento dos fragmentos de restrição (PCR-RFLP) utilizando-se a endonuclease XmnI. No rebanho analisado, foram encontradas as seguintes frequências alélicas em 62 animais da raça Saanen: CSN1S1E = 0.35; CSN1S1F = 0.30; CSN1S1O1 = 0.02; CSN1S1A+B+C = 0.30; outros alelos = 0.03.
Em outro grupo de 83 animais da raça Alpina, as frequências foram: CSN1S1E = 0.48; CSN1S1F = 0.28; CSN1S1O1 = 0.01;
CSN1S1A+B+C = 0.20; outros alelos = 0.03. Na região do exon e intron 9, onde ocorrem as mutações que caracterizam o alelo F, podem existir diferentes haplótipos intragênicos, envolvendo a deleção do 23º nucleotídeo do exon 9, e a inserção de 11pb no intron subsequente. Esses haplótipos podem ser utilizados para associação direta a outros alelos. Embora raro, neste trabalho foi encontrado maior número de combinações ao se avaliar, juntamente com as outras duas mutações, a região da inserção de 3pb no mesmo intron, o que pode permitir maior número de associações. A completa caracterização dessas combinações permitirá elaborar protocolos mais simplificados para a identificação de animais quanto aos demais alelos do gene CSN1S1 em caprinos leiteiros.
Introduction
Caseins (αs1, β, αs2, and κ) in ruminants are coded by single-copy genes, physically linked in a region of approximately 300 kb, in the following order: CSN1S1 (αs1-Cn), CSN2 (β-Cn), CSN1S2 (αs2-Cn), and CSN3 (κ-Cn) (Ferretti et al., 1990).
Among caseins, the αs1-Cn represents more than 40%
in bovine milk (Farrell et al., 2004), while in goat milk, it ranges from 0 to 25% due to the occurrence of polymorphism in the gene that codes for this protein (Boulanger et al., 1984). As reviewed by Neveu et al. (2002), at least 18 alleles of the CSN1S1 gene have already been detected in goat breeds, and classified into four expression levels of 3.6, 1.6, 0.6, and 0 g/L/allele, and named as “high”, “intermediate”, “low” and “null” alleles.
The protein synthesized through the expression of this gene consists of 199 amino acid residues. A, B, C, and E variants differ only in amino acid substitutions, while D and F variants result from the deletion of 11 and 37 amino acids, respectively (Brignon et al., 1989; Brignon et al., 1990). O1 Allele, characterized by Grosclaude et al. (1987) for the null production of αs1-Cn in milk, is the result of the
deletion of approximately 8 kilobases (kb) in the 3’ region of this gene (Martin et al., 1999).
As reviewed by Moioli et al. (2007), the protein content in goat milk is affected by polymorphism in this gene, resulting in significant cheese yield differences. Consequently, due to economic implications, the effect of polymorphism in the CSN1S1 locus has been investigated, and allelic frequencies have been determined in several countries.
In this study, the objectives were to estimate the frequencies of defective E, F, and O1 alleles, as well as those of high expression in the CSN1S1 locus for Saanen and Alpine breeds in a goat herd raised in the southeastern region of Brazil and to study the polymorphism of exon 9 and intron downstream (intron 9), the most polymorphic region of the referred gene.
Material and Methods
Based on a herd containing approximately 600 purebred goats resulting from a breeding program started in 1983 using native goats and purebred Alpine and Saanen, 145 animals (Capra hircus, Linnaeus, 1758) were randomly sampled, from which 62 were Saanen and 83 Alpine breeds. It should be mentioned that the reproduction management was conducted in a way to avoid inbreeding.
Genomic DNA was obtained from blood sample via extraction buffer as described by Lodhi et al. (1994), with some protocol modifications. Approximately 10 mL of blood were colleted in vacutainers tubes containing EDTA, then centrifuged at 2,500g for isolating leukocytes, deposited between erythrocytes and plasma. The volume of 8 mL of leukocytes were added to 500 mL of the extraction buffer and maintained for one hour at 65°C, with occasional agitation. Upon cooling at room temperature, 500 mL of chloroform and isoamyl alcohol (24:1 v:v) were added, with subsequent agitation. After centrifugation for 10 minutes at 10,000g, the supernatant was transferred to clean tubes, and DNA precipitation was accomplished by adding 250 mL isopropanol at 4°C, and kept at the same temperature for additional 30 minutes. The DNA was precipitated by centrifugation at 12,000 g for 20 minutes and rinsed twice in 75% ethanol. The DNA, dissolved in ultrapure water, was quantified using a spectrophotometer at wave length of 260 nm.
Three major regions in the CSN1S1 gene were considered to better organize the results. The first region comprised the end of intron 8, the entire exon 9, and most of the downstream intron (for F allele characterization); the second region comprised from the end of intron 11, exon 12, and most of intron 12 (for O allele characterization); and the third region comprised the end of intron 18, the entire exon 19, and the beginning of intron 19 (for E allele characterization). These fragments that did not carry the mutations investigated in the regions previously mentioned were named “high” allele (A + B + C). Genic variations other then E, F, O alleles and those of high expression, were referred as “other alleles”.
Three pairs of primers were designed (Table 1) based on the genetic sequence of αs1-Cn published by Ramunno et al. (2004) and available at GenBank (accession AJ504710). The primers were selected with the Saccharomyces Genome Database primer design program.
With the purpose of studying the region of exon 12 and intron downstream, in addition to the two primers constructed in the present study, a third primer (α12R), based on studies by Cosenza et al. (2003), was required in the present study to characterize the O allele, since it is annealed in the first 20 nucleotides located after the 8-kb deletion that occurs from intron 12.
DNA polymerase (Invitrogen – Life Technologies), and 50 ng of genomic DNA. The program consisted of an initial denaturation step at 94oC for five minutes, 35 amplification cycles, comprising strand denaturation at 94oC for one minute, primer annealing for 45 seconds at temperatures of 60, 62, and 64oC (for Cn-O, Cn-F, and Cn-E primers, respectively), and extension at 72oC for one minute. Finally, an extension step was performed for five minutes at 72oC. The amplified fragments were evaluated in both 1% agarose gel (O and E alleles) and in a 10% polyacrylamide gel (F allele), stained with ethidium bromide.
The exon 9 and downstream intron region were analyzed using the AJ504710 sequence with the RestrictionMapper software to investigate restriction sites for the XmnI enzyme in that region. The fragments generated with Cn-F(F) and Cn-F(R) primers were digested with two units of the enzyme for 5 hours, following the instructions from the manufacturer (BioLabs Inc. – New England). The digestion analyses were performed in 3% agarose gel, stained with ethidium bromide.
To confirm PCR products identity from Cn-F(F) and Cn-F(R) primers, some fragments were purified (Wizard® SV Gel and PCR Clean-Up System – PROMEGA – Madison, WI, USA) and sequenced (MegaBACE 1000 Amersham Life Science – USA) according to the chain-termination technique (Sanger et al., 1977), using the DYEnamic ET Dye Terminator Kit (GE Healthcare, USA). The sequences generated were compared against the sequence deposited in the GenBank, using the BLAST program (Altschul et al., 1997).
Results and Discussion
The PCR reactions using Cn-F(F) and Cn-F(R) primers produced fragments with sizes larger than 900 bp. Slight variations in size were observed between the amplified fragments, differing from one another in a few base pairs. According to Leroux et al. (1992), two insertions in intron 9, one containing 11 bp (CGTAATGTTTC) and the other containing 3 bp (AAT or TAA), together with the deletion of one cytosine (C), which corresponds to the 23rd nucleotide
(nt) in exon 9, characterize the F allele. Consequently, fragments that showed such insertions in intron 9 were denoted by the symbol I+, while those that lacked them were denoted by I-. These symbols were the same adopted by Ramunno et al. (2000), and unlike the present work, they did not consider the 3 bp insertion within intron 9. With regard to these insertions, the occurrence of homozygous I-I -(lanes 2, 3 and 7), I+I+ (lane 5) and heterozygous I+I- (lanes 1, 4, 6 and 8) animals was observed (Figure 1).
All amplified fragments, with and without insertions, were digested with the XmnI endonuclease. The restriction map obtained by computer analysis of the amplified region showed the existence of four restriction sites, resulting in five fragments with sizes of 20, 50, 75, 204, and 554 bp when the C base was present, and three restriction sites when
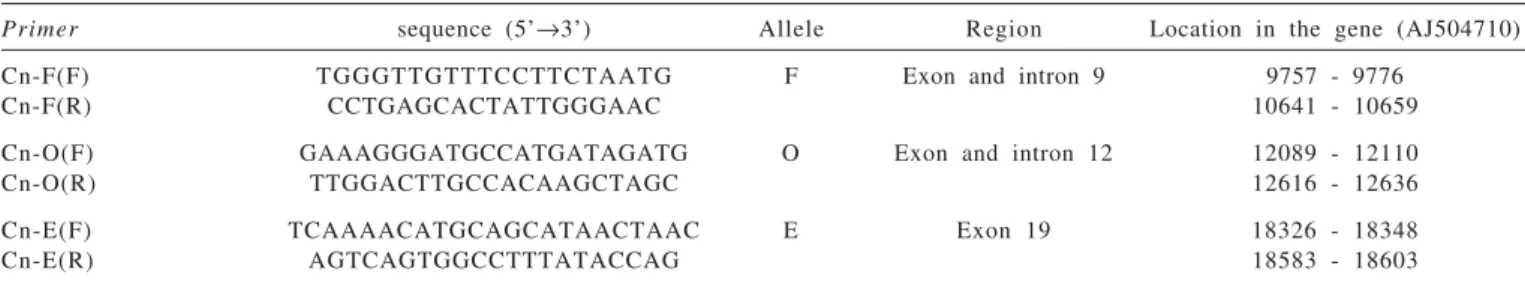
Table 1 - Sequence of primers used to amplify three specific regions of the alphas1-casein gene (CSN1S1) of goat
Primer sequence (5’→3’) Allele Region Location in the gene (AJ504710) Cn-F(F) TGGGTTGTTTCCTTCTAATG F Exon and intron 9 9757 - 9776
Cn-F(R) CCTGAGCACTATTGGGAAC 10641 - 10659
Cn-O(F) GAAAGGGATGCCATGATAGATG O Exon and intron 12 12089 - 12110
Cn-O(R) TTGGACTTGCCACAAGCTAGC 12616 - 12636
Cn-E(F) TCAAAACATGCAGCATAACTAAC E Exon 19 18326 - 18348
Cn-E(R) AGTCAGTGGCCTTTATACCAG 18583 - 18603
F: forward primer; R: reverse primer.
Figure 1 - Analysis of PCR products, on a 10% SDS-Polyacrylamide gel electrophoresis, amplified from genomic DNA of goats. Lanes 1, 4, 6 and 8: heterozygous due to the presence and lack of insertions in the first region in the CSN1S1locus (I+I-). Lane 2, 3 and 7:
homozygous due to the lack of insertions (I-I-). Lane 5: homozygous due to insertions (I+I+). M = marker (1-kb DNA ladder, Invitrogen).
1 2 3 4 5 6 7 8 M
1000 bp
the nucleotide under consideration had been deleted, causing the 553 bp and the 75 bp fragments to form a single 628 bp fragment due to the loss of one restriction site, as verified in gels. The smaller fragments with 20, 50, and 75 bp were difficult to detect in the agarose gel. Because the larger fragments showed the variations of interest, only these were taken into consideration. It must be pointed out that most fragments that showed deletion of the cytosine (C) base were also accompanied by the insertion of 11 bp, resulting in 639 bp fragments.
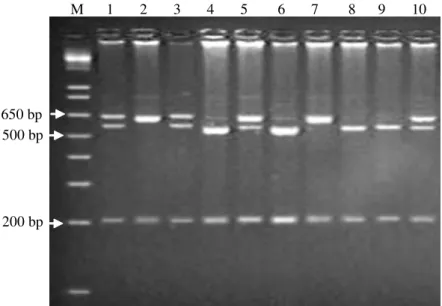
The analyses by using endonucleases allowed observing the occurrence of fragments where the C base was deleted (D+), as well as fragments where deletion in exon 9 did not occur (D-). As it can be noted in Figure 2, both D-D- (lanes 4, 6, 8 and 9) and D+D+ homozygous animals (lanes 2 and 7) were found, as well as the heterozygous D+D- (lanes 1, 3, 5, and 10). Although differences in fragment size could be observed (lanes 6 and 8), which occur by the presence or lack of a 11 bp insertion in intron 9, electrophoretic runs in polyacrylamide gels were also taken into consideration to additionally support the presence of that insertion.
Consequently, using a joint analysis of data previously shown, fragments that presented both a deletion in exon 9 and the two insertions in the downstream intron (D+I+) were characterized as F allele (CSN1S1F). Leroux et al. (1992) identified these mutations as potentially responsible for the incorrect processing of exons 9, 10, and 11 of messenger RNA, a process known as exon skipping, resulting in the
loss of 37 amino acids in the mature protein. Such deficiency in the splicing mechanism of precursors may lead to a reduced amount of mature transcripts, resulting in a reduced concentration of αs1-Cn in milk.
Sequencing data allowed the confirmation of variations that exists in the F fragments, in which both the deletion of C in exon 9 and the two insertions in the downstream intron were observed for the 4 different samples of PCR products. To identify O1allele, characterized by a large deletion beginning at intron 12, a forward Cn-O primer (F) and two reverse primers Cn-O (R) and α12R were used, which
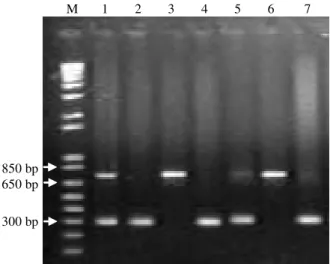
allowed the amplification of two fragments with different sizes. The largest fragment, with 548 bp, corresponds to the region between the end of intron 11 and most of intron 12, amplified when the gene was complete. The smallest fragment, observed only with the occurrence of the deletion of 8 kb, was amplified with the same forward primer (F) in association with the reverse primer α12R, comprising the end of intron 11, the entire exon 12, and approximately one third of the downstream intron, together with the 20 nucleotides located after the deleted region, totaling 304 bp (Figure 3). Most fragments did not show the cited deletion, being the O1 allele (CSN1S1O1) present only under heterozygosity (lanes 1 and 3); no homozygous animal was found for this allele.
Ramunno et al. (2000) amplified the region that characterizes the F allele (named here as first region) and associated the D-I- combination (intragenic haplotype) to CSN1S1A and CSN1S1O1 alleles, as considered in the
Figure 2 - Agarose gel electrophoresis (3%) of PCR products from the first region of the CSN1S1locus of goat, after XmnI digestion.
M = marker (1-kb DNA ladder, Invitrogen). Lanes 4, 6, 8 and 9: homozygous due to lack of cytosine deletion (D-D-). Lanes 1, 3, 5 and 10: heterozygous due to the presence of fragments with and without cutting site from enzyme (D+D-). Lanes 2 and 7: homozygous, fragments without cut (D+D+).
M 1 2 3 4 5 6 7 8 9 10
650 bp 500 bp
present study. However, an evaluation of the second region was necessary for the correct differentiation between these two alleles.
In order to detect the E allele, two primers flanking exon 19 were designed: Cn-E(F), annealing at the end of intron 18 and Cn-E(R), annealing at the beginning of intron 19. The amplification of this region allowed two fragments to be detected, one with 735 bp and another with 278 bp. According to Pérez et al. (1994), E allele (CSN1S1E) is characterized by the insertion of a Long Interspersed Repeat Element (LINE) with 458 nucleotides within exon 19, the last transcribed but untranslated exon (3’ UTR), which is a very repetitive sequence in the caprine genome. Therefore, homozygous animals containing the insertion (lanes 3 and 6), the homozygous without the insertion (lanes 2, 4, 5 and 7), and heterozygous animals (lane 1) were found (Figure 4). Fragments containing the LINE insertion (CSN1S1E) were also evaluated with regard to potential mutations in the first region. It was observed that all fragments showed insertions in intron 9; however, they did not show deletion of the C base (D-I+). This haplotype was associated with either E or B allele by Ramunno et al. (2000); although, in the present study, only fragments that did not show the LINE insertion in exon 19 were associated with the B allele. It was observed that all amplified fragments by using primers of first region were larger in animals genotyped as E than those genotyped as F. Therefore, because of a simple difference in size, it was observed that the amplification of exon 9 and intron downstream was sufficient to detect either E or B
alleles by using Polyacrylamide gel. To verify the nature of that difference in size, the sequencing of the cited region on animals genotyped as E or B is necessary.
All animals characterized as carrying alleles with a high expression of as1-Cn in milk, except for alleles from the B series, did not present the insertions or deletions previously reported in any of the three genetic regions studied. With regard to variations in the first region, the D-I- haplotype was attributed to the other alleles of high expression.
The most complex region of the CSN1S1 gene is the one comprising exon 9 and intron downstream due to different combinations between the three variations identified in that region, which allows it to be used in the association of other alleles.
In addition to the combinations already reported, some fragments were also found containing the C base deletion in exon 9 and without insertions in the intron downstream (D+I-). In the present study, this haplotype was referred to as ‘other alleles’, since it could not be related to any other allele previously described. Ramunno et al. (2000) suggested a possible association of this combination with O2, D, G allele, or with a new allele.
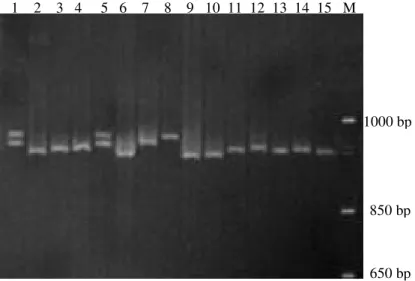
The variations in size can be observed in the region that characterizes the F allele (Figure 5). On lanes 1 end 5 (heterozygous) and lane 8 (homozygous), the presence of a larger fragment in case the animal is genotyped as CSN1S1E or CSN1S1B can be observed. Smaller fragments (lane 6, 9 and 10) were associated to the high expression alleles due
Figure 3 - Agarose gel electrophoresis (1%) of PCR products amplified from goat genomic DNA. M = marker (1-kb DNA ladder, Invitrogen). Lanes 1 and 3: heterozygous due to deletion occurred from the second region at the
CSN1S1 locus. Lanes 2, 4, 5 and 6: animals homozygous
due to lack of deletion.
M 1 2 3 4 5 6
650 bp 500 bp 300 bp
Figure 4 - Agarose gel electrophoresis (1%) of PCR products amplified from goat genomic DNA. M = marker (1-kb DNA ladder, Invitrogen). Lane 1: heterozygous due to insertion and the lack of a LINE element at the third region of CSN1S1 locus. Lanes 2, 4, 5 and 7:
homozygous due to lack of insertion. Lanes 3 and 6: homozygous due to the presence of insertion.
M 1 2 3 4 5 6 7
650 bp
to the lack of insertions of 11 and 3 bp. The smallest fragment of lanes 1 and 5 (heterozygous) and the fragment on lane 7 were associated with the F allele. The nucleotide sequences of others fragments need to be determined for better characterization. These differences suggest that other haplotypes may exist, besides the four combinations indicated by Ramunno et al. (2000). These authors did not evaluate the intron 9 region that may contain the 3 bp insertion that reduced the mutational combinations.
Therefore, the inclusion of this small insertion seems to contribute for an increase in the mutational combinations that could be used as marker sets to infer on other alleles, thus reducing the number of protocols required to characterizing the alleles of the CSN1S1 locus.
The allelic frequencies of the αs1-Cn gene were estimated by direct counting. The “intermediate” E allele, in both Saanen and Alpine breeds, was the most frequent. In general, a higher frequency of alleles associated with
a small amount of αs1-Cn in milk (E + F) can be observed in all publications presented in Table 2. According to Serradilla (2002), genotypic frequencies vary between breeds, and those that evolved from the Alpine line show a high frequency of alleles considered “intermediate” and “low”. Although the E allele is the most frequent in both Saanen and Alpine breeds, the present study indicated an increase in the frequencies of alleles associated with a high amount of αs1-Cn in milk (A + B + C), as observed in the Saanen breed, which might be occurring as a response to breeding programs, especially in France, with reflexes on the herds from the Southeastern region of Brazil due to semen imported from that country, since herds in Brazil are more related to those found in Western Europe, when compared to herds from Northern Africa, Balkans, or Mediterranean Islands (Machado et al., 2000).
Although the purpose of the herd evaluated is milk production, it may be considered under small selection
Figure 5 - Analysis of PCR products, on a 10% SDS-Polyacrylamide gel electrophoresis, amplified from genomic DNA of goats from the first region. M = marker (1-kb DNA ladder, Invitrogen). Larger fragments (lanes 1, 5 and 8) were associated to either E or B alleles. Smaller fragments (lane 6, 9 and 10) were associated to the high expression alleles. The smallest fragment on lanes 1, 5 and 7 were associated with F allele. The others fragments need to be better characterized.
1 2 3 4 5 6 7 8 9 10 11 12 13 14 15 M
1000 bp
850 bp
650 bp
Table 2 - Values of the allelic frequencies of the αs1-casein gene in Saanen and Alpine goats in Brazilian herds and those in European countries
Breed Country Sample Alleles of CSN1S1 locus References
E F O “High” Others
Alpine France 2 1 3 0.34 0.41 0.05 0.20 - Grosclaude et al. (1987) Saanen France 1 5 9 0.41 0.43 0.03 0.13 - Grosclaude et al. (1987)
Alpine Italy 8 0 0.35 0.59 0.06 - - Ramunno et al. (1991)
Saanen Italy 7 0 0.49 0.46 - 0.033(A+C+D) - Ramunno et al. (1991) Alpine Brazil 8 3 0.48 0.28 0.01 0.20 0.03 Present publication Saanen Brazil 6 2 0.35 0.30 0.02 0.30 0.03 Present publication
intensity. Regardless of the selection intensity, the distribution of allelic frequencies related to the CN1S1 locus in dairy goat populations, according to Jordana et al. (1996), may have been influenced by the reduced effective population size (Ne) and also by the founder effect on dispersion of small populations, determinant effects on distribution of allelic frequencies. Therefore, the analyses of these frequencies in herds worldwide would contribute with the understanding of this dynamics.
Conclusions
The E allele was the most frequent in both Saanen (0.35) and Alpine (0.48) breeds, and the other frequencies found were: CSN1S1F = 0.30; CSN1S1O1 = 0.02; CSN1S1A+B+C = 0.30, other alleles = 0.03 for Saanen breed. The values for the Alpine group were: CSN1S1F = 0.28; CSN1S1O1 = 0.01; CSN1S1A+B+C = 0.20, other alleles = 0.03. The attempt to determine these allelic frequencies allowed to glimpse a high number of combination between mutations found in the exon 9 and intron downstream; besides the four already cited elsewhere. These variations after precise characterization may be used as markers to infer the other alleles of the CSN1S1 gene.
Acknowledgements
This investigation was partly supported by the City hall of Santa Helena – PR, with the participation of trainees Dayane Sinara F. Santos and Fernanda Rubio. The authors wish to thank Dr. Elizabeth Pacheco Fontes and Dr. Everaldo Gonçalves de Barros for allowing the use of facilities of BioAgro Laboratories at Universidade Federal de Viçosa.
Literature Cited
ALTSCHUL, S.F.; MADDEN, T.L.; SCHÄFFER, A.A. et al. Gapped BLAST and PSI-BLAST: a new generation of protein database search programs. Nucleic Acids Research, v.25, p.3389-3402,
1997.
BOULANGER, A.; GROSCLAUDE, F.; MAHÉ, M.F. Polymorphism des caséines αS1 at αS2 de la chèvre (Capra hircus). Genetics Selection Evolution, v.16, p.157-176, 1984.
BRIGNON, G.; MAHE, M.F.; GROSCLAUDE, F. et al. Sequence of caprine αS1-casein and characterization of those of its genetics
variants which are synthesized at a high level, αS1-CnA, B and
C. Protein Sequences and Data Analysis, v.2, p.181-188, 1989.
BRIGNON, G.; MAHÉ, M.F.; RIBARDEAU-DUMAS, B. et al. Two of the three genetic variants of goat αS1-casein which are
synthesized at a reduced level have an internal deletion possibly due to altered RNA splicing. European Journal of Biochemistry,
v.193, p.237-241, 1990.
COSENZA, G.; ILLARIO, R.; RANDO, A. et al. Molecular characterization of the goat CSN1S101 allele. Journal of Dairy
Research, v.70, p.237-240, 2003.
FARRELL JR., H.M.; JIMENEZ-FLORES, R.; BLECK, G.T. et al. Nomenclature of the proteins of cows milk-sixth revision.
Journal of Dairy Science, v.87, p.1641-1674, 2004. FERRETTI, L.; LEONE, P.; SGARAMELLA, V. Long range
restriction analysis of the bovine casein genes. Nucleic Acids Research, v.18, p.6829-6833, 1990.
G R O S C L A U D E , F. ; M A H É , M . F. ; B R I G N O N , G. e t a l . A Mendelian polymorphism underlying qualitative variations of goat αs1-casein. G e n e t i c s S e l e c t i o n E v o l u t i o n, v.19,
n.4, p.399-412, 1987.
JORDANA, J.; AMILLS, M.; DIAZ, E. et al. Gene frequencies of caprine αs1-casein polymorphism in Spanish goat breeds. Small
Ruminant Research, v.20, p.215-221, 1996.
LEROUX, C.; MAZURE, N.; MARTIN, P. Mutations away from splice site recognition sequences might cis-modulate alternative splicing of goat αs1-casein transcripts. Journal of Biological
Chemistry, v.267, n.9, p.6147-6157, 1992.
LODHI, M.A.; YE, G.; WEEDEN, N.F. et al. A simple and efficient method for DNA extraction from grapevine cultivars, Vitis
species an Ampelopsis. Plant Molecular Biology Reporter.
v.12, n.1, p.6-13, 1994.
MACHADO, T.M.M.; CHAKIR, M.; LAUVERGNE, J.J. Genetic distance and taxonomic trees between goats of Ceará State (Brazil) and goats of the Mediterranean region (Europe and Africa).
Genetics and Molecular Biology, v.23, n.1, p.121-125, 2000. MARTIN, P.; OLLIVIER-BOUSQUET, M.; GROSCLAUDE, F. Genetic polymorphism of caseins: a tool to investigate casein micelle organization. International Dairy Journ al, v.9, p.163-171, 1999.
MOIOLI, B.; ANDREA, M.D.; PILLA, F. Candidate genes affecting sheep and goat milk quality. Small Ruminant Researc h, v.68, p.179-192, 2007.
NATIONAL CENTER FOR BIOTECHNOLOGY INFORMATION -NCBI. GenBank. [2001]. Disponível em: <http://www.ncbi. nlm.nih.gov>. Acesso em: 11/2/2003.
NEVEU, C.; RIAUBLANC, A.; MIRANDA, G. et al. Is the apocrine milk secretion process observed in the goat species rooted in the perturbation of the intracellular transport mechanism induced by defective alleles at the αS1-Cn locus? Reproduction
Nutrition Development, v.42, p.163-172, 2002.
PÉREZ, M.J.; LEROUX, C.; BONASTRE, A.S. et al. Occurrence of
a LINE sequence in the 3’ UTR of the goat αS1-casein
E-encoding allele associated with reduced protein synthesis level.
Gene, v.147, p.179-187, 1994.
RAMUNNO, L.; RANDO, A.; DIGREGORIO, P. et al. Structura genética di alcune populazioni caprine allevate in Italian a lócus della caseína aS1. In: CONGRESS NazASPA, 11., 1991, Milan.
Proceedings... Milan: 1991. (CD-ROM).
RAMUNNO, L.; COSENZA, G.; PAPPALARDO, M. et al. Identification of the goat CSN1S1F allele by means of PCR-RFLP method. Animal Genetics, v.31, p.333-346, 2000. RAMUNNO, L.; COSENZA, G.; RANDO, A. et al. The goat
aS1-casein gene: gene structure and promoter analysis. Gene, v.334, p.105-111, 2004.
RESTRICTION MAPPER Disponível em: <http://www.restr iction mapper.org.> Acesso em: 3/9/2003.
SANGER, F.; NICKLEN, S.; COULSON, A.R. DNA sequencing with chain-terminating inhibitors. Proceedings of the National Academy of Science of the United States of America, v.74, p.5463-5467, 1977.
SERRADILLA, J.M. The goat αs1-casein gene: a paradigm of the
use of a major gene to improve milk quality? Séminaires Méditerraneéns, v.55, p.99-106, 2002.
STANFORD GENOMIC RESORCES - Saccharomyces Genome