EFFECT OF SAMPLE RE-SATURATION ON SOIL-WATER CHARACTERISTIC
CURVE
1ÍCARO VASCONCELOS DO NASCIMENTO2, THIAGO LEITE DE ALENCAR2*, CARLOS LEVI ANASTÁCIO DOS
SANTOS2, RAIMUNDO NONATO DE ASSIS JÚNIOR2, JAEDSON CLÁUDIO ANUNCIATO MOTA2
ABSTRACT – Soil-water characteristic curve (SWCC) is an important tool for water management in irrigated agriculture. However, factors such as texture and structure of soils influence SWCC behavior. According to the literature, wetting and drying cycles alter SWCC. A similar process of re-saturation and drying occurs during SWCC obtainment under laboratory conditions. Based on the hypothesis that re-saturation process alters SWCC due to clay loss in the sample, this study aimed to obtain the SWCC, S index, and pore size distribution from samples submitted to re-saturation cycles, as well as from not re-saturated samples but under higher matric potentials (−2, −4, −6, −8, and −10 kPa). For this, disturbed and undisturbed soil samples, collected from the A (sandy texture) and Btg (sandy clay loam texture) horizons of a Argissolo Acizentado, were used. After obtaining SWCC, each air-dried soil sample was submitted to particle size and clay dispersed in water analyses to verify whether the soil lost clay. The experimental design was a completely randomized design with two methods of SWCC constructing (with and without re-saturation) and eight replications. The re-saturation process generates a loss of clay in the sample, not causing significant changes in SWCC considering the assessed textural soil classes. In addition, sandy soil samples are more sensitive to changes in pore size distribution when submitted to re-saturation.
Keywords: Irrigation management. Soil porosity. Water in soil.
EFEITO DA RESSATURAÇÃO DA AMOSTRA SOBRE A CURVA CARACTERÍSTICA DE ÁGUA NO SOLO
RESUMO - A curva característica de água no solo (CCAS) constitui importante ferramenta no manejo da água na agricultura irrigada. Entretanto, vale ressaltar que fatores como textura e estrutura do solo influenciam seu comportamento. Há informações na literatura que ciclos de umedecimento e secagem alteram a CCAS. Saliente-se que processo similar, de ressaturação e secagem, ocorre durante a obtenção da CCAS em laboratório. Tendo como hipótese que o processo de ressaturação, por provocar perda de argila na amostra, altera a CCAS, objetivou-se obter a CCAS, o índice S e a distribuição dos poros por tamanho a partir de amostras submetidas a ciclos de ressaturação em oposição àquelas não sujeitas a este processo em maiores potenciais mátricos (−2, −4, −6, −8 e −10 kPa). Para tanto, utilizaram-se amostras com estrutura deformada e indeformada, coletadas do horizonte A (textura arenosa) e Btg (textura franco argilo-arenosa) de um Argissolo Acinzentado. Após a obtenção da CCAS, cada amostra foi levada à condição de terra fina seca ao ar e submetida à análise granulométrica e de argila dispersa em água para verificar se houve perda de argila. O delineamento estatístico foi o inteiramente casualizado, com dois métodos de construção da CCAS – com e sem ressaturação – e oito repetições. Concluiu-se que o processo de ressaturação gera perda de argila na amostra, mas não provoca alterações significativas na CCAS nas classes texturais avaliadas; e que as amostras de solo de textura arenosa são mais sensíveis a alterações na distribuição de poros por tamanho quando submetidas à ressaturação.
Palavras-chave: Manejo de irrigação. Porosidade do solo. Água no solo.
________________________
*Corresponding author
1Received for publication in 09/08/2016; accepted in 03/14/2017.
Extracted from the project of scientific initiation of the first author.
2Department of Soil Science, Universidade Federal do Ceará, Fortaleza, CE, Brazil; [email protected],
INTRODUCTION
The efficient use of water resources is reinforced by the possibility of scarcity in the future (JERÓNIMO; HENRIQUES; CARVALHO, 2015). Adequate water management practices are essential for the sustainability of irrigated agriculture. Thus, the knowledge on when and how much to irrigate is necessary in order not to cause water percolation, nutrient leaching, and submit plants to excess or water deficit. For this, the water content in soil should be monitored.
The relationship between soil potential (ϕm) and volumetric soil water content (θ) is important in describing water behavior (LUCAS et al., 2011), being essential for studies of soil-water relations (SILVA et al., 2006). This relationship can be expressed mathematically by θ = f (ϕm) or ϕm = f (θ)
(ALMEIDA et al., 2015). The graphic representation of these functions is called soil-water characteristic curve (SWCC) (REICHARDT; TIMM, 2012) and assists in determining the available and current water content in the soil, as well as other basic variables to the proper irrigation management (COSTA; OLIVEIRA; KATO, 2008), indicating more appropriate agricultural production practices (MACHADO et al., 2008).
Changes in soil structure result in changes in SWCC. Pires, Bacchi and Reichardt (2007) concluded that wetting and drying cycles caused changes in the structure, density, and water content of a soil at −6 kPa whereas for Costa et al. (2014), this process is one of the main factors affecting soil physical condition, in addition to being common in agricultural soils due to natural or artificial precipitation. Furthermore, changes in SWCC from procedures to its obtainment result in overestimation or underestimation of irrigation water depth to be applied.
During the procedure to obtain SWCC, samples are usually submitted to saturation and
drying cycles, which may cause changes in sample structure and pore size distribution (PIRES et al., 2011). Collis-George (2012) questions this procedure since it underestimates or overestimates pore size, causing an uncertainty in interpreting its physical indicators.
Pires et al. (2008) studied soil-water characteristic curves obtained from wetting and drying cycles and observed an increase in the number of larger pores (10−500 µm), in addition to an improvement in the structure with the increase in the number of these cycles, considering the S index assessment. Li and Zhang (2009) observed that wetting and drying processes of soil samples caused changes in intra-aggregate pores, and a bimodal porosity structure could occur.
Thus, the hypothesis of this study was that re-saturation process due to clay loss in the sample results in changes in SWCC, particularly in the moist part, inflection point, and pore size distribution in sandy or sandy clay loam textures. This study aimed to obtain, for the two textural classes, the SWCC, S index (DEXTER, 2004), and pore size distribution from samples submitted to re-saturation cycles, as well as from not re-saturated samples but under higher matric potentials (−2, −4, −6, −8, and −10 kPa) of SWCC.
MATERIAL AND METHODS
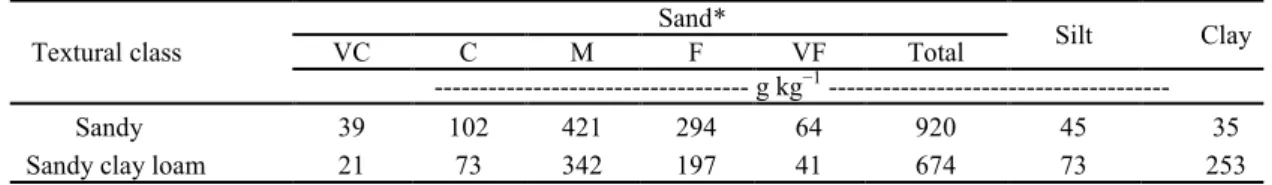
For this study, samples from sandy- and sandy clay loam-textured soils (Table 1) with disturbed and undisturbed structure were collected using an Uhland-type sampler in steel volumetric rings with 0.05 m in height and internal diameter. The collection was performed in the A (sandy texture) and Btg (sandy clay loam texture) horizons of a Argissolo Acizentado (EMBRAPA, 2013) under spontaneous vegetation located in Pacajus, CE, Brazil.
Table 1. Particle size analysis of the studied soils.
Textural class
Sand*
Silt Clay
VC C M F VF Total
--- g kg−1 ---
Sandy 39 102 421 294 64 920 45 35
Sandy clay loam 21 73 342 197 41 674 73 253
*VC = very coarse (≤2.00 to >1.00 mm); C = coarse (≤1.00 to >0.50 mm); M = medium (≤0.50 to >0.25 mm); F = fine (≤0.25 to >0.10 mm); VF = very fine (≤0.10 to >0.053 mm).
After collected, samples were sent to the Laboratory of Soil Physics of the Federal University of Ceará (UFC). Disturbed samples were used to perform analyses of particle size, clay dispersed in water, and particle density. Undisturbed samples were used to obtain the density and construct the soil
-water characteristic curve.
except for not using the chemical dispersant. Sand was sieved to obtain five sub-fractions: very coarse sand (≤2.00 to >1.00 mm), coarse sand (≤1.00 to >0.50 mm), medium sand (≤0.50 to >0.25 mm), fine sand (≤0.25 to >0.10 mm), and very fine sand (≤0.10 to >0.053 mm).
Particle density was determined by the volumetric flask method (BLAKE; HARTGE, 1986a). Soil density was obtained by the volumetric ring method, in which soil samples with undisturbed structure were dried at 105 °C until a constant mass (BLAKE; HARTGE, 1986b). Knowing the density of soil and particles, porosity was calculated by Equation (1):
(1) where a is the porosity (m3 m−3), r
p is the particle density (kg m−3), and r
s is the soil density (kg m−3). Microporosity was determined in a Haines funnel at a matric potential of −6 kPa until the water that occupied the macropores was drained (DANIELSON; SUTHERLAND, 1986). Macroporosity was determined by the difference between the total porosity and microporosity.
The SWCC was constructed in two stages. Stage I consisted of points for higher matric potentials (−2, −4, −6, −8, and −10 kPa) and the use of Haines funnel. Stage II consisted of points for the lowest matric potentials (−33, −100, −700, and −1500 kPa), obtained from a Richards porous plate extractor (KLUTE, 1986). Saturation moisture, i.e. the point corresponding to 0 kPa, was considered as the total porosity (Equation 1). Curve fitting was performed according to the mathematical model by van Genuchten (1980):
(2) where qr and qs are, respectively, the contents of
residual and saturation water (m3 m−3), ϕm is the
matric potential of soil water (−kPa), a is the ϕm stagger, and m and n are indices related to curve shape.
The experimental data were adjusted by using the software Table Curve 2D, trial version 5.01 (SYSTAT SOFTWARE INC, 2014), considering the variable qr as the value corresponding to soil water
content in a matric potential of −1500 kPa, measured in the laboratory. The adjustment of the parameters qs, a, m and n followed the Newton-Raphson
iterative method without dependence of m with n (DOURADO NETO et al., 2001).
Each of the eight samples was used to construct two soil-water characteristic curves by means of two methods. The first method consisted of a single sample saturation, providing the water contents in the tensions of stage I. In this procedure,
p sρ
ρ
1
α
m)
(
1
n r s rm
the volumetric ring sample was saturated and placed in contact with the porous plate of Haines funnel by applying a slight pressure on the ring to ensure a perfect contact between the sample and the porous plate. Matric potential was established according to the theory described in Cássaro et al. (2008).
In the second method, the sample was always re-saturated to obtain the water contents in the matric potentials corresponding to stages I and II. After each re-saturation, the sample was placed on the porous plate by applying a slight pressure on the ring to ensure a perfect hydraulic contact between the sample and the porous plate. The objective of both methods was to obtain the two soil-water characteristic curve (with and without re-saturation for stage I) and, from them, to quantify the changes caused by successive cycles of wetting and drying.
After obtaining SWCC and soil density, each air-dried soil sample was submitted to particle size analysis and clay dispersed in water in order to verify whether in the procedure of obtaining the soil-water characteristic curve there was a loss of clay.
In order to assess changes at the inflection point of SWCC, the S index, which is an indicator that assesses changes in the slope of the tangent line to this point, was calculated. According to Dexter and Czyz (2007), from the van Genuchten equation (1980), the gravimetric water content (w) can be written as a function of the matric potential, as Equation (3).
(3) By means of mathematical modifications of Equation (3), S index calculation can be simplified. First, this equation must be derived twice in relation to the logarithm of the matric potential (ln fm) and when it is equated to zero, the modulus of water potential (fmi) at the inflection point is obtained as in
Equation (4).
(4) Thus, the slope of the tangent line to the inflection point (S index) was calculated in terms of parameters from the van Genuchten (1980) equation by Equation (5).
(5) After knowing the matric potential of soil water at the inflection point (fmi, Equation 4),
corresponding to a given value of S, the equivalent diameter of the drained pore at this matric potential (fm) can be determined by means of a capillary equation, simplified by Equation (6). However, a water temperature of 25 °C and contact angle equal to zero need to be considered for this calculation.
resm n res
sat
w
m
w
w
w
1
n i
m
m
11
1
sat res
m(6) where Ø is the equivalent pore diameter (cm of water column) drained to the matric potential fm, in modulus (cm of water column).
The experimental data were analyzed in a completely randomized design considering two methods of SWCC construction (with and without re-saturation for stage I) and eight replications. The Jarque-Bera test was applied to verify data normality, the F-test for analysis of variance, and the Tukey’s test for mean comparison, all of them at 5% significance. Regression and correlation analyses
m
0.3
Ø
were also performed between the neperian logarithm of the matric potential from saturation to −10 kPa (independent variable) and soil water content (dependent variable).RESULTS AND DISCUSSION
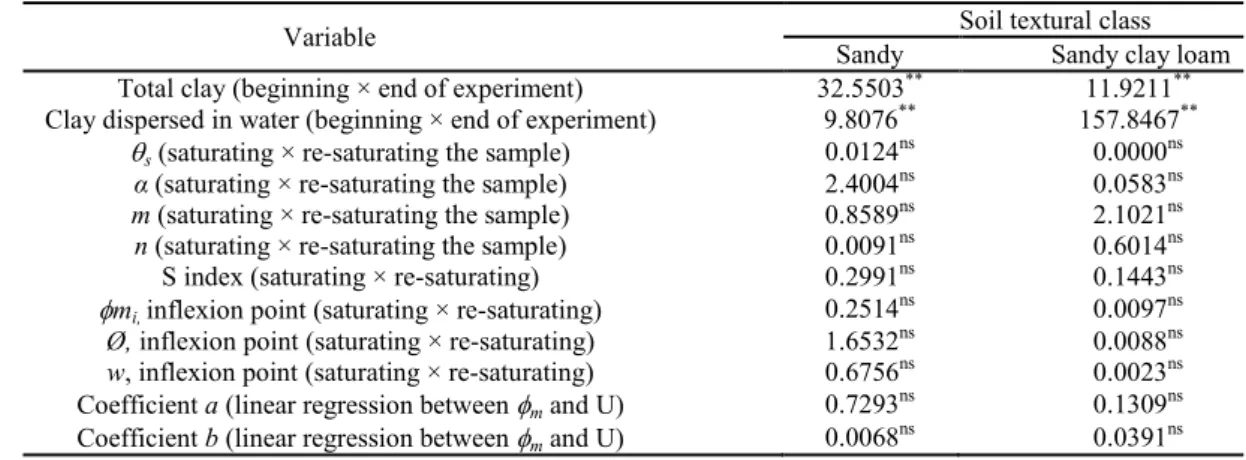
The analysis of variance and the F-test up to 5% probability level (Table 2) showed that only the total clay and clay dispersed in water presented variation between the beginning and the end of the experiment due to re-saturation cycles due to SWCC construction.
Table 2. F-test values for the studied variables.
**Significant at 1% probability; *significant at 5% probability; nsnot significant at 5% probability.
qs – volumetric moisture at saturation; α, m, and n – parameters of the van Genuchten equation; fmi – matric
potential at the inflection point; Ø – pore diameter; w – gravimetric moisture.
As shown in Table 3, a difference was observed between the initial and final amount of total clay and dispersed clay in water, which confirms the hypothesis that there is a clay loss in the sample re-saturation process.
A loss of 57% in total clay was observed in samples from the sandy soil during the process of obtaining the soil-water characteristic curve. In
addition, an increase in clay dispersed in water from 14% at the beginning (5 g kg−1 of natural clay to
35 g kg−1 of total clay) to 20% at the end of the
process (3 g kg−1 of natural clay to 15 g kg−1 of total
clay) was observed. This evidences that, in addition to the clay loss, a dispersion of aggregate material also occurs, causing the once-flocculated clay to be free in solution.
Table 3. Contents of total clay and clay dispersed in water with the standard deviations, considering the beginning and the end of the experiment.
Means followed by the same letter in the column for each soil texture do not differ from each other by the Tukey’s test at 5% significance.
Variable Soil textural class
Sandy Sandy clay loam Total clay (beginning × end of experiment) 32.5503** 11.9211**
Clay dispersed in water (beginning × end of experiment) 9.8076** 157.8467** s(saturating × re-saturating the sample) 0.0124
ns
0.0000ns
α (saturating × re-saturating the sample) 2.4004ns 0.0583ns
m (saturating × re-saturating the sample) 0.8589ns 2.1021ns
n (saturating × re-saturating the sample) 0.0091ns 0.6014ns S index (saturating × re-saturating) 0.2991ns 0.1443ns mi, inflexion point (saturating × re-saturating) 0.2514
ns
0.0097ns
Ø, inflexion point (saturating × re-saturating) 1.6532ns 0.0088ns
w,inflexion point (saturating × re-saturating) 0.6756ns 0.0023ns
Coefficient a (linear regression between m and U) 0.7293ns 0.1309ns
Coefficient b (linear regression between m and U) 0.0068 ns
0.0391ns
Textural class Situation Total clay (g kg−1) Clay dispersed in water (g kg−1) Sandy Initial 35 (± 1.0) a 5 (± 1.5) a
Final 15 (± 1.8) b 3 (± 0.6) b
Sandy clay loam
For the sandy clay loam-textured soil, 14% of the total clay was removed from soil sample during the construction of SWCC. A reduction in clay dispersed in water from 19% at the beginning (48 g kg−1 of natural clay to 253 g kg−1 of total clay)
to 2% at the end of the process (4 g kg−1 of natural
clay to 218 g kg−1 of total clay) was observed. This
evidences the removal of practically all clay that was dispersed in water.
Considering the observations on the contents of total clay and clay dispersed in water, changes in soil samples during the procedure of constructing soil-water characteristic curve are much more expressive in sandy soils. This is due, in part, to soil constitution since quartz is the predominant element in the primary particles. Because quartz does not present electrical surface charges, the possibility of clays to flocculate forming stable aggregates is smaller when compared to a soil that presents predominance of fraction clay.
In addition, the intrinsic scarcity of aggregating materials such as clays and oxides,
coupled with high sand values, imply in a weak structural stability (TERASSI; SILVEIRA; BONIFÁCIL, 2014). Another important aspect is that a high sand content disfavor the physical protection of organic matter, impairing aggregate genesis (SANTOS et al., 2011) whereas clay fraction favors aggregate formation (SILVA et al., 2014).
Furthermore, soil samples with low stability aggregate, such as those from the sandy soil, present a higher amount of natural clay for being more susceptible to wetting and drying cycles (OLIVEIRA; COSTA; SCHAEFER, 2005). That is the reason why clays are easily mobilized and removed during soil-water characteristic curve obtainment for soils that have this texture.
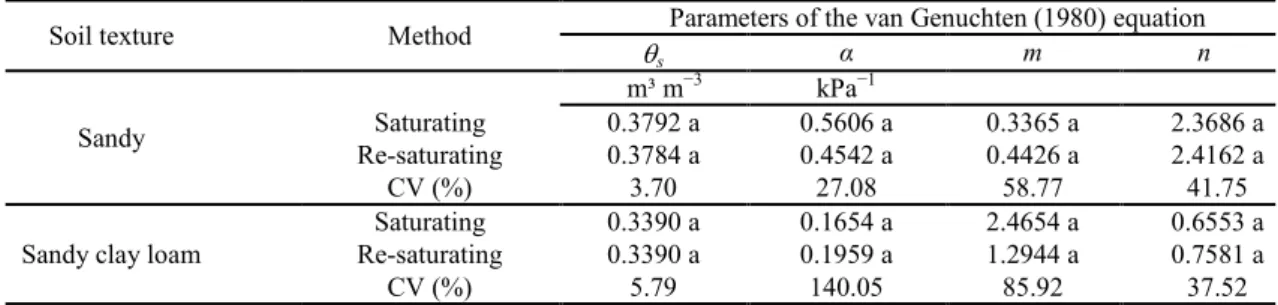
No significant difference was observed between the parameters of the van Genuchten (1980) equation (Table 4) obtained from the experimental data adjustment regarding the construction of SWCC for both textures and methods (saturation and re-saturation up to a matric potential of −10 kPa).
Table 4. Parameters of the van Genuchten (1980) equation from saturation to a matric potential of −1500 kPa, considering the saturation and re-saturation methods of soil samples.
Means followed by the same letter in the column for each soil texture do not differ from each other by the Tukey’s test at 5% significance.
The van Genuchten model is the most used to describe SWCC (DEXTER et al., 2008) and its parameters describe the curve shape (CARDUCCI et al., 2011). Thus, an SWCC can be considered equal to another if there is no statistical difference between the parameters of the van Genuchten equation (JORGE; CORÁ; BARBOSA, 2010). Therefore, soil-water characteristic curves did not lose their representativeness, regardless of the procedure to obtain them.
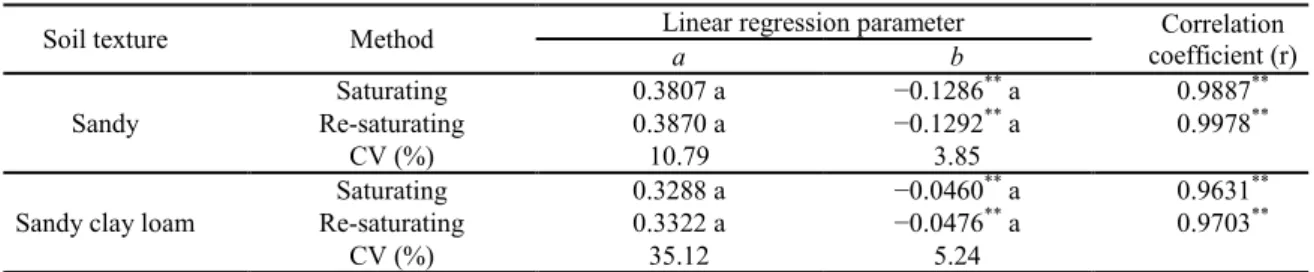
Regarding the linear regression parameters between the matric potentials of soil water from saturation to −10 kPa and volumetric water content (Table 5), a significant effect was observed at 1% probability level (t-test) for the angular coefficient b at all assessed situations, evidencing the effect of
matric potentials in soil water content. Similarly, the high correlation between both variables was also verified by the t-test at 1% probability level.
On the other hand, no difference was observed for both linear regression coefficients (intercept a and angular coefficient b) obtained by the two procedures at each situation of soil texture, which allows affirming that the obtainment procedure does not cause changes in the curve for the considered range of matric potentials.
The variables S index, matric potential, equivalent pore diameter, and moisture at the inflection point of SWCC (Table 6), from saturation to a matric potential of −1500 kPa, did not differ from each other considering saturation and re-saturation methods of samples.
Soil texture Method Parameters of the van Genuchten (1980) equation
s α m n
Sandy
m³ m−3 kPa−1
Saturating 0.3792 a 0.5606 a 0.3365 a 2.3686 a Re-saturating 0.3784 a 0.4542 a 0.4426 a 2.4162 a CV (%) 3.70 27.08 58.77 41.75
Sandy clay loam
Table 5. Linear regression parameters between soil water tension from saturation to a matric potential of −10 kPa (in neperian logarithm) and volumetric water content considering the saturation and re-saturation methods of soil samples.
**Significant at 1% probability. Means followed by the same letter in the column for each soil texture do not differ from each other by the Tukey’s test at 5% probability.
Table 6. S index, matric potential, equivalent pore diameter, and moisture at the inflection point of SWCC from saturation to a matric potential of −1500 kPa considering saturation and re-saturation methods of soil samples.
Means followed by the same letter in the column for each soil texture do not differ from each other by the Tukey’s test at 5% significance.
No difference was observed for S index and parameters obtained at the inflection point when soil samples were re-saturated, regardless of its texture, differently from that reported by Pires et al. (2008). According to these authors, a soil sample submitted to wetting and drying cycles generates a curve that presents an erratic S index distribution for different soil textural classes. These results are justified by the greater internal stress of soil sample caused by wetting and drying cycles since, in that research, drying occurred until a matric potential of −400 kPa, which is much higher than the adopted in this study.
According to Dexter and Bird (2001), the inflection point defines the moisture point corresponding to the field capacity. In this sense, matric potential values related to the inflection point were below the value that is routinely considered for sandy- (−10 kPa) and clayey-textured soils (−33 kPa). This result points out to the need of reinterpreting the concept of field capacity: on one hand, in relation to the values usually referred in the literature for different soil textures and, on the other hand, regarding the veracity that occurs around the inflection point of SWCC given the observed discrepancy in the cases under analysis.
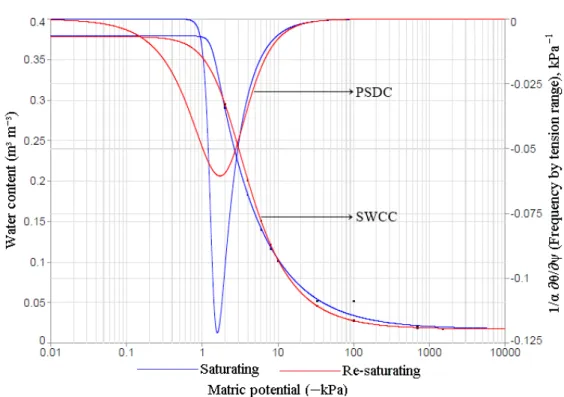
Figures 1 and 2 show the soil-water characteristic curves (SWCC) and pore size
distribution curves (PSDC) by tension range considering the obtaining methods for sandy- and sandy clay loam-textured soils, respectively. Visually, soil-water characteristic curves were similar, justifying the data and discussion presented previously.
Only the pore size distribution curves presented variations as a function of the applied procedures, which explains the advantage of using this type of curve, in addition to that relating matric potential and moisture. In the case under analysis, even SWCC not presenting large differences, the pore size distribution curve proved to be an auxiliary tool to detect differences in soil structure.
The fact that soil-water characteristic curves have not been deferred by both procedures have a significant practical importance both for their construction in the laboratory and use to define soil water management, for instance, in systems that demand the irrigation technique. Concerning the laboratory part, the construction time of curves can be reduced if samples are submitted to only one saturation until a matric potential of −10 kPa for both assessed textures. Regarding the application of curves in soil water management, there is the certainty to the user that the curve is not different, regardless of the procedure adopted to obtain it.
Soil texture Method Linear regression parameter Correlation coefficient (r)
a b
Sandy
Saturating 0.3807 a −0.1286** a 0.9887** Re-saturating 0.3870 a −0.1292** a 0.9978**
CV (%) 10.79 3.85
Sandy clay loam
Saturating 0.3288 a −0.0460** a 0.9631** Re-saturating 0.3322 a −0.0476** a 0.9703**
CV (%) 35.12 5.24
Soil texture Method S index Parameters at the inflection point
m (−kPa) Ø (µm) w (kg kg− 1
)
Sandy
Saturating 0.117 a 4.80 a 69.31 a 0.1095 a Re-saturating 0.109 a 5.13 a 59.25 a 0.1043 a CV (%) 24.65 27.10 24.34 11.76
Sandy clay loam
Figure 1. Soil-water characteristic curve (SWCC) and pore size distribution curve (PSDC) for saturation and re-saturation
conditions in sandy-textured soil samples.
Figure 2. Soil-water characteristic curve (SWCC) and pore size distribution curve (PSDC) for saturation and re-saturation
conditions in sandy clay loam-textured soil samples.
The peak of the pore size distribution curve by tension range indicates the tension at which the most frequent pore occurs. In this sense, for sandy soil (Figure 1) and both construction procedures of the soil-water characteristic curve, the most frequent pore occurs around the matric potential of -1.75 kPa, with an equivalent diameter of 171 µm, considering the capillary equation (LIBARDI, 2012).
observed, underestimating the larger pores due to material consolidation, making evident the change in porosity when compared to the other procedure.
In relation to pore size distribution by tension range for sandy clay loam-textured soil (Figure 2), the curves representing both procedures for obtaining soil-water characteristic curve show that the most frequent pore occurs at a matric potential very close to soil saturation. In this case, because the value of the parameter n was lower than the unity, a peak similar to that of Figure 1 was not found for the sandy-textured soil, making it difficult to define the most frequent pore. In addition, curves differ little, only in a narrow range of tensions, which implies a better structure stability of this soil in water when compared to the sandy-textured soil.
CONCLUSIONS
The re-saturation process generates clay loss in the sample but does not cause significant changes in SWCC, including the wetter part, nor at the inflection point at both assessed textures.
Soil samples of sandy texture are more sensitive to changes in pore size distribution when submitted to re-saturation for constructing soil-water characteristic curve.
ACKNOWLEDGEMENTS
To the Fundação Cearense de Apoio ao Desenvolvimento Científico e Tecnológico (FUNCAP) for the financial support.
REFERENCES
ALMEIDA, E. L. et al. Filter paper method for the determination of the soil water retention curve. Revista Brasileira Ciência do Solo, Viçosa, v. 39, n. 5, p. 1344-1352, 2015.
BLAKE, G. R.; HARTGE, K. H. Bulk density. In: KLUTE, A. (Ed.). Methods of Soil Analysis: Part 1 - Physical and Mineralogical Methods. 2. ed. Madison, WI: American Society of Agronomy, Soil Science Society of America, 1986a. cap. 13, p. 363 -375.
BLAKE, G. R.; HARTGE, K. H. Particle density. In: KLUTE, A. (Ed.). Methods of Soil Analysis: Part 1 - Physical and Mineralogical Methods. 2. ed. Madison, WI: American Society of Agronomy, Soil Science Society of America, 1986b. cap. 14, p. 377 -382.
CARDUCCI, C. E. et al. Modeling the water
retention curve in Oxisols using the double van Genuchten equation. Revista Brasileira de Ciência do solo, Viçosa, v. 35, n. 1, p. 77-86, 2011.
CÁSSARO, F. A. M. et al. Funil de Haines modificado: curvas de retenção de solos próximos à saturação. Revista Brasileira de Ciência do Solo, Viçosa, v. 32, n. 6, p. 2555-2562, 2008.
COLLIS-GEORGE, N. A re-interpretation of the drainage moisture characteristic. Geoderma, Amsterdam, v. 189-190, n. 1, p. 87-90, 2012.
COSTA, P. A. et al. Changes in soil pore network in response to twenty-three years of irrigation in a tropical semiarid pasture from northeast Brazil. Soil Tillage Research, Amsterdam, v. 137, n. 1, p. 23 -32, 2014.
COSTA, W. A.; OLIVEIRA, C. A. D. S.; KATO, E. Modelos de ajuste e métodos para a determinação da curva característica de água de um Latossolo Vermelho-Amarelo. Revista Brasileira Ciência do Solo, Viçosa, v. 32, n. 2, p. 515-523, 2008.
DANIELSON, R. E.; SUTHERLAND, P. L. Porosity. In: KLUTE, A. (Ed.). Methods of Soil Analysis: Part 1 - Physical and Mineralogical Methods. 2. ed. Madison, WI: American Society of Agronomy, Soil Science Society of America, 1986. cap. 18, p. 443-461.
DEXTER, A. R.; BIRD, N. R. A. Methods for predicting the optimum and the range of soil water contents for tillage based on the water retention curve. Soil Tillage Research, Amsterdam, v. 57, n. 1, p. 203-212, 2001.
DEXTER, A. R. Soil physical quality Part I. Theory, effects of soil texture, density, and organic matter, and effects on root growth. Geoderma, Amsterdam, v. 120, n. 1, p. 201-214, 2004.
DEXTER, A. R. et al. A user-friendly water retention function that takes account of the textural and structural pore spaces in soil. Geoderma, Amsterdam, v. 143, n. 1, p. 243-253, 2008.
DEXTER, A. R.; CZYZ, E. A. Applications of S -theory in the study of soil physical degradation and its consequences. Wiley Interscience, New Jersey, v. 18, n. 4, p. 369-381, 2007.
DOURADO NETO, D. et al. Software to model soil water retention curves (SWRC, version 2.00). Scientia Agricola, Piracicaba, v. 57, n. 1, p. 191 -192, 2001.
Brasileiro de Classificação de Solos. 3. ed. Rio de Janeiro, RJ: Embrapa Solos, 2013. 353 p.
GEE, G. W.; BAUDER, J. W. Particle-size analysis. In: KLUTE, A. (Ed.). Methods of Soil Analysis: Part 1 - Physical and Mineralogical Methods. 2. ed. Madison, WI: American Society of Agronomy, Soil Science Society of America, 1986. cap. 15, p. 383 -411.
JERÓNIMO, J. A.; HENRIQUES, P. D.; CARVALHO, M. L. D. Impactos do preço da água na agricultura no perímetro irrigado do Vale de Caxito. Revista de Economia e Sociologia Rural, Brasília, v. 53, n. 4, p. 699-714, 2015.
JORGE, R. F.; CORÁ, J. E.; BARBOSA, J. C. Número mínimo de tensões para determinação da curva característica de retenção de água de um Latossolo Vermelho eutrófico sob sistema de semeadura direta. Revista Brasileira de Ciência do Solo, Viçosa, v. 34, n. 6, p. 1831-1840, 2010.
KLUTE, A. Water retention: laboratory methods. In: KLUTE, A. (Ed.). Methods of Soil Analysis: Part 1 - Physical and Mineralogical Methods. 2. ed. Madison, WI: American Society of Agronomy, Soil Science Society of America, 1986. cap. 26, p. 635 -662.
LI, X.; ZHANG, L. M. Characterization of dual -structure pore-size distribution of soil. Canadian Geotech Journal, Ottawa, v. 46, n. 2, p. 29-141, 2009.
LIBARDI, P. L. Dinâmica da água no solo. 2. ed. São Paulo, SP: Editora da Universidade de São Paulo, 2012, 346 p.
LUCAS, J. F. R. et al. Curva de retenção de água no solo pelo método do papel-filtro. Revista Brasileira de Ciência do Solo, Viçosa, v. 35, n. 6, p. 1957-1973, 2011.
MACHADO, J. L. et al. Inter-relações entre as propriedades físicas e os coeficientes da curva característica de água de um Latossolo sob diferentes sistemas de uso. Revista Brasileira de Ciência do Solo, Viçosa, v. 32, n. 2, p. 495-502, 2008.
OLIVEIRA, T. S.; COSTA, L. M.; SCHAEFER, C. E. Water-dispersible clay after wetting and drying cycles in four Brazilian Oxisols. Soil Tillage Research, Amsterdam, v. 83, n. 1, p. 260-269, 2005. PIRES, L. F.; BACCHI, O. O. S.; REICHARDT, K. Assessment of soil structure repair due to wetting and drying cycles through 2D tomographic image
analysis. Soil Tillage Research, Amsterdam, v. 94, n. 1, p. 537-545, 2007.
PIRES, L. F. et al. Soil porous system changes quantified by analyzing soil water retention curve modifications. Soil Tillage Research, Amsterdam, v. 100, n. 1, p. 72-77, 2008.
PIRES, L. F. et al. Chemical migration during soil water retention curve evaluation. Anais da Academia Brasileira de Ciências, Rio de Janeiro, v. 83, n. 3, p. 1097-1108, 2011.
REICHARDT, K.; TIMM, L. C. Solo, planta e atmosfera: conceitos e aplicações. 2. ed. Barueri, SP: Manole, 2012. 500 p.
SANTOS, D. C. et al. Agregação e frações físicas da matéria orgânica de um Argissolo Vermelho sob sistemas de uso no bioma Pampa. Revista Brasileira de Ciência do Solo, Viçosa, v. 35, n. 5, p. 1735-1744, 2011.
SILVA, A. S. et al. Argila e matéria orgânica e seus efeitos na agregação em diferentes usos do solo. Ciência Rural, Santa Maria, v. 44, n. 10, p. 1783-1789, 2014.
SILVA, E. M. et al. Valores de tensão na determinação da curva de retenção de água de solos do Cerrado. Pesquisa Agropecuária Brasileira, Brasília, v. 41, n. 2, p. 323-330, 2006.
SYSTAT SOFTWARE INC. Table Curve 2D. Trial Version 5.01, 2014. Disponível em: <http:// www.sigmaplot.com/products/tablecurve2d/
tablecurve2d.php>. Acesso em: 20 dez. 2015.
TERASSI, P. M. B.; SILVEIRA, H.; BONIFÁCIL, C. M. Variação da estabilidade de agregados e as suas relações com a vulnerabilidade dos solos ao longo de uma vertente na região noroeste do Paraná. Boletim de Geografia, Maringá, v. 32, n. 1, p. 166 -176, 2014.