PORE SIZE DISTRIBUTION IN SOILS IRRIGATED WITH
SODIC WATER AND WASTEWATER
(1)Roberta Alessandra Bruschi Gonçalves(2), Thomas Vincent Gloaguen(2), Marcos Vinicius Folegatti(3), Paulo Leonel Libardi(4),
Yves Lucas(5) & Célia Regina Montes(6)
SUMMARY
Soil porosity, especially pore size distribution, is an important controlling factor for soil infiltration, hydraulic conductivity, and water retention. This study aimed to verify the effect of secondary-treated domestic wastewater (STW) on the porosity of a sandy loam Oxisol in the city of Lins, state of São Paulo, Brazil. The two-year experiment was divided into three plots: soil cultivated with corn and sunflower and irrigated with STW, soil cultivated and irrigated with sodic groundwater, and non-irrigated and non-cultivated soil (control). At the end of the experiment, undisturbed core samples were sampled from 0 to 2.0 m (8 depths). The water retention curves were obtained by tension plates and Richard’s pressure plate apparatus, and the pore size distribution inferred from the retention curves. It was found that irrigation with treated wastewater and treated groundwater led to a decrease in microporosity (VMI), defined as the pore class ranging from 0.2 to
50 µµµµµm diameter. On the other hand, a significant increase in cryptoporosity (VCRI)
(< 0.2 µµµµµm) was identified throughout the soil profile. The presence of Na+ in both
waters confirmed the role of this ion on pore size distribution and soil moisture (higher water retention).
Index terms: sodic wastewater, soil porosity, clay dispersion, soil sodicity.
(1) Received for publication in August 2009 and approved in March 2010.
(2) Professor, Centro de Ciências Exatas e Tecnológicas, Universidade Federal do Recôncavo da Bahia – CETEC/UFRB. Campus
Universitário s/n, CEP 44380-000 Cruz das Almas (BA). E-mails: [email protected]; [email protected]
(3) Professor, Departamento de Engenharia Rural, Escola Superior de Agricultura “Luiz de Queiroz” – ESALQ/USP. Caixa
Postal 9, Av. Pádua Dias 11, CEP 13418-900 Piracicaba (SP). E-mail: [email protected]
(4) Professor, Departamento de Ciências Exatas, ESALQ/USP. E-mail: [email protected]
(5) Professor, Processus de Transfert et d’Echange dans l’Environnement (PROTEE) - Université du Sud Toulon-Var, France.
E-mail: [email protected]
RESUMO: DISTRIBUIÇÃO DE POROS EM SOLOS IRRIGADOS COM ÁGUA SALINA E COM ÁGUA RESIDUÁRIA
A porosidade do solo, principalmente a distribuição dos poros, é um fator importante que controla a infiltração de água, condutividade hidráulica e retenção da água no solo. Este estudo teve como objetivo verificar os efeitos do efluente de estação de tratamento de esgoto (TSE) na porosidade de um Latossolo de textura média. A área experimental foi dividida em três parcelas: solo cultivado com milho e girassol e irrigado com TSE (STW); solo cultivado e irrigado com água subterrânea sódica (W); e solo não cultivado e não irrigado (C-controle). No final de dois anos de experimento, amostras não deformadas de solo foram coletadas de 0 a 2,0 m (oito amostras). As curvas de retenção de água no solo foram obtidas com mesas de tensão e câmara de Richards, e a distribuição de poros no solo foi calculada a partir da derivação dessas curvas. Foi observado decréscimo da microporosidade VMI (poros com
diâmetro entre 0,2 e 50 µm) no solo irrigado com TSE e água tratada. Por outro lado, observou-se aumento significativo da criptoporosidade VCRI (< 0,2 µm). A presença de Na+ nos dois tipos
de água confirmou o papel desse íon na distribuição dos poros e na umidade do solo (maior retenção de água no solo).
Termos de indexação: água residuária sódica, porosidade do solo, dispersão de argilas, sodicidade do solo.
INTRODUCTION
The disposal of solid and liquid wastes on soil is regarded as a partial solution to the environmental problem of sewage disposal into fresh water bodies (Darwish et al., 1999). A number of soil treatment systems are available for domestic treated wastewater (TW), e.g., infiltration basins or wetlands, but crop irrigation is the most accessible (Feigin et al., 1991) and efficient method (Darwish et al., 1999), principally in developing countries where policies of domestic sewage treatment are lacking.
Although irrigation with TW can solve the immediate problem of contamination of water bodies by nutrient loads, this practice requires careful management due to some water characteristics. Several authors have already pointed out damaging effects on physical soil properties, such as infiltration (Cook et al., 1994), permeability (Meenner et al., 2001), water retention capacity (Jnad et al., 2001), and soil hydraulic conductivity (Balks et al., 1998; Magesan et al., 1999; Bagarello et al., 2005; Gonçalves, 2007). Most of these observations are associated to the high Na content in TW, that can lead to a dispersion and/ or expansion of clay particles, pore size distribution (Shainberg & Letey 1984; So & Aylmore, 1993; Sumner, 1993; Halliwell et al., 2001). This indicates that the study of soil porosity may be a reasonable approach to detect changes in the soil physical properties. Pores can be defined as a function of the aggregate structure organization (Libardi, 2005) and classified as: (a) cryptopores or residual pores related to the intra-aggregate arrangement and particle type (clay, oxides), where hygroscopic water is highly bound by molecular attraction (sorption) (pore diameter
-Ø-smaller than 0.2 µm), (b) micropores where capillarity forces are predominant (0.2 < Ø < 50 µm) and (c) macropores where the water flow occurs by convection due to gravitational forces (Ø > 50 µm); micropores and macropores depend on the inter-aggregate arrangement.
The purpose of this study was the investigation of changes in soil porosity and pore size distribution after irrigation with treated sewage effluent or sodic ground water.
MATERIAL AND METHODS
Experimental field
The study was carried out in the city of Lins (São Paulo State, Brazil, 49 º 50 ’ W -22 º 21 ’ S), where the annual rainfall varies from 1,100 to 1,300 mm and the average annual temperature from 18 to 22 ºC. The experimental area is located near the sewage stabilization pond system (Australian treatment system). The soil was classified as Oxisol with a sandy loam texture (Table 1). Four crop cycles (two cycles with corn (Zea mays L). and two cycles with sunflower
(Helianthus annuus L.) were alternately drip-irrigated
Analysis of soil physical properties
The soil water retention was determined in core soil samples (height 0.05 m) collected after the four crop cycles by a Uhland sampler at three positions in each plot, at depths of 0.125, 0.375, 0.625, 0.875, 1.125, 1.375, 1.625, and 1.875 m (each sample represents a soil layer of 0.25 m). The tension table was used to determine water retention in the soil samples for ψm
of 1, 2, and 4 kPa, while water retention for ψm of 10,
30, 50, 100, 500, and 1,500 kPa was determined using Richard’s pressure plate apparatus (Richards, 1965). The experimental data were fitted to the van Genuchten (1980) equation.
Pore size distribution curves were obtained by deriving the water retention curves, considering the matric potential hi as independent variable. The equivalent pore radius ri was calculated by the
equation of capillarity (equation 1) using the hi values. The water content θ was calculated from the matric potential between 1 and 1,500 kPa, where log(hi+1) = log(hi) + 0.05. The variations (θi+1- θi) were
calculated for each hi.
(1)
where ri is the pore radius (m); σ is the surface tension
(N m-1); β is the contact angle (o); ρ is the specific
water mass (Mg m-3); g is the acceleration of gravity
(m s-2) and h
i is the matric potential (m).
Pores with a diameter larger than 0.05 mm were called “macropores” (water retained with matric potencial ψm higher than -6 kPa); “micropores”
correspond to pores with diameter between 0.05 and 0.0002 mm (-1,500 < ψm < -6 kPa), and “cryptopores”,
pores with diameter smaller than 0.0002 mm (ψm <
-1,500 kPa) (Klein & Libardi, 2002).
The soil bulk density (ds) was calculated by the ratio between the dry sample mass and the core volume (Blake & Hartge, 1986).
The water content at field capacity (θFC) was
obtained from the inflexion point method of the h(θ) curve (Ferreira & Marcos, 1983), adapted by Mello et
al.(2002). In this method, the θFC value corresponds
to the θ value at which d2h(θ)/dθ2 = 0, using cubic
polynomial regressions for modeling the h(θ) curves (r2 always > 0.956).
Soil samples were also collected for analysis of water-dispersed clay (WDC) by the pipette method (Camargo et al., 1986).
Statistical analysis
The analysis of variance and comparison of means (Tukey tests, 5 %) were performed using the GLM procedure of the SAS program, using a sub-divided plot model (3 plots = 3 treatments; 8 depths = 8 sub-treatments) and log-transformed values.
RESULTS AND DISCUSSION
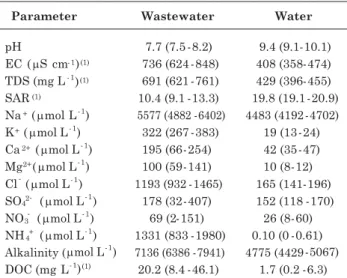
The values of sodium adsorption ratio (SAR) were higher in treated groundwater than in STW (Table 2) due to the lower concentrations of Ca2+ and Mg2+; the
risk of soil sodification (impact on soil infiltration) by STW irrigation was defined as low to moderate (high when groundwater is used), according to Ayers & Westcot (1991). Typically, high concentrations of NH4+
and dissolved organic carbon (DOC) were found in STW.
Soil physical properties
Variation of soil bulk density was insignificant throughout the soil profile and between plots; the mean value was 1,540 kg m-3 for the control plot and 1,490
and 1,510 kg m-3 for the STW and W plots,
respectively. Magesan et al. (1999) found similar results after seven years of irrigation (3,120 mm year-1).
On the other hand, a significant effect of irrigation on soil porosity was detected from the analysis of the curves dθ/dh for the three plots (Table 3); values of the mean pore diameter corresponding to the peak of the pore size distribution curve (value of h when d2θ/
dh2 = 0) revealed an increase of mean pore diameter
in irrigated soil, more pronounced in deeper layers,
Table 1. Soil texture for 25 cm soil layers according to ABNT (NBR 6502/95)
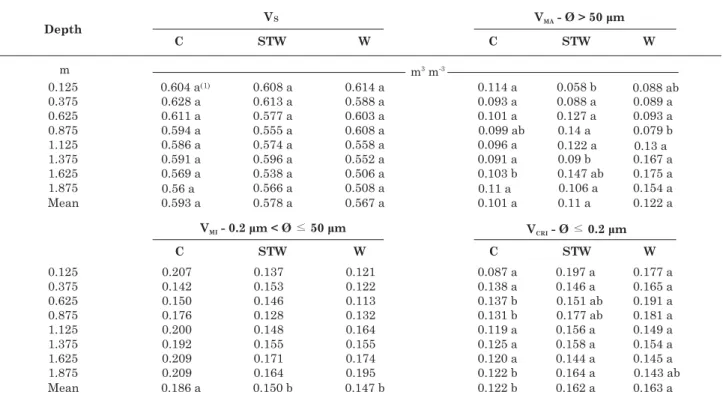
The pore volume for each pore class was calculated from the pore size distribution curves, by summing the volumes obtained for each ri: macropore (VMA;
> 50 µm), micropore (VMI; 0.2–50 µm), cryptopore (VCRI;
≤ 0.2 µm), and solids (VS = 1-(VMA + VMI + VCRI))
volumes (Table 4). The interaction Plot vs Depth was significant for VS, VMA andVCRI.
Obviously, the volume of solids remained unaltered after irrigation porosity almost in the whole profile. The variation reached -7 % and -11 % when soil was irrigated with effluent and water, respectively, which might indicate the beginning of an eluviation process of Na-dispersed clay, as reported by Sumner (1993), in soil sodificated by wastewater irrigation (Gloaguen et al., 2007).
On the other hand, variations in pore size distribution and pore volume were significant. Irrigation caused a decrease in VMA at depths of 0.125 and 0.375 m in the STW plot and at 0.125, 0.375, 0.625, and 0.875 m in the W plot. A similar decrease was mentioned by Jnad et al.(2001), where the authors defined macroporosity as pores with diameter larger than 22 µm after STW irrigation of 1,500 mm.
Jnad et al. (2001) explained the changes in porosity by several factors: (a) Na+ accumulation in the
suspension (Bouma, 1975), (b) deposition of organic matter on the pore surface (Siegrist 1987), and (c) increase of Na+ in the soil and clay dispersion/
expansion (Shainberg & Shalhevelt, 1984). In our study, despite a greater decrease in VMA at the soil surface for the STW plot, the dissolved organic carbon (DOC) input by the effluent cannot explain this process, since a decrease of VMA was also observed in the W plot (very low DOC concentration in treated groundwater). These results are supported by Sort & Alcañiz (1999), who observed no variations in macropores after sewage application despite the high organic C input (226 g kg-1 of sewage). This suggests
that organic C has no effect on this pore class and that the main cause of the modification would be the Na+ soil content in both irrigation waters, resulting
in disaggregation of the soil structure (with consequent change in soil porosity) by dispersing clay minerals, as described by Summer (1993). On the other hand, higher soil macroporosity was observed in the second meter of the soil profile, perhaps due to leaching of organic C and Ca2+, facilitating the
flocculation and formation of macro-aggregates.
Irrigation with STW and with sodic water also resulted in a decrease in VMI, with a difference,
compared to the C plot, of -34 to +8 % in the STW plot (mean value for the soil profile: -20 %, representing a loss of 0.037 m3 m-3 in microporosity), and of -42 to
-7 % in the W plot (mean value for soil profile: -21 %, or -0.040 m3 m-3). These decreases were related to
the reduction of inter-aggregate porosity induced by clay dispersion after the high Na input (2.4 tons by STW, 1.8 tons by sodic water).
probably caused by leaching of salt and DOC to depth of about 1 m, as observed by Gloaguen et al. (2007). Moreover, irrigation led to a wider range of d* values
within the soil profile (CV = 74 % and 57 % for STW plot and plot W, respectively), whereas d* remained
relatively constant in the C plot (16–46 µm), what signifies a vertical variation of soil porosity due to irrigation. Despite the larger mean pore diameter in irrigated soil, lower values of the area under the curves dθ/dh for the plots STW and W (Δarea) evidenced a decrease in porosity almost in the whole profile.
Table 2. Chemical composition of secondary-treated wastewater and of treated groundwater in Lins, São Paulo. Mean values followed by minimal and maximal values in brackets
(1) EC: electric conductivity, TDS: total of dissolved salts, SAR:
Sodium adsorption ratio, DOC: dissolved organic carbon.
The analysis of cryptoporosity indicated an increase of VCRI in the irrigated plots throughout the soil profile,
from +6 to +127 % (mean value for soil profile: +33 %, or +0.040 m3 m-3) and from +17 to +105 % (mean
value for soil profile: +34 or +0.041 m3 m-3),
respectively, for the STW and W plots. These results can be compared to the increase in soil microporosity reported Jnad et al. (2001): they defined microporosity as the volume of pores with diameter smaller than 6 µm, which included cryptoporosity and part of the microposity of the present study. The insignificant differences between the use of sodic STW or sodic water confirmed that pore size distribution is mainly altered by Na+, as mentioned by Jnad et al. (2001), whereas
it seems that the role of organic C concentration is rather insignificant. Cryptopores are related to the intra-aggregate porosity and its increase was probably associated to the aggregate expansion by Na+
intrusion, associated to SAR, a phenomenon explained by Sumner (1993). As demonstrated by Gloaguen et al. (2009), the soil solution in cryptoporosity is much more concentrated than in micro- or macroporosity, as the salt concentrations increase exponentially when the pore diameter decreases. As equivalent increases of Na+, Ca2+ and Mg2+ result in higher SAR (Na+/
√(Ca2+ + Mg2+)), higher impact of Na+ is expected in
cryptoporosity (within the micro-aggregates), resulting in aggregate expansion instead of dispersion, more common at lower Na+ concentrations.
These changes in soil porosity were more apparent in the first soil meter that was directly affected by irrigation and water infiltration, but the impact was also observable to a soil depth of 2 m. Actually, a small increment of Na+ content in the second soil
meter, resulting from the easy leaching of Na+ during
rain events, can rapidly cause structural soil damage due to the common low Ca2+ and Mg2+ contents at
this depth in Oxisols.
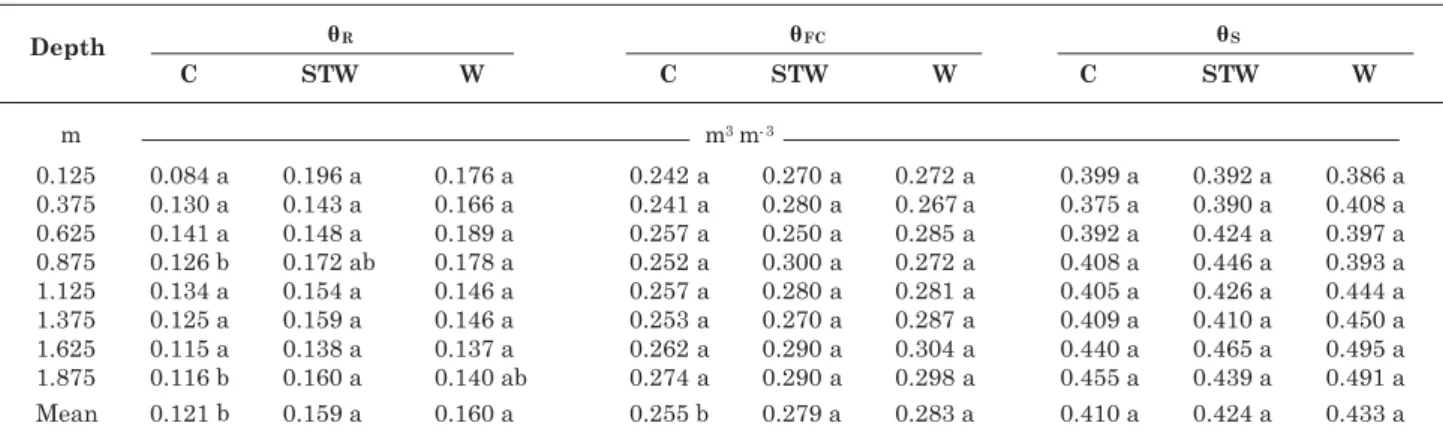
Changes in the pore size distribution evidently modify soil water retention. The direct relation between pore size distribution and the soil water content can be defined as followed: macropores control the water content at soil saturation (θS), micropores
the water content at field capacity (θFC), and
cryptopores the residual water content (θR).
The mean θR values were significantly higher in
the plots irrigated with STW and water than in the control plot (Table 5), as also observed by Jnad et al. (2001). No difference was observed between the W and STW plots (only 0.001 m3 m-3), expressing the
predominant effect of Na+ in θ
R. TheθS values were
also always higher in the W and STW plots than in C, although the differences were not significant. The third characteristic water content, θFC, reveals a
higher water retention capacity in the irrigated plots (STW and W), probably due to the clogging of macropores by clay dispersion, limiting water drainage.
Table 4. Solids (VS), macropores (VMA), micropores (VMI) and cryptopores (VCRI) in the control (C), wastewater-irrigated (STW) and water-wastewater-irrigated (W) plots
CONCLUSIONS
1. Irrigation with treated wastewater and with water (both sodic waters) modifies the soil pore size distribution by slightly increasing macroporosity (pore diameter higher than 50 µm) and decreasing microporosity (0.2–50 µm).
2. The cryptoporosity (< 0.2 µm) increased due to the high Na+ concentration in small pores that causing
expansion of microaggregates.
3. A consequence of changes in soil pore distribution was higher residual soil moisture and higher moisture at field capacity.
LITERATURE CITED
AYERS, R.S. & WESTCOT, D.W. A qualidade da água na agricultura. Campina Grande, Universidade Federal da Paraiba, 1991 (Irrigation and Drainage Paper, FAO, 29) BAGARELLO, V.; IOVINO, M.; PALAZZOLO, E.; PANNO, M.
& REYNOLDS, WD. Field and laboratory approaches for determining sodicity effects on saturated soil hydraulic conductivity. Geoderma, 130:1-13, 2005.
BALKS, M.R.; BOND, W.J. & SMITH, C.J. Effects of sodium accumulation on soil physical properties under an effluent-irrigated plantation. Austr. J. Soil Res., 36:821-830, 1998.
BLAKE, G.R. & HARTGE, K.H. Bulk density. In: KLUTE, A., ed. Methods of soil analysis: Physical and mineralogical methods. Madison, American Society of Agronomy/Soil Science Society of America, 1986. Part 1. p.363-376. BOUMA, J. Unsaturated flow during soil treatment of septic
tank effluent. J. Environ. Eng., 101:967-981, 1975.
Table 5. Water content at field capacity (θθθθθFC), saturation (θθθθθS) and residual water content (θθθθθR) in the control (C), wastewater-irrigated (STW) and water-irrigated (W) plots
(1) At each depth, same letters represent no significant difference between the plots (Tukey test, p < 0.05).
CAMARGO, O.A.; MONIZ, A.C.; JORGE, J.A. & VALADARES, J.M.A.S. Métodos de análise química, mineralógica e física de solos do Instituto Agronômico de Campinas. Campinas, Instituto Agronômico de Campinas, 1986. 94p. (Technical Bulletin, 106)
COOK, F.J.; KELLIHER, F.M. & Mc MAHON, S.D. Changes in infiltration during wastewater irrigation of a highly permeable soil. J. Environ. Qual., 23:476-482, 1994. DARWISH, M.R.; EL-AWAR, F.A.; SHARARA, M. & HAMDAR,
B. Economic-environmental approach for optimum wastewater utilization in irrigation: A case study in Lebanon. Appl. Eng. Agric., 15:41-48, 1999.
FEIGIN, A.; RAVINA, I. & SHALHEVET, J. Irrigation with treated sewage effluent: Management for environmental protection. Berlin, Springer-Verlag, 1991. 224p. FERREIRA, M.M. & MARCOS, Z.Z. Estimativa da capacidade
de campo de Latossolo Roxo distrófico e Regossolo através do ponto de inflexão da curva característica de umidade. Ci. Prática, 7:96-101, 1983.
GLOAGUEN, T.V.; FORTI, M.C.; LUCAS, Y.; MONTES, C.R.; GONÇALVES, R.A.B.; HERPIN, U. & MELFI, A.J. Soil solution chemistry of a Brazilian Oxisol irrigated with treated sewage effluent. Agric. Water Manag., 88:119-131, 2007.
GLOAGUEN, T.V.; PEREIRA, F.A.C.; GONCALVES, R.A.B. & PAZ, V.S. Composição química da solução do solo nas diferentes classes de poro do solo. R. Bras. Ci. Solo, 33:1105-1113, 2009.
GONÇALVES, R.A.B.; FOLEGATTI, M.V.; GLOAGUEN, T.V.; LIBARDI, P.L.; MONTES, C.R.; LUCAS, Y.; DIAS, C.T.S. & MELFI, A.J. Hydraulic conductivity of a soil irrigated with treated sewage effluent. Geoderma, 139:241-248, 2007.
JNAD, I.; LESIKAR, B.; KENIMER, A. & SABBAGH, G. Subsurface drip dispersal of residential effluent: II. Soil hydraulic characteristics. Trans. Am. Soc. Agron. Eng., 44:1159-1165, 2001.
KLEIN, V.A. & LIBARDI, P.L. Densidade e distribuição do diâmetro dos poros de um Latossolo Vermelho, sob diferentes sistemas de uso e manejo. R. Bras. Ci. Solo, 26:857-867, 2002.
LIBARDI, P.L. Dinâmica da água no solo. São Paulo, EDUSP, 2005. 344p.
MAGESAN, G.N.; WILLIAMSON, J.C.; SPARLING, G.P.; SCHIPPER, L.A. & LLOYD-JONES, A.R. Hydraulic conductivity in soils irrigated with wastewaters of differing strengths: Field and laboratory studies. Austr. J. Soil Res., 37:391-402, 1999.
MEENNER, J.C.; Mc LAY, C.D.A. & LEE, R. Effects of sodium-contaminated wastewater on soil permeability of two New Zealand soils. Austr. J. Soil Res., 39:877-891, 2001. MELLO, C.R.; OLIVEIRA, G.C.; RESCK, D.V.S.; LIMA, J.M. &
DIAS JÚNIOR, M.S. Estimativa da capacidade de campo baseada no ponto de inflexão da curva característica. Ci. Agrotec., 26:836-841, 2002.
RICHARDS, L.A. Physical conditions of water in soil. In: BLACK, C.A. Methods of soil analysis. Madison, ASTM, 1965. p.128-152.
SHAINBERG, I. & LETEY, J. Response of soils to sodic and saline conditions. Hilgardia, 52:1-57, 1984.
SHAINBERG, I. & SHALHEVET, J. Soil salinity under irrigation. Processes and management. Berlin, Springer-Verlag, 1984. 358p.
SIEGRIST, R.L. Soil clogging during subsurface wastewater infiltration as affected by effluent composition and loading rate. J. Environ. Qual., 16:181-187, 1987.
SO, H.B. & AYLMORE, L.A.G. How do sodic soils behave? The effects of sodicity on soil physical behavior. Austr. J. Soil Res., 31:761-777, 1993.
SORT, X. & ALCAÑIZ, J.M. Modification of soil porosity after application of sewage sludge. Soil Till. Res., 49:337-345, 1999.
SUMNER, M.E. Sodic soils: New perspectives. Austr. J. Soil Res., 31:683-750, 1993.