UNIVERSIDADE DE BRASÍLIA
FACULDADE DE TECNOLOGIA
DEPARTAMENTO DE ENGENHARIA CIVIL E AMBIENTAL
ANÁLISE DE FLUXO MULTIFÁSICO E MULTIESCALA EM
MEIOS BIMODAIS
SYLVIA REGINA CORRÊA BRANT PEREIRA DE JESUS
ORIENTADOR: MANOEL PORFÍRIO CORDÃO NETO
TESE DE DOUTORADO EM GEOTECNIA
PUBLICAÇÃO: G.TD-132/17
ii
UNIVERSIDADE DE BRASÍLIA
FACULDADE DE TECNOLOGIA
DEPARTAMENTO DE ENGENHARIA CIVIL E AMBIENTAL
ANÁLISE DE FLUXO MULTIFÁSICO E MULTIESCALA EM
MEIOS BIMODAIS
SYLVIA REGINA CORRÊA BRANT PEREIRA DE JESUS
TESE DE DOUTORADO SUBMETIDA AO DEPARTAMENTO DE ENGENHARIA CIVIL E AMBIENTAL DA UNIVERSIDADE DE BRASÍLIA COMO PARTE DOS REQUISITOS NECESSÁRIOS PARA A OBTENÇÃO DO GRAU DE DOUTORA.
APROVADA POR:
_________________________________________ Prof. Manoel Porfírio Cordão Neto, DSc (UnB) (ORIENTADOR)
_________________________________________ Prof. Igor Fernandes Gomes, DSc (UFPE) (EXAMINADOR EXTERNO)
_________________________________________
Prof. João Luiz Armelin, DSc (Furnas Centrais Elétricas S/A) (EXAMINADOR EXTERNO)
_________________________________________ Prof. Márcio Muniz de Farias, PhD (UnB) (EXAMINADOR INTERNO)
iii
FICHA CATALOGRÁFICA
JESUS, SYLVIA REGINA CORRÊA BRANT PEREIRA DE
Análise de Fluxo Multifásico e Multiescala em Meios Bimodais [Distrito Federal] 2017 xx, 122 p., 210x297 mm (ENC/FT/UnB, Doutora, Geotecnia, 2017).
Tese de Doutorado - Universidade de Brasília. Faculdade de Tecnologia. Departamento de Engenharia Civil e Ambiental.
1. Numerical modeling 2. Homogenization 3. Multiscale media 4. Hydraulic behavior
I. ENC/FT/UnB II. Título (série)
REFERÊNCIA BIBLIOGRÁFICA
JESUS, S.R.C.B.P. de (2017). Análise de Fluxo Multifásico e Multiescala em Meios Bimodais. Tese de Doutorado, Publicação G.TD-132/17, Departamento de Engenharia Civil e Ambiental, Universidade de Brasília, Brasília, DF, 122 p.
CESSÃO DE DIREITOS
NOME DO AUTOR: Sylvia Regina Corrêa Brant Pereira de Jesus.
TÍTULO DA TESE DE DOUTORADO: Análise de Fluxo Multifásico e Multiescala em Meios Bimodais.
GRAU / ANO: Doutora / 2017.
É concedida à Universidade de Brasília a permissão para reproduzir cópias desta tese de doutorado e para emprestar ou vender tais cópias somente para propósitos acadêmicos e científicos. A autora reserva outros direitos de publicação e nenhuma parte desta tese de doutorado pode ser reproduzida sem a autorização por escrito da autora.
_____________________________
Sylvia Regina Corrêa Brant Pereira de Jesus SQS 207 Bl. B Apto. 203
iv
DEDICATÓRIA
Dedico este trabalho à minha família toda, pelo amor e apoio incondicionais, mas especialmente ao meu avô, Sylvio Pereira de Jesus, por todo incentivo ao estudo, pela inspiração e pelo exemplo de vida.
v
AGRADECIMENTOS
Primeiramente, agradeço a Deus, por todas as oportunidades que me foram dadas. Agradeço infinitamente à minha mãe, Sandra e meu pai, Sylvio. O carinho, a compreensão, a paciência, as contribuições e, acima de qualquer coisa, o amor incondicional de vocês me fez chegar até esse momento. Quando achei que não ia conseguir, vocês me ajudaram a levantar e a seguir em frente. Sem vocês, eu não seria nada. Obrigada por tudo, sempre! Eu amo vocês!
Agradeço à minha irmã, Sabrina. Você tem um papel essencial na minha vida; é a minha melhor amiga, é a pessoa com quem eu sei que posso contar com a compreensão, com o apoio e que tem as palavras certas, nos momentos certos, da maneira. Obrigada por sempre arranjar um tempinho para mim, seja a milhares de quilômetros de distância, seja depois de muitas horas de trabalho e de estudo. Sou extremamente grata por ter você na minha vida. Não estaria aqui hoje se não fosse por você. Obrigada, Bia! Amo você!
Agradeço muito ao meu namorado Gabriel. Sua compreensão, sua contribuição, sua paciência e seu incentivo me ajudaram a continuar e a ter êxito. Você compartilhou comigo o que é a experiência de fazer essa tarefa. Você colaborou, apoiou, compreendeu e me motivou sempre, em todos os momentos. Se cheguei aqui hoje, devo muito a agradecer a você. Amo você!
Agradeço muito à minha amiga Juliana. Obrigada por me escutar, por me aconselhar, por compartilhar suas experiências com seu próprio trabalho, por ouvir e compreender minhas dificuldades e meus sucessos e, por fim, por me animar para a realização deste trabalho. Suas palavras de incentivo sempre foram importantes e, nesse momento, foram essenciais para eu ter força para continuar! Muito obrigada! Amo muito você! Saudades sempre...
Agradeço imensamente ao meu professor orientador Manoel Porfírio Cordão Neto. Professor, obrigada pelas discussões acadêmicas, pelos aconselhamentos profissionais, por compartilhar suas experiências e por me apoiar ao longo deste trabalho. Você foi essencial para o andamento desta pesquisa. Os mais de 10 anos de convivência que temos são motivo de alegria para mim. Tenho carinho e respeito muito grandes por você!
Agradeço ao auxílio do Professor Igor Gomes pela contribuição durante esta pesquisa. Sua disponibilidade e sua disposição em colaborar foram muito importantes ao longo do processo de elaboração deste trabalho.
vi Agradeço aos professores Márcio, André Assis, Ennio e aos demais professores do Programa de Pós-graduação em Geotecnia da Universidade de Brasília pelo auxílio, pela inspiração e por todo o trabalho ao longo desse percurso.
Agradeço também aos funcionários do programa pelo apoio dado durante a realização desta pesquisa e à CAPES e ao CNPq pelo apoio financeiro.
Agradeço aos amigos e colegas do Programa de Pós-graduação em Geotecnia. Durante o curso e durante a elaboração deste trabalho, suas contribuições foram sempre muito importantes. O carinho e a gentileza de todos vocês auxiliou muito para que eu pudesse cumprir esta jornada. Vocês marcaram muitos momentos divertidos e importantes durante a realização deste trabalho e que sempre me incentivaram para que tudo desse certo. Destaco em especial os amigos Ewerton, Cristina, Robinson, Jaime, Ivonne, Leonardo, Caroline, Camilla e Bruna.
Agradeço à instituição Universidade de Brasília. Acolhedora desde 2005, quando comecei meus estudos de graduação, e de onde saio hoje doutora, sinto-me plenamente realizada ao finalizar este trabalho. Essa instituição representa para mim um marco de vida; representa parte de quem me tornei. Foram na UnB a maior parte dos melhores dias da minha vida até hoje; espero sempre fazer jus aos conhecimentos que consegui adquirir ao longo da minha caminhada dentro desta belíssima instituição de ensino.
Finalmente este trabalho está concluído. Para mim, esse momento representa muito mais que a obtenção de um título, muito mais que subir mais um degrau na escala acadêmica.
O que importa aqui é realmente o percurso que trilhei. Foram momentos de aprendizado de algumas difíceis lições. Muitas vezes, essas pareceram mais do que poderia alcançar. No entanto, tenho a alegria de dizer que superei tudo, superei a mim mesma e, hoje, cá estou, com um pouco mais de maturidade, um pouco mais de conhecimento. Sei que ainda tenho um caminho grande a trilhar; o curso de doutorado, porém, me oportunizou crescimento moral e intelectual inigualáveis.
Foram inúmeras as experiências de vida pelas quais passei ao longo desse tempo; sou grata por todas elas, pois me fizeram tornar-me mais forte. O que importa é o caminho. Não são os fins, são os meios, diferentemente do que alguns pensam.
Àqueles que estiveram ao meu lado, muito obrigada. Obrigada pela paciência, pelo apoio, pelo amor.
Hoje sou mais forte, sou uma pessoa melhor. Não trocaria essa experiência por coisa alguma.
vii Assim, a pesquisa aqui apresentada é muito mais que um trabalho acadêmico para cumprir requisitos necessários para a obtenção de um título. É a realização de um sonho, é uma realização pessoal, é o fim de uma difícil tarefa, é a superação de diversos obstáculos. Representa uma série de aprendizados inesquecíveis, que levarei para sempre comigo. Fico muito feliz e muito honrada com a oportunidade de apresentar este trabalho.
Muito obrigada a todos que de alguma forma contribuíram para que esse trabalho pudesse ser feito e que compreendem a importância disso.
viii
RESUMO
A presente pesquisa tem por objetivo avaliar a adequabilidade de uma formulação matemática para representação de problema de fluxo bifásico em meios multiescala. A abordagem utilizada prevê um modelo com dupla porosidade considerando duas escalas, macro e micro, para os problemas analisados. É prevista uma função de transferência para a interação entre a microescala e a macroescala do problema, além de um parâmetro de homogeneização para a adaptação da ordem de grandeza das equações de fluxo de cada uma das escalas avaliadas. Estuda-se a aplicabilidade de tal formulação para meios porosos multiescala como solos com distribuição de poros bimodal e como meios fraturados (maciços rochosos, reservatórios de petróleo). A formulação matemática apresentada foi implementada no software FlexPDE, um programa para resolução numérica de equações diferenciais parciais por meio do Método dos Elementos Finitos com sistema de malha auto-adaptativa para um domínio e com dados de entrada definidos pelo usuário. Foram realizados testes da formulação matemática implementada com a simulação de ensaios de permeabilidade, de secagem e de molhagem de uma amostra de solo bimodal teórica. Foram utilizados como dados de entrada do modelo numérico informações referentes à distribuição de poros da amostra, advindas de ensaio de porosimetria por intrusão de mercúrio (MIP). A avaliação dos resultados permite concluir que a formulação matemática utilizada é apropriada para a descrição de fluxo em um meio multiescala. A transferência de massa entre as escalas macro e micro dos problemas avaliados é observada e influencia o fluxo total da amostra de solo nos referidos casos. Foi proposta, ainda, uma metodologia para avaliação do grau de saturação de toda a amostra de solo com base nos resultados do grau de saturação de cada escala do meio. Foi possível calcular com precisão o grau de saturação, provando então ser viável a utilização do ensaio de MIP para a estimativa de relação entre grau de saturação e pressão capilar no solo, implicando em definição da curva característica da amostra.
PALAVRAS-CHAVE: meios multiescala, solos bimodais, fluxo bifásico em meios porosos, homogeneização, upscaling.
ix
ABSTRACT
In the present research, a mathematical formulation for representation of biphasic flow problem in multiscale media is tested. The dual-porosity approach is chosen for the referred model, and two scales are considered for simulation purposes, macro and microscale, for a generic porous media. A transfer term is part of the flow equations, and it depicts the interaction of fluid mass between the scales of the medium. Also, a homogenization parameter is defined so as to make possible the adaptation of the flow equations in terms of scale. The suitability of the proposed formulation is assessed for multiscale porous media such as soils with a bimodal pore size distribution and fractured rocks. The mathematical model was implemented on the finite element method solver software FlexPDE. This software provides tools for the solution of differential partial equations with an auto-adaptive generation mesh system for domain of study, problem conditions and input data defined by the user. The formulation was tested with the simulation of permeability tests and drying and wetting trajectory simulations for a theoretical bimodal soil sample. The input data used for the numerical simulations was retrieved from mercury intrusion porosimetry test results. From the results, it is possible to infer that the proposed mathematical model, with the transfer term and homogenization parameter as presented, was appropriate for the description of the flow conditions of a multiscale medium. The mass transfer between the macro and the microscale is proven, and also its influence on the overall hydraulic behavior of the medium is verified. Furthermore, a methodology for determination of the degree of saturation of the entire soil sample based on the results achieved for each scale of the medium is suggested. The accuracy of the results is significant, proving that using the MIP test results as input data for the numerical model is possible. The estimation of the degree of saturation of the entire sample and capillary pressure values is made, and the soil-water characteristic curve of the sample could then be defined via numerical simulation.
KEYWORDS: multiscale media, bimodal soils, biphasic flow in porous media, homogenization, upscaling.
x
CONTENTS
1
Introduction ...1
1.1 Theme contextualization and motivation ... 1
1.2 Research objectives ... 1
1.3 Outline of the thesis... 2
2
Structure of soils and rocks: multiscale approach ...4
2.1 Basic structure of natural porous media ... 4
2.2 Bimodal soils ... 5
2.3 Fractured rocks ... 13
2.3.1 Basic concepts regarding petroleum reservoirs ... 15
2.3.2 Shale reservoirs... 16
2.3.3 Petroleum production in fractured formations ... 18
2.4 Summary ... 19
3
Study of hydraulic behavior of multiscale media ...20
3.1 Standard approach of flow studies in porous media ... 20
3.2 Flow simulation in multiscale media ... 21
3.2.1 Discrete fracture network models ... 23
3.2.2 Dual continuum models ... 24
3.2.2.1 Dual-porosity models ... 25
3.2.2.2 Dual-porosity/dual-permeability models ... 27
3.2.3 Single equivalent continuum model ... 29
3.2.4 Alternative conceptual models ... 30
3.3 Summary ... 31
4
Research methodology ...32
4.1 Methodology outline ... 32
xi
4.3 Summary ... 44
5
Definition of the mathematical model for flow simulation in
multiscale media ...46
5.1 Upscaling: adapted homogenization procedure for multiscale flow mathematical model definition ... 48
5.2 Assembling of the system of upscaled two-phase flow equations and reduction of variables of the problem ... 56
5.3 Assembling of the system of equations for the multiscale approach of the consolidation problem simulation ... 60
5.4 Summary ... 65
6
Flow simulation for multiscale media ...66
6.1 Simulation of flow in a theoretical bimodal soil sample ... 66
6.1.1 Definition of parameters for the theoretical soil sample ... 66
6.1.2 Homogenization parameter sensitivity analysis ... 68
6.1.2.1 Results of the numerical analyses ... 68
6.1.3 Parametric analyses for drying and wetting trajectories simulations for the theoretical bimodal soil sample ... 70
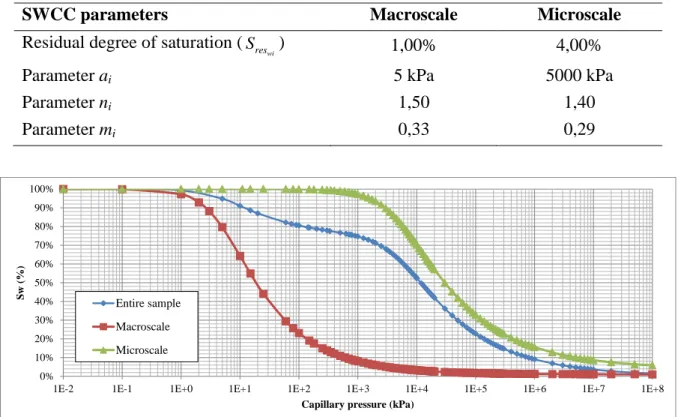
6.1.3.1 Definition of the macro and microscale parameters ... 70
6.1.3.2 Drying and wetting trajectories numerical simulations for the theoretical bimodal soil sample ... 72
6.1.4 Sensitivity analyses for the soil-water characteristic curve parameters ... 84
6.1.4.1 Sensitivity analysis of the residual degree of saturation ... 86
6.1.4.2 Sensitivity analysis of the parameter a ... 88
6.1.4.3 Sensitivity analysis of the parameter n ... 93
6.2 Simulation of flow in bimodal tropical soils ... 96
6.2.1 Homogenization parameter sensitivity analysis ... 97
6.2.1.1 Definition of the bimodal soil samples parameters ... 97
xii
6.2.2 Drying and wetting simulations in bimodal soil samples ... 103
6.2.2.1 Input data for the numerical model ... 104
6.2.2.2 Results of the drying and wetting trajectory simulations ... 108
6.3 Summary ... 111
7
Conclusions and suggestions for further research ... 114
xiii
LIST OF FIGURES
Figure 2.1 - PSD curves of Brasília porous clay in different states (Borges, 2014). ... 9
Figure 2.2 - Fractured rock mass (with sedimentary geological formation). ... 14
Figure 2.3 - Pore size distribution curves for damaged materials (Arson & Pereira, 2013). ... 15
Figure 2.4 - Petroleum reservoir scheme. ... 16
Figure 2.5 - (a) Sandstone formation; (b) Shale formation. ... 16
Figure 2.6 - Shale reservoir. ... 17
Figure 3.1 - Field scale for treatment of problems in fractured media (modified Hoek & Brown, 1997). ... 22
Figure 3.2 - Model of fracture network (Juanes et al., 2002). ... 24
Figure 3.3 - Idealized geometry of the dual-porosity model (Warren & Root, 1963). ... 25
Figure 3.4 - (a) Reinfiltration; (b) Capillary continuity (Uleberg & Kleppe, 1996). ... 28
Figure 4.1 - Overall research methodology scheme. ... 32
Figure 4.2 - Scheme for the Stage 1 of the research. ... 32
Figure 4.3 - Initial domain geometry and mesh definition for calibration of . ... 34
Figure 4.4 - Initial domain geometry and mesh definition for drying and wetting. ... 37
Figure 4.5 - Boundary conditions scheme for the drying and wetting simulations. ... 39
Figure 4.6 - Scheme for the Stage 2a of the research. ... 41
Figure 4.7 - Scheme for the Stage 2b of the research. ... 42
Figure 4.8 - Example of script implemented in FlexPDE (FlexPDE, 2006). ... 44
Figure 5.1 - The idealized periodic medium (Arbogast, 1992). ... 47
Figure 5.2 - Cell of the domain discretization for bimodal soils. ... 49
Figure 5.3 - Schematic representation of the medium with local and global scale side measurements (Salimi, 2010)... 49
Figure 5.4 - Cell of the domain discretization for rocks. ... 50
Figure 5.5 - Schematic representation of the variables (output) of the proposed mathematical model... 59
Figure 5.6 - Schematic representation of the input data for the proposed mathematical model. ... 60
Figure 6.1 - Soil-water characteristic curve for the theoretical bimodal soil sample. ... 67
xiv Figure 6.3 - SWCC for the macro and the microscale of the theoretical bimodal soil sample.
... 71
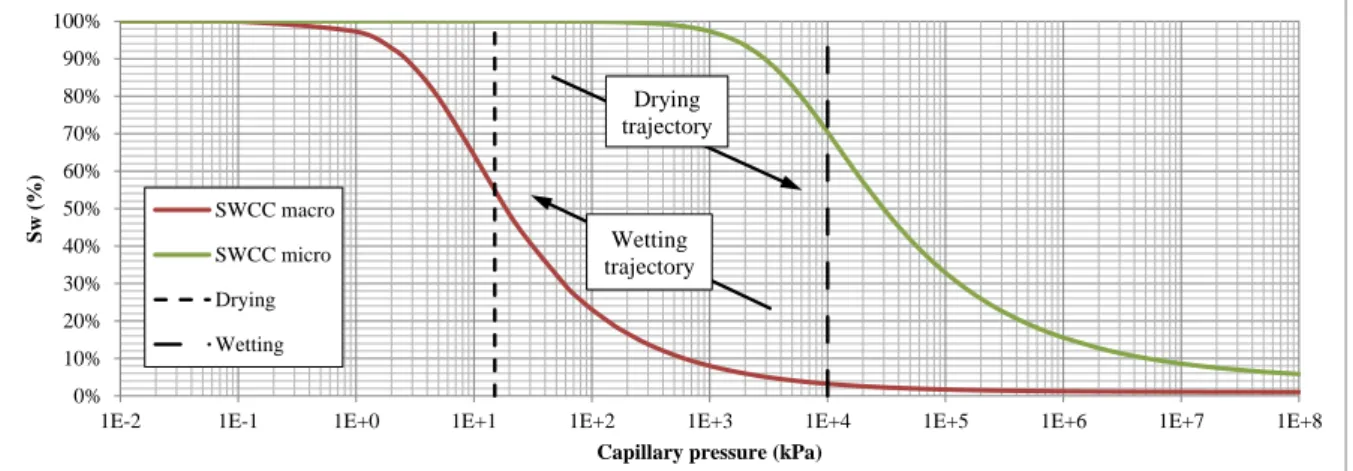
Figure 6.4 - SWCC study for definition of initial condition of the drying and wetting simulations on the theoretical bimodal soil sample. ... 72
Figure 6.5 - Final Sw value of the entire theoretical bimodal soil sample (SWCC versus calculated value) for the drying trajectory simulations - = 0,012. ... 76
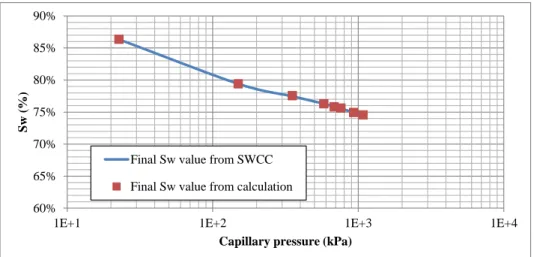
Figure 6.6 - Final Sw value of the entire theoretical bimodal soil sample (SWCC versus calculated value) for the drying trajectory simulations -= 0,072. ... 76
Figure 6.7 - Final Sw value of the entire theoretical bimodal soil sample (SWCC versus calculated value) for the wetting trajectory simulations - = 0,012. ... 81
Figure 6.8 - Final Sw value of the entire theoretical bimodal soil sample (SWCC versus calculated value) for the wetting trajectory simulations - = 0,072. ... 81
Figure 6.9 - Sensitivity analysis for SreswM of the SWCC of the theoretical soil sample. ... 87
Figure 6.10 - Sensitivity analysis for Sreswm of the SWCC of the theoretical soil sample. ... 87
Figure 6.11 - Sensitivity analysis for aM of the SWCC of the theoretical bimodal soil sample. ... 89
Figure 6.12 - Sensitivity analysis for am of the SWCC of the theoretical bimodal soil sample. ... 91
Figure 6.13 - Sensitivity analysis for nM of the SWCC of the theoretical bimodal soil sample. ... 93
Figure 6.14 - Sensitivity analysis for nm of the SWCC of the theoretical bimodal soil sample. ... 94
Figure 6.15 – ew versus diameter of the pores curve for the PN28 sample... 98
Figure 6.16 - ew versus diameter of the pores curve for the NP24 sample. ... 98
Figure 6.17 - PSD curve for PN28 sample. ... 100
Figure 6.18 - PSD curve for NP24 sample. ... 100
Figure 6.19 - SWCC from the data of the MIP test for the PN28 soil sample. ... 106
Figure 6.20 - SWCC from the data of the MIP test for the NP24 soil sample. ... 106
Figure 6.21 - SWCC approximated curve for PN28 sample. ... 107
Figure 6.22 - SWCC approximated curve for NP24 sample. ... 108
Figure 6.23 - Numerical simulation results compared to the SWCC for PN28 sample. ... 109
xv
LIST OF TABLES
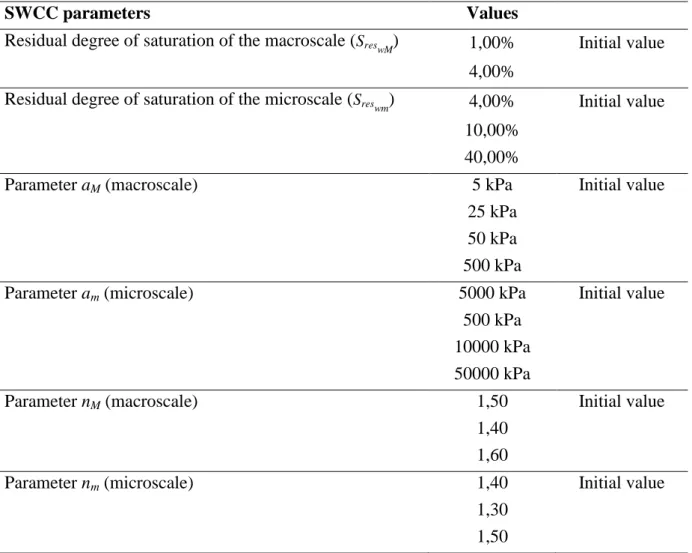
Table 4.1 - Values of w, w and g for the homogenization parameter calibration simulations. ... 35 Table 6.1 - Intrinsic permeability calculation parameters for the theoretical soil sample. ... 68 Table 6.2 - Homogenization parameter calibration data for the theoretical soil sample. ... 69 Table 6.3 - Theoretical homogenization parameter for the theoretical bimodal soil sample. ... 69 Table 6.4 - Density and viscosity values for the wetting and non-wetting fluid phases. ... 70 Table 6.5 - Parameters of the macro and microscale SWCC of the theoretical soil sample. .. 71 Table 6.6 - Initial conditions for drying and wetting simulations for the theoretical sample. . 73 Table 6.7 - Boundary conditions for the drying and wetting simulations for the theoretical bimodal soil sample analyses. ... 73 Table 6.8 - Sensitivity analysis of the Neumann boundary condition for drying simulations on the theoretical bimodal soil sample... 74 Table 6.9 - Data for calculation of wM and wm for drying of the theoretical bimodal sample. 75 Table 6.10 - Results of Sw of the entire theoretical bimodal soil sample for drying. ... 76 Table 6.11 - Input data for the theoretical bimodal soil sample drying trajectory simulation. 78 Table 6.12 - Theoretical bimodal soil sample drying trajectory simulation results... 78 Table 6.13 - Sensitivity analysis of the Neumann boundary condition for wetting simulations on the theoretical bimodal soil sample... 79 Table 6.14 - Data for calculation of wM and wm for wetting of the theoretical bimodal sample. ... 80 Table 6.15 - Results of Sw of the entire theoretical bimodal soil sample for wetting. ... 81 Table 6.16 - Input data for the theoretical bimodal soil sample wetting trajectory simulation. ... 82 Table 6.17 - Theoretical bimodal soil sample wetting trajectory simulation results. ... 83 Table 6.18 - Values for the SWCC parameters sensitivity analyses of the theoretical sample. ... 84 Table 6.19 - SWCC parameters sensitivity analyses input data. ... 85 Table 6.20 - SWCC parameters sensitivity analyses boundary conditions. ... 85 Table 6.21 - Results for Sreswm=40,00% of the SWCC for the theoretical bimodal soil sample. ... 87
xvi
Table 6.22 - Results for aM = 25 kPa of the SWCC for the theoretical bimodal soil sample. . 89
Table 6.23 - Results for aM = 50 kPa of the SWCC for the theoretical bimodal soil sample. . 90
Table 6.24 - Results for am = 10000 kPa of the SWCC for the theoretical bimodal soil sample. ... 92
Table 6.25 - Results for nm = 1,3 of the SWCC for the theoretical bimodal soil sample. ... 94
Table 6.26 - Results for nm = 1,5 of the SWCC for the theoretical bimodal soil sample. ... 95
Table 6.27 - Void ratio values for PN28 and NP24 soil samples. ... 99
Table 6.28 - Intrinsic permeability calculation parameters for PN28 and NP24 samples. .... 101
Table 6.29 - Equivalent hydraulic conductivity calculation parameters for PN28 and NP24. ... 102
Table 6.30 - Homogenization parameter calibration data for PN28 soil sample. ... 102
Table 6.31 - Homogenization parameter calibration data for NP24 soil sample. ... 102
Table 6.32 - Theoretical homogenization parameter for PN28 and NP24. ... 103
Table 6.33 - Calibrated and theoretical homogenization parameter for PN28 and NP24. .. 103
Table 6.34 - Input data for the drying and wetting tests for the PN28 soil sample. ... 104
Table 6.35 - Input data for the drying and wetting tests for the NP24 soil sample. ... 104
Table 6.36 - Boundary conditions for the drying and wetting trajectories simulations for the PN28 soil sample. ... 105
Table 6.37 - Boundary conditions for the drying and wetting trajectories simulations for the NP24 soil sample. ... 105
Table 6.38 - Parameters of the SWCC of the macro and microscale of the PN28 soil sample. ... 107
Table 6.39 - wM and wm for drying and wetting of the PN28 and NP24 soil samples. ... 108
Table 6.40 - Results of degree of saturation of the PN28 soil sample for drying and wetting. ... 109
Table 6.41 - Results of degree of saturation of the NP24 soil sample for drying and wetting. ... 110
xvii
LIST OF SYMBOLS AND ABBREVIATIONS
ai - Air entry value for the i part of the domain.
ai, mi, ni - Calibration parameters of the soil-water characteristic curve.
BBM - Barcelona Basic Model.
BExM - Barcelona Extended Model.
b - Transfer parameter of the - fluid phase.
D - Diameter of the pores that are intruded with this value of pressure p. DFM - Discrete fracture model.
e - Total void ratio.
E - Elasticity modulus.
Emv - Microscale volumetric strain for a two-dimensional analysis. ExM - x-component of strain.
EyM - y-component of strain.
Ev - Macroscale volumetric strain for a two-dimensional analysis.
Eiv - Volumetric strain of i part of the domain. e0i - Initial void ratio.
enw - Non-wetting fluid void ratio. ew - Wetting fluid void ratio.
ei - Void ratio of the i part of the domain. eM - Void ratio parameter of the macroscale. em - Void ratio parameter of the microscale. FDM - Finite differences method.
FEM - Finite element method.
g - Gravity.
G - Shear modulus.
g - Gravity vector.
h - Hydraulic head of the - fluid.
hi - Hydraulic head of the - fluid phase of the i part of the domain. {J} - Dubbed hydraulic gradient.
i - Part of the domain (m is used for microscale; M is used for macroscale)
K - Intrinsic permeability of the medium.
[k] - Hydraulic conductivity tensor.
Ki - Intrinsic permeability of the i part of the domain. Km - Intrinsic permeability of the microscale.
KM - Intrinsic permeability of the macroscale.
kri - Relative permeability of the - fluid phase of the i part of the domain. kwt - Equivalent hydraulic conductivity.
ki -
Hydraulic conductivity of the - fluid phase (w stands for wetting fluid and nw, for non-wetting fluid) of the i part of the domain.
l - Size of the side of the cell (local, microscale).
L - Size of the side of the entire domain of study (global, macroscale).
xviii
M - Macroscale – macropores or fracture network. MIP - Mercury intrusion porosimetry.
MSR - Multiple subregion method.
mvi -
Coefficient of volume compressibility of the - fluid phase of i part of the domain.
ne - Effective porosity of medium.
ni - Inclination of the curve for the i part of the domain.
nw - Non-wetting fluid.
p - Absolute value of pressure of the non-wetting fluid. pc - Capillary pressure within the sample.
pci - Capillary pressure of the i part of the domain pcM - Capillary pressure of the macroscale.
pcm - Capillary pressure of the microscale.
Pnwi - Pressure of the non-wetting fluid phase of the i part of the domain. PSD - Pore size distribution density curve.
pwi - Pressure of the wetting fluid phase of the i part of the domain. pwM - Wetting fluid pressure of the macroscale.
pwm - Wetting fluid pressure of the microscale. p - Pressure of the fluid.
pi - Pressure of the - fluid phase of the i part of the domain. pM - Pressure of the - fluid phase acting on the microscale. pm - Pressure of the - fluid phase acting on the microscale.
p - Average value of fluid pressure acting on the porous medium.
p g
- Piezometric head.
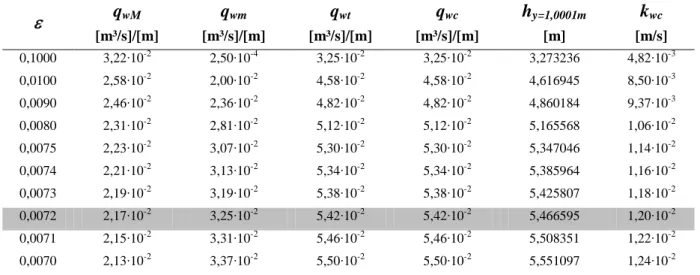
qwc - Total fluid flow rate of region 2. qwm - Microscale fluid flow.
qwM - Macroscale fluid flow.
qwt - Total fluid flow rate of region 1. {q} - Specific discharge vector.
r - Micropore radius average value.
R - Macropore radius average value.
ri - Radius of the pore of the i part of the domain. s - Geometric parameter of the transfer term.
Snwi - Degree of saturation of the non-wetting fluid of the i part of the domain. SnwM - Degree of saturation of the non-wetting fluid in the macroscale.
Snwm - Degree of saturation of the non-wetting fluid in the microscale. Sreswi - Residual degree of saturation of the wetting phase in the i part of the
domain.
Sw - Degree of saturation of the wetting fluid phase of the entire domain. SWCC - Soil-water characteristic curve.
Swi - Degree of saturation of the wetting fluid of the i part of the domain. SwM - Degree of saturation of the wetting fluid of the macroscale.
xix
S - Saturation degree of the fluid.
S - Degree of saturation of the - fluid phase of the i part of the domain.
uM, vM -
Displacements in the x- and the y-direction, respectively (using the macroscale as reference for the analysis).
V - Total volume of the medium.
Ve - Effective volume.
{ve} - Effective velocity vector. Vintrusion -
Volume of the non-wetting fluid that intruded the sample during the mip procedure.
Vsolids - Volume of the solids of the studied sample. v - Velocity of the - fluid phase.
i
v - Velocity of the - fluid phase of the i part of the domain.
w - Wetting fluid.
wM - Volume fraction average weight parameter of the macroscale. wm - Volume fraction average weight parameter of the microscale. WRC - Water retention curve.
xM - Coordinates for the global scale. xm - Coordinates for the local scale. y - Elevation.
z - Altimetric head.
ei - Void ratio variation rate.
hwi -
Variation of the hydraulic head for the interval of analysis within the domain.
- Cell volume.
m - Matrix block volume.
M - Surrounding fracture volume.
- Fluid phase.
m - Smooth internal boundary piece.
- Homogenization parameter.
- Porosity of the medium.
i - Porosity of the i part of the domain.
M - Porosity of the macroscale.
m - Porosity of the microscale.
- Specific weight of the soil
- Specific weight of the - fluid phase.
M M
x y
- Distortion component of strain.
- Lamé coefficients.
w - Water viscosity.
- Viscosity of the - fluid phase.
nw - Contact angle between the porous medium and the non-wetting fluid.
w - Water specific mass.
- Specific mass of the fluid.
nw - Superficial tension of the non-wetting fluid.
' M x , ' M y
xx macroscale as reference for the analysis).
M x ,yM , M M x y -
Total stress components in the indicated directions (using the macroscale as reference for the analysis).
- Poisson’s ratio.
- Differentiation operator for the global, macro scale.
s
1
1 INTRODUCTION
1.1 THEME CONTEXTUALIZATION AND MOTIVATION
The soil formation processes a porous medium undergoes are regulated by different factors, being the climate conditions the most significant of them. The temperature and the pluviometric changes that a certain area are subjected to reflect greatly on the assembly of the particles that composes the soils.
Specifically for tropical climate regions, these considerations must be evaluated when studies of the behavior of the soil are made, so as to take into account the effects that the pedogenetic process has over the porous formation overall structural arrangement.
Tropical soils usually present a bimodal structure, with macropores and micropores. This unique type of assembly of particles affects the hydraulic behavior of these soils. Therewith, the models designed for reproduction of behavior of this specific sort of soil should be able to mathematically incorporate the multimodal distribution of pores that is characteristic of them.
Models with this kind of approach are known as multiscale mathematical models and they can be used not only for the behavior analysis of bimodal soil samples, but also for the assessment of hydraulic behavior of fractured media, such as rock masses.
If one takes into account that a fractured medium presents a porosity, dual-permeability arrangement, with two scales forming it – the macroscale representing the fractures of the medium and the microscale representing the rock matrix, the multiscale numerical model can easily be adapted for the analysis of flow in fractured media.
The study of multiscale numerical models is revealed to be a field of great importance in the assessment of hydraulic behavior in Geotechnics. It is specifically important for regions with porous formations that are notoriously known for their dual-porosity flow conditions, and reproducing this type of behavior with numerical simulation is significant for the enhancement of flow models for porous media.
1.2 RESEARCH OBJECTIVES
The main objective of this research is to define an analysis methodology for the simulation of the hydraulic behavior of multiscale porous media. In the present research, the
2 focus resides on the evaluation of fluid flow within bimodal soil samples. It is highlighted that the model proposed in the present research is appropriate for application in any type of multiscale porous medium, fractured rocks included. For that purpose, a mathematical model for the representation of the hydraulic behavior of a two-scale porous medium is presented. Some tests are performed in order to verify the validity of the proposed model, as well as the accuracy in terms of reproducing the particular of the two-scale structure of the studied samples.
Considering the latter, the specific objectives of this research are:
To evaluate the accuracy of the model chosen for flow simulation;
To verify the effects of the bimodal soil structure in terms of flow prediction;
To perform analyses of two-phase flow (wetting and non-wetting) in order to verify the implication the bimodal soil structure may cause on the overall hydraulic behavior of the medium;
To perform sensitivity analyses of the hydraulic parameters for the referred flow simulations.
1.3 OUTLINE OF THE THESIS
This doctorate thesis is divided in 7 chapters, with the outline as follows.
In Chapter 1, the theme of the research is presented with a brief contextualization and motivation of the study. The research objectives are based on this and are also presented in the mentioned chapter.
In Chapter 2, some concepts related to the structure of soils and rocks are presented. Tropical soils are addressed with an overview of their formation process and the implications it has on its particle arrangement, characterizing their bimodal structure. Then, rock masses are presented, with a focus on petroleum reservoir rocks. The importance of flow studies in reservoirs is highlighted in terms of economic feasibility and behavior prediction of the formations on field. For that reason, the multiscale structure of the reservoir rock is presented with a brief discussion on the petroleum reservoir formation process, followed by a description of the shale reservoir main characteristics and considerations regarding petroleum production in fractured formations.
The Chapter 3 is focused on the definition of flow models for porous media. The different approaches one can address to the description of hydraulic behavior of soils and
3 rock masses are presented, distinguishing the dual continuum models and pointing out their relevance for representation of flow in multiscale media.
The research methodology is presented in Chapter 4, with detailing of the steps for the development of the presented research and the presentation of the numerical tool that will be used for the simulations during the research.
The mathematical model for flow in multiscale media for the analyses proposed for this research is presented in Chapter 5. The chosen model approach for this research is the representation of two scales in the flow problem: macro and microscale. The equations are established following this premise and an upscaling procedure is then performed so as to make the mathematical model solution possible. An adapted homogenization procedure is then shown, with the introduction of a transfer term between macro and microscale that enables coupling between the scales. This formulation is presented in two different forms: one specific for the flow problem, and one for the consolidation problem.
In Chapter 6, the results of the simulations proposed for the development of the research are presented and discussed. Following the methodology steps, the main aspects that are studied related to the hydraulic behavior of bimodal soils and fractured media are verified. Sets of simulations for reproducing permeability tests, drying and wetting trajectories tests are made. At first, the simulations are made with the purpose of validating the numerical model and verifying its accuracy. For that reason, theoretical data is used in this stage of the research. Then, the tests are made with data of real samples for comparison purposes. At this stage, the goal is to verify the possibility of reproduction of the two-scale porous media hydraulic behavior with the proposed numerical model.
The conclusions made from the main results achieved in this research are presented in Chapter 7. Also, a discussion over the topics reported throughout this thesis is proposed. Based on them, some suggestions for further research are proposed.
4
2 STRUCTURE OF SOILS AND ROCKS: MULTISCALE
APPROACH
2.1 BASIC STRUCTURE OF NATURAL POROUS MEDIA
The analysis of behavior of natural porous media is a broad field of study and it requires knowledge and expertise related to their structure. Details of the formation process of rocks and soils could be important so as to justify the cause of the characteristic behavior of different geological formations.
In that matter, some basic concepts regarding soils and rocks are presented in this section for description of the main aspects reported in this research project.
Rocks can be defined as aggregates of minerals consolidated into masses of different sizes and shapes. The minerals found in this type of geologic formation depend on the availability of chemical compounds at the time of its formation process. Different types of rocks can be differentiated not only by the type of minerals they are constituted, but also by their arrangement. This could change depending on the levels of pressure and temperature they are subjected to during the rock formation process (Beavis, 1985). These definitions are important because they could determine the way each rock presents itself and affect significantly the mechanical and the hydraulic behavior of this medium.
The igneous rocks are formed due to the cooling and solidification processes of magma. The sedimentary rocks are formed with the deposition and cementation of material, mostly minerals from the alteration process of other rocks (weathering followed by erosion) and organic matter. The metamorphic rocks are formed with the transformation of existing rocks of any type due to temperature and/or pressure changes that could cause modification in the type and the arrangement of the minerals (Mitchell & Soga, 2005).
The petroleum reservoirs are sedimentary rocks. The study of their hydraulic behavior may be conditioned to its formation process, given the fracture network structure that might have been established within. The hydraulic behavior of this type of geological formation is one of the topics of interest of the present research and it is discussed in Section 2.3.
After going through weathering processes, the rock then is altered to a point that it can be assumed, for engineering studies purposes, as soil. Soil is then defined as a constant-evolving porous medium, formed due to pedogenetic processes. The formation can change its characteristics drastically and significantly differ from its rock of origin. The minerals suffer
5 physical and chemical transformation over time with the action of factors such as climate, topography, and living organisms (Beavis, 1985).
The climate is one of the most important factors of soil formation specifically for tropical soils. The pluviometric trends and the temperature fluctuation throughout time define characteristics of porosity and permeability particular to this type of soil. Some of these soils tend to present their porosity pattern with a bimodal structure, with a remarkable discontinuity in the distribution of the sizes of its pores. In general, when analyzing the distribution of pores of tropical soils, two distinct sizes of pores are dominant over the sample: the macropores and the micropores.
This type of structure could influence the mechanical and the hydraulic behavior of the porous medium. Therewith, behavior prediction analyses should be performed with different approaches so as to reproduce this peculiarity of the soil (Mitchell & Soga, 2005; Bagherieh et al., 2009; Choo et al., 2016). Bimodal soils and its particularities regarding hydraulic behavior are presented in Section 2.2.
The overall structure of porous media, and the variation of their features, implies on specific studies so as to represent their behavior. When specifically addressing the hydraulic behavior of porous media, there are several models which can be used for depicting what can be observed on the field (Bagherieh et al., 2009; Choo et al., 2016).
The study of the multiscale approach is used in the present research as an alternative for reproduction of hydraulic phenomena observed in both bimodal pore size distribution soils and fractured reservoirs.
2.2 BIMODAL SOILS
As already mentioned, the weathering processes rocks go through gradually transform them into soil. Soil is then defined as being a naturally-formed porous medium. It can go through various processes throughout geological time; nevertheless, its formation process follows the premises already discussed. The soil is composed by a solid skeleton of grains or particles (minerals) with an arrangement that characterizes the porous structure.
The soil voids or pores are filled with fluids, gases and liquids; the studies of behavior prediction of natural porous media are made for verification of the equilibrium and conservation conditions of the solid skeleton and the fluids within the pores (Beavis, 1985).
6 One of the areas that are explored is the study of tropical soils. Their formation process and all changes they are subjected overtime are extremely specific and this makes the physical behavior of this type of soil quite distinct. Tropical soils are structured soils: the arrangement of the soil particles is organized into, at least, two scales – macro and microstructure – and this influences significantly the physical behavior of the soil (Mitchell & Soga, 2005; Romero & Simms, 2008; Bagherieh et al., 2009; Choo et al., 2016).
Considering the specificities of the compositional and structural characteristics of tropical soils, it is paramount that the main parameters used for the definition of the arrangement conditions of a soil be described.
The soil structure can be defined as the spatial arrangement of the solid particles that compose the soil including the implication the shape, the size, the orientation, the degree of cementation, and the presence of interstitial fluids of the particles may inflict on the overall arrangement of the sample.
When considering the structure of a tropical soil, the main feature pointed out as important for behavior prediction analyses is the size of the pores or voids of the porous medium. This specific characteristic helps the evaluation of the macro and microstructure of soil, making it possible to more appropriately estimate mechanical and hydraulic behavior of the porous medium and, therefore, effort has been made so as to define the distribution of size of the pores of soil sample (Mitchell & Soga, 2005; Romero & Simms, 2008).
Delage & Lefebvre (1984) established the following definition for the soil structure:
Aggregates: a pack of soil grains or particles; when referring to clays, the soil aggregate is a pack of the minerals that form the solid structure of the soil;
Interaggregate pores: the void between one aggregate and other; the interaggregate pores are the macropores of the sample;
Intra-aggregate pores: the void within an aggregate; the intra-aggregate pores are the micropores of the sample.
These definitions help depicting the structure of the soil and better understanding its physical behavior. Many constitutive models are related to pore size and follow it as basis for definition of the premises of the model. The macropore and micropore structural arrangement of some soils may significantly affect the overall behavior of the soil and, therefore, it should be taken into account for an accurate representation of this type of porous medium.
7 The Barcelona Basic Model – BBM (Alonso et al., 1990) and Barcelona Extended Model – BexM (Alonso et al., 1999) are examples of this. Specifically in BExM, the approach chosen by the authors validates the importance of considering the macro and microstructure of the soil in order to improve the accuracy of the representation of the effects of the soil particle arrangement in the overall physical behavior of the porous medium. Alonso et al. (1999) highlight the significant effect the microstructure inflicts on the macrostructure of the soil samples.
Considering all mentioned, the study of tropical soils requires the measurement of the size of the pores. It is a way of evaluating the type of structural arrangement the soil presents and adapting the models used for representation of its physical behavior. Hence, the study of the soil can be performed with the information related to its microstructure.
There are several techniques that can be used for microstructural analysis of a porous medium. Granulometric distribution curve, water retention curve (WRC), Mercury Intrusion Porosimetry (MIP) are some examples.
The procedure of the MIP test implies on applying a pressurized volume of mercury so as it can intrude the pores of the sample. During the test, the collected data are the pressure of intrusion of the mercury and the volume of mercury intruded for this pressure value. With these data, it is possible to calculate all parameters needed for establishing the relationship between the size of the pores and the permeability of the sample.
The Mercury Intrusion Porosimetry (MIP) technique is cited by Zhang et al. (2006) as one of the alternatives that are the most interesting for studying the microstructure of the soil. The technique simplicity in applying is allied to results that allow a quantitative interpretation of the arrangement of the soil particles.
It is also important to highlight that the MIP technique has been largely employed in research related to the determination of the structure of soils (Delage & Lefebvre, 1984; Prapaharan et al., 1985; Griffiths & Joshi, 1989; Delage et al., 1996; Romero, 1999; Penumadu & Dean, 2000; Simms & Yanful, 2001; Buenfil, 2007; Mascarenha, 2008; Romero & Simms, 2008; Koliji et al., 2010; Sivakumar et al., 2010; Alonso et al., 2011; Alonso et al., 2013) and also as input data for the definition of the Water Retention Curve (Prapaharan et al., 1985; Kosugi & Hopmans, 1998; Romero, 1999; Simms & Yanful, 2002; Mascarenha, 2008; Romero & Simms, 2008; Silva, 2009; Romero et al., 2011; Borges, 2014).
The data collected with the application of the MIP technique treated for the calculation of the diameter of the pores of the sample. This can be mathematically represented as shown
8 with Washburn’s equation (Diamond, 1970; Griffiths & Joshi, 1989), as shown in Equation (2.1) (it is mentioned later in Sections 6.1.1 and 6.2.1).
4 nwcos nw c p D
(2.1)where: pc is the absolute value of pressure of the non-wetting fluid (mercury in the case of MIP), nw is the superficial tension of the non-wetting fluid (0,484 N/m for mercury), nw is the contact angle between the porous medium and the non-wetting fluid (values vary from 139° to 147° for mercury - the value of nw used in this research is 140°) and D is the diameter of the pores that are intruded with this value of pressure pc.
It is also possible to relate the results of the MIP test with the Water Retention Curve for the soil sample. Delage & Lefebvre (1984) describe a procedure for this and it has been chosen for the analyses proposed in the present research. It is thoroughly explained and detailed when results of this research are presented in Section 6.2.1.1.
There are some disadvantages of the MIP technique that are discussed by Romero & Simms (2008) and also mentioned by Simms & Yanful (2004). They are mostly related to difficulties of the operator that performs the tests or to limitations of the technique itself:
The limitation of pressure of the equipment may represent a difficulty for penetration of the intrusion fluid in the smallest pores of the sample;
The minimum pressure value for functioning of the equipment may limit the precision of the measurements of the quantity of macropores;
Isolated pores (surrounded by impermeable solid particles) usually are not intruded by the pressurized fluid and, therefore, are not measured as part of the voids of the sample;
The quantity of micropores can be overestimated due to a lag in the intrusion of fluid in the small pores: if the micropores are connected to small pores, it takes longer for the firsts to be intruded;
There are difficulties in the preparation of the samples;
The pressure of the intrusion fluid may affect the soil structure.
When specifically addressing bimodal structured soils, as is the case of the soil samples studied in the present research, one must take into account the importance of evaluation of the graphic representation of the distribution of the size of the pores. This curve is known as Pore
9 Size Distribution Density and it represents the quantity of pores related to different diameters for a soil sample. A Pore Size Distribution Density curve (PSD) for a bimodal soil presents itself as depicted in Figure 2.1. The x-axis corresponds to the size of the diameter of the pores, measured in micrometers, and the y-axis corresponds to the PSD parameter.
Figure 2.1 - PSD curves of Brasília porous clay in different states (Borges, 2014).
The PSD parameter is calculated as shown in Equation (2.2):
log nw i e PSD D (2.2)
where: enw is the void ratio parameter of the sample related to the non-wetting (intruded) volume (non-wetting fluid void ratio) and D is the diameter of the pore of the i part of the domain (making reference to the macroscale - subscript M - and microscale - subscript m).
When observing the format of the pore size density distribution curve (Figure 2.1), the bimodal structure of the referred soil sample is clearly seen. The soil studied in this research (Section 6.2) has had its samples collected in the same region of study of Borges (2014) and, therefore, it presents the same structural characteristics.
The results of the MIP test are used for description of the pore distribution of the sample, and, consequently, its microstructure. It could be interesting to employ these data for definition of other parameters that could help in the description of the hydraulic behavior of bimodal soil samples. The void ratio should then be addressed, given it is related to the arrangement of the solid particles and volume of the pores of the sample. It is a parameter that can directly correlate the microstructure to the overall hydraulic behavior of the medium.
10 With that, the relationship between the non-wetting fluid and the wetting fluid void ratio is established so as to define the total void ratio value as shown in Equation (2.3):
nw w
e e e (2.3)
where: ew is the wetting fluid void ratio - the void ratio parameter related to the wetting fluid volume within the entire sample, enw is the non-wetting fluid void ratio - the void ratio parameter related to the non-wetting fluid volume within the entire sample and e is the total void ratio of the sample.
Also, the determination of the non-wetting fluid void ratio can be made with the results of the MIP test. This parameter could be employed for later definition of the quantity of wetting fluid within the sample. The non-wetting fluid void ratio is determined as shown in Equation (2.4): int rusion nw solids V e V (2.4)
where: enw is the void ratio parameter of the sample related to the non-wetting fluid volume (non-wetting fluid void ratio), Vint rusion is the volume of the non-wetting fluid that intruded the sample during the MIP procedure and Vsolids is the volume of the solids of the studied sample.
In addition, the calculation of the quantity of wetting fluid within the voids of the sample can be related to the values of the wetting void ratio and the capillary pressure within the sample, as shown in Equation (2.5):
1 1 M m M m m M w n m n m c c M m e e e p p a a (2.5)
where: pc is the capillary pressure within the sample, ai is the air entry value for the i part of the domain (i=m, M; m is used for microscale; M is used for macroscale) and ni is the inclination of the curve for the i part of the domain.
11 The parameter mi can be calculated as shown in Equation (2.6):
1 1 i i m n (2.6)
where: ni is the inclination of the curve for the i part of the domain.
The void ratio parameter can be defined in terms of the two scales the hydraulic behavior of the medium is described. This is shown in Equation (2.7):
M m
e e e (2.7)
where: eM is the void ratio parameter of the macroscale, e is the total void ratio parameter of the sample (total void ratio) and em is the void ratio parameter of the microscale.
Then, the degree of saturation of the soil sample can be determined with the relationship established between the void ratio values as expressed in Equation (2.8):
w w e S e (2.8)
where: ew is the wetting fluid void ratio and e is the total void ratio parameter of the sample (total void ratio) and em is the void ratio parameter of the microscale.
Finally, considering there is an association established between the size of the pores and its distribution, and the permeability of the soil sample, this should be discussed so as to accurately define all parameters that interfere in the hydraulic behavior of the bimodal medium. With that, García-Bengochea et al. (1979) suggest that the hydraulic conductivity of the medium can be calculated based on the premises as shown in Equation (2.9):
2 1 1 8 i i i i i i k K f r r
(2.9)where: ki is the hydraulic conductivity of the - fluid phase (w stands for wetting fluid and
nw, for non-wetting fluid) of the i part of the domain (m stands for microscale and M,
12 weight and is the viscosity of the -fluid phase, i is the porosity of the i part of the domain and ri is the radius of the pore of the i part of the domain.
The f r term of Equation (2.9) is a function that mathematically represents the
idistribution of the size of the pores of the sample. This function is assumed as the pore size distribution density (PSD), already shown in Equation (2.2).
The
21 i
i i
f r r
term of Equation (2.9) statistically represents the second moment of the referred data (size of the pores of the sample).The porosity of soil sample can be calculated based on the values of void ratio as depicted in Equation (2.10): 1 i i i e e (2.10)
where: ei is the void ratio of the i part of the domain.
As to proceed to the specific calculation of the intrinsic permeability of each scale for the soil sample, only part of the terms that define Equation (2.9) are considered for calculation purposes. This rearrangement of Equation (2.9) is shown in Equation (2.11).
2 1 1 8 i i i i i K
f r r (2.11)where: Ki is the intrinsic permeability of the i part of the domain, i is the porosity of the i part of the domain and ri is the radius of the pore of the i part of the domain.
Besides from the hydraulic implication the microstructure has on the overall hydraulic behavior of bimodal soils, Borges (2014) also reports the importance evaluating the microstructural mechanical behavior of the soil for the verification of the effects of void ratio changes and distortions of the soil samples. Given there is a degree of influence the microstructure exerts on the macrostructure of the soil, this may help better understanding the macroscopic mechanical and hydraulic behavior of the medium.
13 The study of the microstructure of the soil is extremely relevant for a more comprehensive approach of the occurring physical phenomena of the porous medium. The microstructure of the soil may influence significantly the overall behavior of bimodal soils and, therefore, the techniques employed for the definition of pore size and pore size distribution are essential for an accurate approach in the models designed for this type of soil. Specifically referring to the importance of the microscale influence on the overall behavior of the medium, it should be pointed out that the multiscale approach involves the definition of a model for the mathematical description of the each scale of the medium with a different equation. Given the hydraulic behavior of the medium comprises both scales and their respective phenomena simultaneously, it is essential that the mathematical model addresses this particularity.
Also, a coupling term is used for the interaction between scales, referred to as a transfer term; this consideration leads to the verification of influence of the hydraulic behavior of the microscale on the macroscale and on the overall flow conditions of the porous medium.
Different mathematical model approaches are presented in Chapter 3, and the model specifically chosen for the study proposed in the present research is presented in Chapter 5.
2.3 FRACTURED ROCKS
The geologic formation process of rocks is mainly affected by pressure and temperature conditions and availability of minerals. This combination of factors implies on specific features that may influence the mechanical and hydraulic behavior of this porous medium.
The heterogeneity of the rocks due to its formation process reflects on their features; most rocks have natural fractures. A natural fracture is a macroscopic planar discontinuity in a rock due to its deformation or to physical diagenetic processes. The natural fractures could influence the hydraulic behavior of the rock, given their porosity and permeability characteristics. In some cases, the natural fractures could be a preferential path for fluid flow within this porous medium. Therewith, it is important to evaluate their influence on the physical behavior of the rock (Salimi, 2010).
In terms of fluid flow, it can be established that this type of geologic formation presents dual porosity, with distinct types of flow behavior in each of them, one referring to the rock matrix, another referring to the fractures (Rosa et al., 2006). The natural fractures represent, in terms of hydraulic behavior, a flow network already established in the rock formation.
14 Natural fractures are identified with different investigation methods depending on the scale of the fracture. Large-scale fractures are detected with seismic methods, whereas small-scale fractures are identified in wellbores extracted on field (Borbiaux et al., 2005). This classification of fractures is shown in a fractured sedimentary rock mass in Figure 2.2.
Figure 2.2 - Fractured rock mass (with sedimentary geological formation).
In many cases, the model of geological fracture network is reproduced based only on the data retrieved from investigation. Nevertheless, interpolation and extrapolation of data are required in order to cover areas where there is less information (Borbiaux et al., 2005).
Large-scale fractures are usually easier to be identified. Small-scale fractures are often more difficult to be observed due to their geometric characteristics. Despite of any difficulties, a model with great accuracy should include both types of fractures, characterizing a multi-scale fracture network. Considering the complexity regarding reproduction of both scales of fracturing of the medium should influence significantly fluid flow simulation.
This characterizes the rocks as naturally fractured porous media, with multiscale features regarding its hydraulic behavior. Simultaneously, any transformation processes the rocks may undergo can alter its initial condition and affect the hydraulic behavior of the medium. The deformation the rock may suffer affects its solid matrix and, therefore, the porosity and permeability patterns of the medium.
This subject is specifically addressed by Arson & Pereira (2013) and Pereira & Arson (2013). These authors show that damaged porous rocks present PSD curves with two distinct modes, as represented in Figure 2.3. The format of these curves resembles the PSD curve of bimodal soils (Figure 2.1). This could justify the fact that a multiscale hydraulic model is appropriate for depicting the fluid flow within fractured rocks.
Large-scale fracture Small-scale fractures
15 Figure 2.3 - Pore size distribution curves for damaged materials (Arson & Pereira, 2013).
To sum up, the main idea is that rocks are naturally fractured media that present a structure with distinct overall hydraulic behavior depending on their porosity and permeability characteristics. So as to address these singularities, the hydraulic mathematical model should take into account the multiscale features observed in this type of medium.
The assessment of the hydraulic behavior of rocks is particularly important in the petroleum industry. The evaluation of the fluid flow within reservoir rocks helps with the estimates of petroleum production and also verification of its profitability, with suggestions of the most adequate methods for petroleum recovery in such reservoirs (Chen et al, 2006). Therewith, some aspects related to petroleum reservoirs, shale reservoirs, and petroleum production are addressed in Sections 2.3.1, 2.3.2 and 2.3.3.
2.3.1 BASIC CONCEPTS REGARDING PETROLEUM RESERVOIRS
A petroleum reservoir is created from the sedimentation process of organic matter and minerals. These compounds form sedimentary rocks when subjected to appropriate conditions of pressure and temperature over geologic time. Moreover, the decomposition of the organic matter within the sediments produces a mixture of gas and oil composed by hydrocarbons and metals known as petroleum.
At first, these fluids stay within the pores of this layered geological formation. The rock in which the petroleum is produced is known as source rock (Dake, 1978). Given its low density, petroleum has the tendency of migrating overtime from its generation zone (source rock) to other porous regions of the geological formation (reservoir rock). In a typical
F: porosity
Ftot: total porosity L: length of the cracks Lp: length of primary, natural cracks Lc: length of cracks after rock damage
16 geological formation of a petroleum reservoir, petroleum stays confined in a region due to the existence of low permeability rocks (cap rocks) that overlain the reservoir rock, as shown in the scheme portrayed in Figure 2.4.
Figure 2.4 - Petroleum reservoir scheme.
Masses of sedimentary rock are usually highly inhomogeneous due to its formation process: each layer may have different types of compounds. Also, this type of rock is known to have bedding planes, the boundaries or contact surfaces between layers of sediment. The bedding planes are usually tightly closed, but they might also contain filling material (Beavis, 1985). Examples of sedimentary rocks are sandstones and shales, depicted in Figure 2.5.
(a) (b)
Figure 2.5 - (a) Sandstone formation; (b) Shale formation.
2.3.2 SHALE RESERVOIRS
The process of layering of minerals and other compounds in a region with proper temperature and pressure provide the optimum condition to the formation of sedimentary rocks. When the geological formation is composed by clayey minerals in its majority, it is