Contribution of cork oak plantations installed after 1990 in Portugal to the Kyoto
commitments and to the landowners economy
Marta Baptista Coelho
⁎
, Joana Amaral Paulo, João Henrique Nunes Palma, Margarida Tomé
Centro de Estudos Florestais, Instituto Superior de Agronomia, Universidade Técnica de Lisboa, Tapada da Ajuda, 1349-017 Lisboa, Portugal
a b s t r a c t
a r t i c l e i n f o
Article history:
Received 15 November 2010 Received in revised form 15 July 2011 Accepted 27 October 2011
Available online 23 December 2011 Keywords:
Cork oak
New plantations area Wood
Carbon sequestration Kyoto protocol
Cork oak stands are a part of the agroforestry ecosystem in Portugal, characterized by a low crown cover from cork oak trees, managed towards cork production, and sometimes in combination with grazing. In recent years, European Union policies gave impetus to a large area of new cork oak plantations, which have been established mainly for cork production purposes, and consequently with higher stand density than tradition-al agroforestry systems. These plantations are important not only for cork production but tradition-also for the carbon sequestered by these slow growing forests that won't be harvested for wood production. Thinning operations will be needed to avoid excessive inter-tree competition and wood extracted from these thinning may also provide income for the owners. In the present study, carbon sequestered and wood volumes resulting from thinning were estimated for the next 70 years. Three scenarios of different annual afforestation rates and dif-ferent site indexes were tested. The resulting values for the considered scenarios show that, if the plantation rates are maintained, new cork oak plantations will have an important contribution to the Portuguese com-mitments to providing CO2offsets under the Kyoto protocol. Additionally, due to the increasing values of
ini-tial density in new cork plantations, cork oak forests will produce a significant volume of wood that may become an important contribution to the landowners' income.
© 2011 Elsevier B.V. All rights reserved.
1. Introducion
Cork oak (Quercus suber L.) is distributed along the western part of the Mediterranean basin. In Portugal the cork oak stands are one of the most important forest types, located mainly south of the Tagus river. According to the last National Forest Inventory (AFN, 2010), pure stands and mixed stands dominated by cork oak have an estimated area of 715,923 ha, which represents 23% of the total forest area in the country.
The main product of the cork oak stands is cork, a thick and con-tinuous layer of suberised cells produced by the cambium, which is extracted from the outer bark of the tree. Portugal is the world major cork producer and exporter, being responsible for 52.5% of the world total cork production (Pereira et al., 2008). For this reason, cork has a large importance in the Portuguese economy, being re-sponsible for approximately 12,283 jobs only in the transformation industry (not including jobs related to the cork harvesting or produc-tion) and representing 2.3% of the total value of Portuguese exports (APCOR, 2007).
Cork oak is a slow growing species, well adapted to adverse climatic conditions including hot summers and drought, on shallow and low fertility soils. Along with their economic and social value,
cork oak stands play an important role in the ecological protection, water retention and soil conservation of large areas in southern Portugal and are important reservoirs of fauna andflora biodiversity (Aronson et al., 2009; Pereira, 2007). Considering the edapho-climatic conditions of the sites where the trees grow and the exploi-tation of cork that is made, the values of wood growth achieved by the species are quite noticeable. The very high wood density also provides a very high capacity for biomass production, thus revealing the cork oak as an interesting species for multiple objective forestry, includingfixing carbon (Pereira, 2007).
In Portugal, traditional cork oaks are grown in silvopastoral agro-forestry systems called montados, originated mainly from natural regeneration or artificial broadcast seeding. In typical montados, cork oaks are maintained at low density and low crown cover in order to combine cork production with agriculture or grazing. According to the 2005 National Forestry Inventory (AFN, 2010), average tree density is 66 trees ha− 1for pure stands. When analyzing thefield plots measured in this inventory, just 2% of the pure cork oak stands have a crown cover percentage higher than 50%.
Since 1990 the artificial regeneration of cork oak stands by plantation or direct seeding, with higher stand densities, increased due to the European Union policies and incentives for afforestation of set-aside agricultural lands. Plantation rates in the periods 1990–1994 and 1995–2000 were 24,000 and 60,000 ha (Pereira et al., 2009), corresponding to annual afforestation rates of 4800 and 10,000 ha year− 1. Official values are not available for the period
⁎ Corresponding author. Tel.: +351 213653356; fax: +351 213645000. E-mail addresses:martabcoelho@isa.utl.pt(M.B. Coelho),joanaap@isa.utl.pt
(J.A. Paulo),joaopalma@isa.utl.pt(J.H.N. Palma),magatome@isa.utl.pt(M. Tomé). 1389-9341/$– see front matter © 2011 Elsevier B.V. All rights reserved. doi:10.1016/j.forpol.2011.10.005
Contents lists available atSciVerse ScienceDirect
Forest Policy and Economics
2000–2005, but areas estimated in the 2005 National Forest Inventory (AFN, 2010) indicate that cork oak have increased between 1997 and 2005. Clearly, that these plantations are important not only for future cork production but also for the carbon sequestered as these long-lived forests won't be harvested for wood production. Wood from thinnings will be harvested to avoid excessive inter-tree competition and may also provide additional income for owners, if total wood availability will be enough to support commercial production.
According to the National Forest Strategy (Direcção Geral dos Recursos Florestais, 2007), the target for the year 2030 is to achieve an area of 780,000 ha of cork oak stands (pure and dominated by cork oak). The difference between this value and the 669,108 ha of pure and dominant cork oak stands estimated in 2005 (AFN, 2010) is 64,000 ha.
Spatially explicit analysis, using biophysical variables and land use datasets (Corine Land Cover), shows that 409,000 ha are still available where cork oak could be planted to create productive agroforestry systems (seeSection 2.3). This potential plantation area can be very important under the article 3.3 of the Kyoto Protocol, which allows countries to use carbon capture in forests to meet their greenhouse gas emissions by sources and removal by sinks resulting from direct afforestation and reforestation taking place since 1990.
In the present study, carbon sequestered and wood volumes resulting from thinnings were estimated for the next 70 years with the regional forest simulator SIMYT (Tomé et al., 2010). Cork oak growth was assumed to be expressed by an average yield table, obtained with an existing growth model—SUBER (Tomé, 2004)—and information from average cork oak plantations installed after 1990 in Portugal. Several scenarios of plantation rates were tested. The effect of the average site index considered to build the yield table used by the regional simulator was also studied.
The objective of these simulations was to analyze the potential contribution of the new cork oak plantations to the Portuguese com-mitments for the Kyoto Protocol. Additionally, due to the increasing values of planting density in new cork oak plantations leading to the possibility to use wood from thinnings, it was also an objective to analyze if the new cork oak forests can produce a significant vol-ume of wood that may be considered for new uses, alternatives to fuelwood (Knapic et al., 2011), and become an important contribu-tion to the landowners' economy. The results of these simulacontribu-tions are thought to be important as a support for defining policies to promote new plantations with this species, as well as changes in national legislation regarding cork oak management.
2. Materials and methods 2.1. The SIMYT simulator
The SIMYT simulator (regional SIMulator based on a Yield Table) was used in order to estimate carbon stock changes originated from new plantations after 1990 (Tomé et al., 2010). This simulator allows the prediction of the evolution of the stands within a region or country, under one or several scenarios.
The use of this simulator assumes the following inputs:
• Average yield table: estimates of the most important stand variables for each one of the ages along the whole rotation.
• Estimates of the areas: estimates of the areas for each one of the ages along a rotation, at the starting year of the simulation. Since the objective was to study the impact of new plantations installed since 1990, the starting situation was represented by setting to zero all the areas in each age of the yield table, except age zero that corresponds to the area planted in 1990. Using the values of the total plantation area for the period of 1990–1994 given by
Pereira et al. (2009), the annual mean value of 4800 ha was used for the year 1990.
• Scenario: set of annual values of the drivers for each year of the simulation period. The drivers are: wood demand, area burned, area of new plantations, and percentage of land that is abandoned. Before a simulation, the user must define the following simulation parameters: starting year, length of the simulation (years), minimum age for harvesting, minimum age for industrial use afterfire, usual age for harvesting, proportion of wood used afterfire, proportion of non industrial stands harvested, proportion of uneven-aged stands harvested, mean annual increment of non-industrial and uneven-stands. Some of these simulation parameters, and the corresponding values used in the present research are shown onTable 1. Note that the parameters related to uneven and non-industrial stands are not relevant in this study, since the new plantations are even-aged stands.
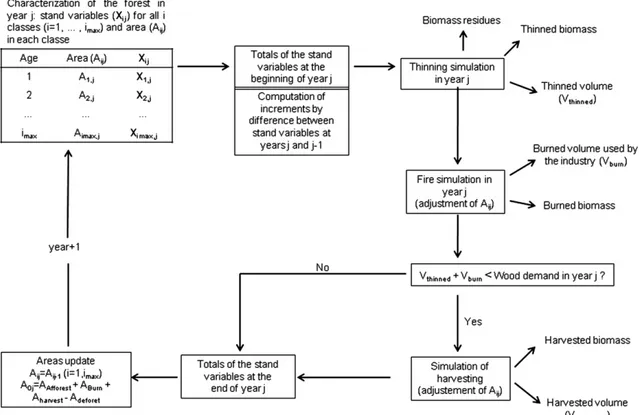
The simulator works like a matrix model with one year age classes. In this way, in each year j all the area in one age class i (Aij) will move
to age class i + 1, except the area that is burned and/or harvested. The projection is made for each year through a series of steps, considering the four different drives included in the simulator:
1. Initial computation of the totals of the stand variables. It starts by computing the totals of the stand variables at the end of year j for each age class i, by multiplying the value per hectare by the area correspondent to age class i.
2. Estimation of volume harvested from thinnings. Thinnings occur according to the management expressed in the yield table and are assumed to take place in the middle of the year. The volume harvested from thinnings (Vthinned) together with the value from
the thinned biomass is computed by the simulator and corre-sponds to output variables.
3. Simulation offires and volume harvested from fires applied to each age class. Fire occurrence is assumed not to depend on stand age. The percentage of area destroyed by wildfires in year j is com-puted, and this percentage is applied to each age class i. A per-centage of the volume existing in the burned stands is assumed to be usable by the industry. This value, designated as the burned volume used by the industry (Vburn), together with the value from
the biomass harvested in burned areas, are computed by the simulator and corresponds to output variable.
4. Simulation of harvesting. At this stage, the simulator compares the sum of the volume harvested and burned volume used by the in-dustry (Vthinned+ Vburn) to the wood demand in year j. If the sum
is less then to the wood demand, the SIMYT simulates thefinal harvest, starting by simulating the harvest in the non-industrial and uneven-aged stands (not used in the present case study). The harvest then continues in the even-aged stands, from the oldest to the ones presenting the minimum allowed age for industrial use. This operation is maintained only while the wood demand value has not been achieved, and produces more output variables: harvested volume (Vharvested) and biomass residues
for each type of stand. Note that simulations of harvesting are not used in this study, as cork oak is not managed for wood production. 5. Simulation of growth. Growth simulation is made by updating the areas corresponding to each age. Areas for each age class at the
Table 1
Parameters used by the SIMYT simulator, and corresponding values used for the simu-lation of new plantations of cork oak.
Initial year of projection 1990
Length of projection 70
Minimum age for harvest 120
Minimum age for industrial use afterfire Not relevant for this simulation % of use by industry afterfire Not relevant for this simulation % of non-industrial stands harvested per year Not relevant for this simulation % of uneven-aged stands harvested per year Not relevant for this simulation Maximum age for industrial stands 140
end of the year arefirst obtained by discounting the proportion of the initial area that is burned and harvested. The updating of the areas for each age, for the beginning of next year, is then made by moving the areas from age i to age i + 1. The area in age i = 1 is estimated as the sum of the areas harvested plus the difference between afforestation and deforestation.
Fig. 1shows the structure and functioning of the SIMYT simulator. For a full description seeTomé et al. (2010).
2.2. Yield table
The“average” yield table for new plantations of cork oak was built using the version v4.0 of the SUBER model (Tomé, 2004), to which the tree biomass, root biomass, volume (AFN, 2010) and crown width (Tomé et al., 2007) equations used by the National Forest Inventory were added.
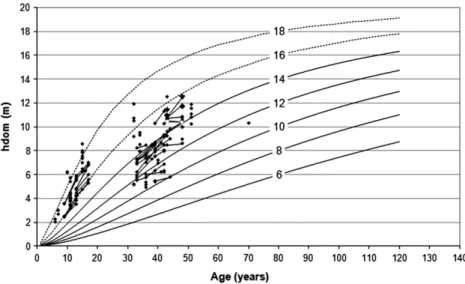
Fig. 2 represents the site index curves developed by Sánchez-González et al. (2005) for Spain and that have been tested with success for Portugal (Tomé, 2004) jointly with the information from permanent plots of cork oak for which age is known. Thefigure clearly shows that generally the new plantations (younger than 20 years) show better site indices than the older ones. Based on the data from these permanent plots, established in new plantations, an average site index of 15 m, at a base age 80, was considered.
In order to build the“average” yield table, the SUBER model was run using the following management assumptions:
– Initialization based on a stand simulated with characteristics similar to the average of the permanent plots established in young plantations: a site index close to the average site index for new plantations (15 m at 80 years), 277 trees per hectare at 17 years of age and with a diameter distribution close to that of the permanent plots with characteristics more similar to these values;
– A linear growth from age 0 to age 17 was assumed for all the variables, except for N. The initial density was assumed to be
666 trees per hectare as recommended by the Ministry of Rural Development in the RURIS program (Ministério da Agricultura do Desenvolvimento Rural e das Pescas, 2001). As cork oak plantations undergo a very high mortality at planting and during thefirst years of the stand, we assumed an initial mortality rate of 20% followed by a linear decrease to 277 trees per hectare at 17 years of age;
– First debarking occurring when the quadratic mean diameter of the stand was greater than 22.3 cm (according to the Portuguese legislation, cork cannot be extracted before the tree perimeter at breast height attains 70 cm, which corresponds to 22.3 cm of diameter);
– Debarking rotation equal to 9 years (the most usual interval between cork debarking in the cork oak stand management, and the minimum value allowed by the Portuguese legislation); – The debarking coefficients (ratio between debarking height and
tree perimeter at breast height) equal to: 2 for the first cork extraction, 2.5 for the second cork extraction and 3 for the third and consecutive extractions. These values correspond to the max-imum values allowed by the Portuguese legislation;
– Thinning operation and debarking of the stand occurring simulta-neously at the same year of the simulation.
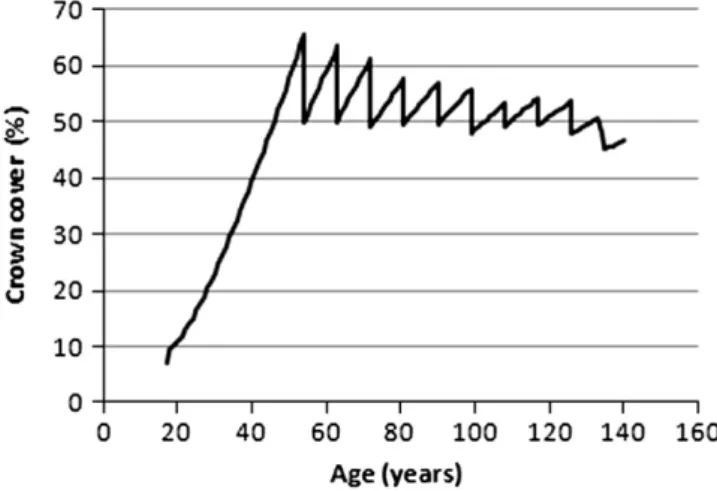
– Stand density defined in order to maintain the percent crown cover close to 50%. Thinnings will take place whenever crown cover at the age of debarking will be higher than 50%. This percent crown cover is close to the maximum recommended by
Natividade (1950)and it is within the values recommended by the Rural Development Plan for cork oak plantations—RURIS —(Ministério da Agricultura do Desenvolvimento Rural e das Pescas, 2001).
– The values of the stand variables (N—number of trees per hectare, G—basal area, V—volume and W—biomass) corresponding to the thinnings/debarking were calculated by the difference between the respective value before and after the thinning/debarking. – According toFortes et al. (2004)150–200 years is considered as the
upper limit for quality cork production; 140 years were considered
for all the simulations in the present study. However, as the pro-jection length was 70 years, this value is not relevant for the simulations.
Table 2shows the most important variables of the yield table.
Figs. 3, 4 and 5show the evolution of some variables of the yield table used in the simulations.Fig. 3shows the basal area (G) and basal area under bark (Gu) per hectare. It clearly shows the debarking and harvesting years.Figs. 4 and 5show the evolution of the number of trees per hectare and the crown cover percentage, respectively.
Using the same assumption, two more yield tables were built for site indices below and above the one considered as the average: 14 m and 16 m respectively. These yield tables were used to analyse the impact of different site indices in the results, using scenario 2, the medium in terms of annual area planted.
2.3. Potentially available area to expand cork oak plantations
Productive distribution of cork oak was estimated with the overlay of different datasets, queried based on literature thresholds.
Four datasets were used to define the distribution namely altitude from a Digital Elevation Model (NASA-METI, 2009), average annual temperature, pH (APA, 1974; APA, 1979) and average annual precip-itation (Nicolau, 2002). Thresholds for each dataset consider intervals from Natividade (1950), Oliver (1980) and Correia and Oliveira (2002). To avoid an overestimation of the cork oak distribution, as present in the Portuguese ecological chart for cork oak (APA, 1984), we reduced the published range of the thresholds to keep the distri-bution conservative and consistent to the present distridistri-bution of cork oak in the last Portuguese Forest Inventory (AFN, 2010). As a result we considered the limit of altitude as 600 m, ranges from 16 °C to 19 °C for average annual temperature, pH between 5.6 and 7.3 and a precipitation higher than 600 mm. The intersection of the different datasets with the thresholds resulted in the grey area in
Fig. 6.
Afinal intersection was made between this grey area and four layers of the Corine Land Cover dataset (EEA, 2000): non-irrigated arable land, pastures, natural grasslands, moors and heathland, sparsely vegetated areas. This allowed obtaining the land where new cork oak plantations could occur, estimated as 409,000 ha (black area inFig. 6).
Fig. 2. Comparison betweenSánchez-González et al. (2005)site index curves for Spanish cork oak and permanent plot data established in Portuguese stands. Observations from the same plot are connected with straight lines (Cañellas et al., 2008).
Table 2
Yield table for new plantations of cork oak. Base age 80 is indicated in bold (S = 15).
t hdom N G V W Ww Wb (years) (m) (ha− 1) (m2ha− 1) (m3ha− 1) (Mg ha− 1) (Mg ha− 1) (Mg ha− 1) … … … … 20 4.89 274 2.67 8.89 10.46 2.45 3.21 21 5.18 275 3.00 10.10 11.73 2.86 3.55 22 5.48 275 3.34 11.38 13.02 3.31 3.89 23 5.77 275 3.75 12.87 14.59 3.83 4.31 24 6.05 274 4.14 14.36 16.08 4.39 4.68 25 6.33 275 4.55 15.91 17.59 5.00 5.04 26 6.61 275 4.97 17.56 19.17 5.66 5.41 27 6.88 275 5.45 19.41 21.04 6.40 5.86 28 7.14 275 5.97 21.39 23.02 7.20 6.33 29 7.40 275 6.48 23.38 24.94 8.06 6.75 30 7.65 272 7.01 25.47 26.94 8.99 7.18 … … … … 79 14.86 105 21.57 114.77 148.7 102.41 24.73 80 15.00 105 22.49 117.49 153.08 105.79 25.39 81 15.01 85 15.97 105.48 140.81 99.1 22.68 … … … … 139 17.64 39 20.67 133.39 252.25 201.05 34.08 140 17.66 39 21.35 134.84 255.70 203.98 34.48
t—age; hdom—dominant height; G—basal area; V—standing volume (without cork/bark and above or equal to 7.5 cm of diameter); W—total aboveground biomass; Ww—wood biomass; Wb—cork/bark biomass.
2.4. Scenarios
The simulation of the impact of the new plantations was made under the following assumptions in what concerns the drivers: 1. Wood demand
Since the main product resulting from the cork oak management is cork and not wood, the wood demand value in this simulation was set equal to zero. The demand for cork oak wood exists (mainly for firewood and recently for some specific industries) but it is not considered a driver for harvest. The wood comes from thinnings, sick and dead trees.
2. Planted area
From 1991 to 1994 the same value as for 1990 was assumed; from 1995 to 2000, the annual mean was calculated with the total plan-tation area for that period given byPereira et al. (2009); from 2001 to 2060 the annual planted area differs according to each of the considered scenarios:
Scenario 1 5000 ha year− 1 which corresponds to the annual planted area needed to achieve, in 60 years (from 2001 to the end of simulation), an area of 300,000 ha of new plantations, approximately 73% of the area estimated as the available land for cork oak plantations in year 2000.
Scenario 2 2500 ha year− 1 which corresponds to the annual planted area needed to achieve the cork oak total
area pointed as the objective for 2030 by the National Forest Strategy (Direcção Geral dos Recursos Florestais, 2007). This rate was obtained taking into account this value and the total cork oak area (pure and mixed stands dominated by cork oak) in 2005 according to the last National Forest Inventory (AFN, 2010). This same rate was used from 2001 to the end of the simulation.
Scenario 3 no additional plantations from 2001 to 2060 were considered. This scenario is used to study the effect of no plantation since the year 2001.
3. Deforestation
It was considered that deforestation occurs on the new plantations after 1990 with the same intensity as in the other stands. Annual deforestation rate was computed as the ratio between the annual deforested area (value for the 1986–2000 period) and the total forest area for 2005/2006, both fromPereira et al. (2009). This method leads to an annual deforestation rate of 0.12%.
4. Forestfire
Forestfire areas in the new plantations in the period from 1990 till 2008 were calculated using the annual percentage of burned area in relation to the total cork oak area fromAFN (unpublished data). Cork oak stands have shown a low vulnerability tofire (Silva and Catry, 2006), namely due to the understory removal for crop or pasture cultivation that results in a very low fuel load. This explains the lowfire occurrence in cork oak stands, when compared to other forest systems in Portugal. The period 2003–2005 represents a partic-ular situation in the total burned area of cork oak stands, mainly caused by extreme meteorological conditions during thefire season. A large percentage of the areas of cork oak stands burned during this period were located in non-cultivated sloping regions, with a fuel load higher than in typical montados (Silva and Catry, 2006) and in new plantations.
The same risk of forestfire occurrence for the new plantations was considered for the years of the period from 2009 to 2070. This was estimated as the average of the percentages of cork oak area burned area in the period 1990–2008, excluding the two best and the two worst years plus 15%. Excluding the two best years makes the simulations conservative, and excluding the two worst years acknowledges the fact that they are situations that hardly occur in cork oak plantations.
Fig. 7shows the burned area resulting from the application of this percentage in the total area of new plantations. Since the total area is the same for the three scenarios till the year 2000, the burned area till that year is also the same in the three scenarios. From 2001 to the end
Fig. 3. Evolution of basal area above (G) and under bark (Gu), from the“average” yield table used in the simulations (site index 15 m), built using the version 4.0 of the SUBER model.
Fig. 4. Evolution of number of trees per hectare (N), from the“average” yield table used in the simulations (site index 15 m), built using the version 4.0 of the SUBER model.
Fig. 5. Evolution of crown cover percentage, from the“average” yield table used in the simulations (site index 15 m), built using the version 4.0 of the SUBER model.
of the simulation, the annual burned area in the three scenarios is proportional to the total area available in each year.
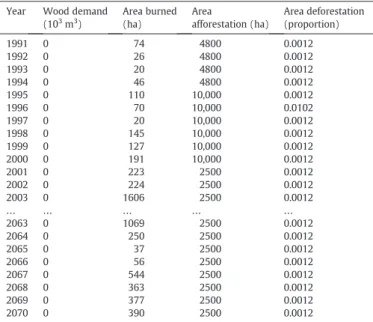
As an example, values considered for scenario 2 are partially shown inTable 3. Note that carbon stock losses correspond to the aboveground and belowground biomass. All the aboveground bio-mass of the stands that are burned and/or harvested and/or debarked was considered to be lost. All the belowground biomass was also considered to be lost. In fact, the root system will decompose very slowly but due to the lack of information about the soil processes, this conservative option was thought to be better.
3. Results and discussion
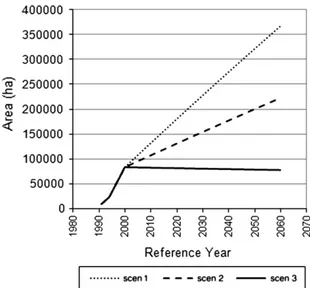
The total area of new plantations in 2060 obtained with scenarios 2 and 3 represents 60% and 20%, respectively, of the total area
obtained with scenario 1 which is 367,682 ha. The area corresponding to scenario 3 decreases from 2001 to the end of the simulation due to the absence of plantation and a constant level of deforestation and forestfires occurrence.Fig. 8presents the evolution of the areas of new plantations resulting from the three scenarios, considering an average yield table with a site index of 15 m.
Fig. 9shows the results of the simulations made with the aver-age yield table (site index 15 m) and the three plantation scenarios described above, for the evolution of the standing volume (top diameter of 7.5 cm), harvested volume (top diameter of 7.5 cm), carbon stock and sequestered carbon in the forest for the three scenarios.
The differences in the harvested volumes obtained for each sce-nario only occur from 2055 forward. In fact, during thefirst 11 years of harvesting, starting in 2044 for all the scenarios, the area being harvested is the one planted from 1990 to 2000 which is the same for all the scenarios. From 2055 onward, the harvested volume reflects the differences in the plantation area of the three scenarios.
Fig. 6. Productive distribution area of Quercus suber L. (grey—2,800,000 ha) on available land for new cork oak plantations (black area—359,000 ha).
Fig. 7. Evolution of the burned area of new cork oak plantations, for each of the three considered scenarios (seeSection 2.4).
Table 3
Scenario 2 used in the simulation of new cork oak plantations. Year Wood demand
(103 m3 ) Area burned (ha) Area afforestation (ha) Area deforestation (proportion) 1991 0 74 4800 0.0012 1992 0 26 4800 0.0012 1993 0 20 4800 0.0012 1994 0 46 4800 0.0012 1995 0 110 10,000 0.0012 1996 0 70 10,000 0.0102 1997 0 20 10,000 0.0012 1998 0 145 10,000 0.0012 1999 0 127 10,000 0.0012 2000 0 191 10,000 0.0012 2001 0 223 2500 0.0012 2002 0 224 2500 0.0012 2003 0 1606 2500 0.0012 … … … … … 2063 0 1069 2500 0.0012 2064 0 250 2500 0.0012 2065 0 37 2500 0.0012 2066 0 56 2500 0.0012 2067 0 544 2500 0.0012 2068 0 363 2500 0.0012 2069 0 377 2500 0.0012 2070 0 390 2500 0.0012
In percentage, the volume harvested with scenario 1 is an increase of 21% to 38% compared to scenario 2 and of 53% to 107% compared to scenario 3, in the same year.
In 2059, the volume available from thinnings varies from a value of 240,000 m3year− 1in scenario 1 to 140,000 m3year− 1in scenario
3. This last value represents a volume that will be certainly available, since it results from plantations that effectively took place and will need future thinning operations.
Recent research studying the potential of cork oak for the pro-duction of quality wood components reveal that due to the cork oak wood characteristics (moderate to small taper, straight to significantly crooked stems and wood defects), the batch yields final values are largely variable (Knapic et al., 2011). These values mainly depend on the log diameter, products manufactured and bucking options, but the results presented byKnapic et al. (2011)
point out that the usage of cork oak wood for the production of small size wood products is possible. If consumers interest about this alternative wood increases, a market niche can start to develop. Wood selling can then start to result as an additional source of income for landowners and as an alternative usage of cork oak wood to fuelwood, the same way that happens for other oak species along the country.
The differences between the three scenarios are more evident if one considers the standing volume and carbon stock variables (Fig. 9). It is important to notice the future impact of the plantation areas that, for this species, are very much influenced by national and European Union policies. Being a slow growing species with afirst significant economic income around the age of 40 years, economic
Fig. 8. Evolution of the area of new cork oak plantations, for each of the three considered scenarios (seeSection 2.4).
Fig. 9. Evolution of standing volume, harvested volume, carbon stock and carbon sequestered for each of the three considered scenarios (seeSection 2.4), considering the“average” yield table (site index 15 m).
incentives for afforestation both for forest or of set-aside agricultural lands are essential to encourage Portuguese landowners (majority is private) to invest on new cork oak plantations.
The carbon sequestered in the forest shows an increasing evolu-tion in all scenarios until the year 2043, the year before the beginning of the thinnings of the plantations installed in thefirst years of the simulations. In scenario 1, from that year until the end of the simu-lation it oscillates around 250 Gg C year− 1, according to the har-vested volume in each year. Scenarios 2 and 3 show a decreasing tendency from 2044 until 2054, more pronounced in scenario 3. By 2056, scenario 1 presents the maximum value observed in this simulation: 309 Gg year− 1, which is 49% above the carbon seques-tered in scenario 2 and almost 3 times the value obtained with scenario 3.
According to a resolution of the Portuguese Government (DR, 2006), the expected contribution of carbon sequestration from forests for year 2010, considered as an average year for thefirst commitment period, is 3355 Gg CO2eq (915 Gg of C). The carbon sequestered by
the cork oak stands planted after 1990, accounted under article 3.3 of the Kyoto protocol, depending of course on the scenario assumed for the future plantation rates, can attain values that will be an important contribution for the Portuguese commitments. This contribution is particularly important if we take into account that the increasing trend observed in the wood demand from other species from the Portuguese forest, combined with a high incidence
of forestfires (Silva and Catry, 2006), has led to carbon sequestration values from the fast growing plantations that are not relevant (Tomé et al., 2010).
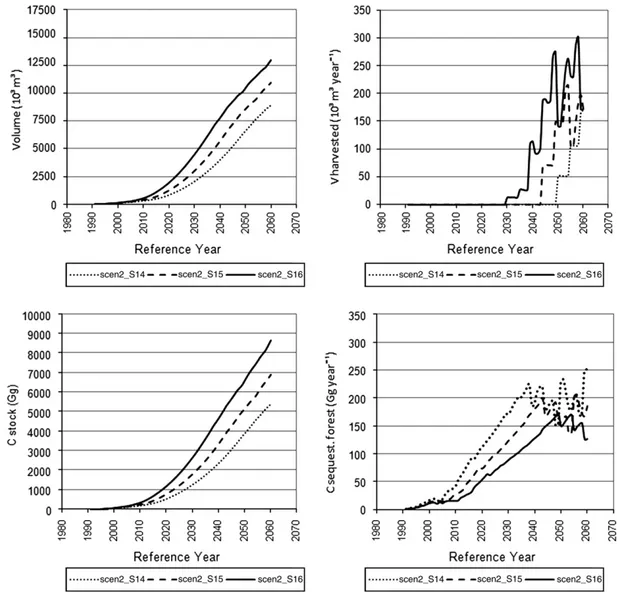
In order to account for a possible biased picture of the reality in the previous analysis, since the values from Fig. 9 were obtained considering an average site index of 15 m for new cork oak planta-tions, it was thought to be important to evaluate the effect of the site index variation in the results of the simulations. This analysis was made with scenario 2. Fig. 10 shows the evolution of the variables above presented in Fig. 9 for site index 15 m, jointly with the values obtained for site indices of 14 m and 16 m, using scenario 2.
As can be seen by the graphs presented inFig. 10, the site index has also a great impact in the evolution of all the variables and also in the year when the thinnings will start. In fact, using the yield table for a site index of 16 m, the simulation predicts the beginning of the thinning fourteen years earlier than with the yield table for a site index of 15 m, and twenty years earlier than with the yield table for a site index of 14 m. Taking into account this lag, the evolu-tion of the volume harvested is proporevolu-tionally similar, being the site index 16 m the one with bigger values of volume harvested, followed by site index 15 m and 14 m, as expected.
The site index also reflects in the carbon sequestered by the forest. In the year before thefirst thinning of site index 16 m simulation (2029) the carbon sequestered in the forest is two times higher
Fig. 10. Evolution of standing volume, harvested volume, carbon stock and carbon sequestered for scenario 2 (seeSection 2.4), considering alternative yield tables for site indices of 14 m, 15 m and 16 m.
(172 Gg year− 1) when compared with site index 14 m and 46% higher when compared with site index 15 m simulation. From the first year of thinning until the end of the simulation, carbon se-questered in the forest oscillates according to the harvested vol-ume in each year. In 2060, the simulation with site index 16 m presents the maximum value observed in this simulation for scenario 2: 252 Gg year− 1.
In the last year of the simulation, the standing volume obtained using the yield table for a site index of 16 m is 12,955 103m3which is 19% above the one obtained with site index 15 m and 45% above the one obtained with site index 14 m. In the same year, the carbon stock attains 8636 Gg with site index 16 m, which is 26% and 60% above site index 14 m and 15 m, respectively.
The calculations of all outputs are very sensitive to site index, suggesting the need for the Portuguese Government to promote an inventory of new cork oak plantations in order to obtain accurate data (site index and stand density) to improve the quality of the analysis of the contribution of such plantations either for the Portuguese commitments to Kyoto, either for the evaluation of wood availability for the development of wood industries based on wood from the thinning of these plantations.
4. Conclusions
This study aimed at analyzing the impact of new cork oak planta-tions, planted after 1990, in the carbon sequestered and also on the landowners economy, since adding up to traditional cork production income, it is possible that further income may result from wood selling resulting from thinnings and from the carbon credits market.
Using the results from simulations carried on with a regional forest simulator—SIMYT—it was possible to draw three main conclusions:
1. Cork oak plantations after 1990, accounted under article 3.3 of the Kyoto protocol, can provide a significant contribution to the Portuguese commitments to Kyoto. Depending on the plantation rates after 2000 (the last years when official figures were avail-able), cork oak plantations can sequester as much as 309 Gg year− 1of carbon, which represents 1/3 of the expected contribu-tion of carbon sequestracontribu-tion from forests for year 2010, considered as an average year for the first commitment period (915 Gg of carbon). It is important to notice the impact of the future planta-tion areas that, for this species, are very much influenced by national and European Union policies. Being a slow growing species with afirst significant economic income around the age of 40 years, economic incentives for afforestation both for forest or of set-aside agricultural lands are essential to encourage Portuguese landowners (majority is private) to invest on cork oak plantations.
2. Regardless of the scenario that is considered for future areas of plantation, the values of wood volume that will result from the thinnings of cork oak plantations after 1990 represent a significant volume of wood that may be considered for utilizations that are now starting to appear as an alternative to fuel. Considering the characteristics of the wood from this species, this alternative product may become an important contribution to the increase and advance of the landowners' income resulting from the stand management, if the wood market starts to come across an increase of the consumers' interest for this wood.
3. The simulations were based on a yield table built on the assump-tion that the average productivity of the new plantaassump-tions corre-sponds to a site index equal to 15 m (at 80 years of age). Two alternative simulations were made based on yield tables for a higher and lower site index (16 m and 14 m at 80 years of age, respectively) and the results showed the sensitivity of the analysis to a possible bias on the average site index estimation, suggesting
the need for the Portuguese Government to promote an inventory of new cork oak plantations in order to obtain accurate data (site index and stand density) to improve the quality of the analysis of the contribution of such plantations either for the Portuguese commitments to Kyoto, either for the evaluation of wood avail-ability for the development of wood industries based on wood from the thinning of these plantations.
Additional research is needed to take into account other factors influencing the figures suggested in the present study. Undergoing research on pruning estimates as well as predictions with process based model will improve carbon sequestration long term estima-tions. Additionally, current global markets uncertainty, and com-petition of land allocation to renew agriculture either for human consumption or bio-fuels will interact with the available land for cork oak plantations in this study. However, these plantations, which are managed towards sparse densities, are compatible, in medium term, to an agroforestry system conversion, a multifunc-tional land use (either silvopastural or silvoarable) present for centuries in Portugal.
Nonetheless, the conclusions present in this study demonstrate support for policies to promote new plantations with this species as they may enhance the fulfillment of Portuguese commitments to Kyoto.
Acknowledgments
Financial support was provided by project Motive (Grant Agree-ment 226544) financed by the European Commission under the Seventh Framework Program for Research and Technological Devel-opment, and project Oakwoods (PTDC/AGR-AAM/69077/2006)financed by the Fundação para a Ciência e Tecnologia (Portugal). The authors also acknowledge Conceição Ferreira from the Autoridade Florestal Nacional for the data contributing to this paper.
References
AFN, 2010. 5° Inventário Florestal Nacional. Autoridade Florestal Nacional—Ministério da Agricultura do Desenvolvimento Rural e das Pescas, Lisboa. 209 pp. AFN, Unpublished results. Série temporal de dados de área ardida. Autoridade Florestal
Nacional, Lisboa.
APA, 1974. Temperatura média diária do ar 1931–1960—Atlas Digital de Portugal. Agencia Portuguesa do Ambiente, Lisboa. Accessed @http://sniamb.apambiente. pt/webatlas/. Last access: 2011-07-06.
APA, 1979. Acidez e Alcalinidade dos Solos—Atlas Digital de Portugal. Agencia Portu-guesa do Ambiente, Lisboa. Accessed @http://sniamb.apambiente.pt/webatlas/. Last access: 2011-07-06.
APA, 1984. Carta Ecológica de Portugal—Atlas Digital de Portugal. Agencia Portuguesa do Ambiente, Lisboa. Accessed @http://sniamb.apambiente.pt/webatlas/. Last ac-cess: 2011-07-06.
APCOR, 2007. A Produção Suberícola. Área de montado de sobroAccessed @http:// www.apcor.pt/artigo.php?art=2892007Last access: 2010-11-08.
Aronson, J., Pereira, J.S., Pausas, J.G., 2009. Cork Oak Woodlands on the Edge: Conserva-tion, Adaptive Management and Restoration. Island Press, New York. 315 pp. Cañellas, I., Sánchez-González, M., Bogino, S.M., Adame, P., Herrero, C., Roig, S., Tomé,
M., Paulo, J.A., Bravo, F., Bravo, F., LeMay, V., Jandl, R., Gadow, K. von, 2008. Silvicul-ture and Carbon Sequestration in Mediterranean Oak Forests. 2008. Managing Forest Ecosystems: The Challenge of Climate Change. : Series: Managing Forest Ecosystems, Vol. 17. Springer. 339 pp.
Correia, A.V., Oliveira, A.C., 2002. Principais espéciesflorestais com interesse para Portugal.Zonas de Influência Mediterrânica. Direcção Geral das Florestas. Colecção Estudos e Informação n.° 318. DGF, MADRP. Lisboa. 119 pp.
Direcção Geral dos Recursos Florestais, 2007. Estratégia Nacional para as Florestas. Resolução do Conselho de Ministros n°114/2006 de 15 de Setembro. Imprensa Nacional Casa da Moeda, Lisboa, Portugal. 219 pp.
DR, 2006. Resolução do Conselho de Ministros n.° 104/2006. Diário da República, 1.ª série N.°162. 23 de Agosto de 2006. Imprensa Nacional Casa da Moeda, Lisboa, pp. 6042–6056.
EEA, 2000. CORINE land cover technical guide—Addendum 2000. Technical report No 40 Copenhagen. 105 pp. Accessed @http://www.eea.eu.int. Last access: 2011-07-06. Fortes, M.A., Rosa, M.E., Pereira, H., 2004. A cortiça. IST Press. Instituto Superior Técnico,
Lisboa. 259 pp.
Knapic, S., Pinto Seppä, I., Usenius, A., Pereira, H., 2011. Stem modelling and simulation of conversion of cork oak stems for quality wood products. European Journal of Forest Research 130 (5), 745–751.doi:10.1007/s10342-010-0467-z.
Ministério da Agricultura do Desenvolvimento Rural e das Pescas, 2001. RURIS—Plano de Desenvolvimento Rural. Florestação de Terras Agrícolas. Direcção Geral de Desenvolvimento Rural.
NASA-METI, 2009. GDEM—Global Digital Elevation Model. United States National Aeronautics Space Administration (NASA), Ministry of Economy, Trade and Indus-try of Japan (METI). Accessed @http://www.gdem.aster.ersdac.or.jp/. Last access: 2011-07-06.
Natividade, J.V., 1950. Subericultura. Ministério da Economia, Direcção Geral dos Serviços Florestais e Aquícolas, Lisboa. 387 pp.
Nicolau, R., 2002. Modelação e Mapeamento da Distribuição Espacial da Precipitação— Uma Aplicação a Portugal Continental. Faculdade de Ciências e Tecnologia. Univer-sidade Nova de Lisboa, Lisboa. 356 pp.
Oliver, J.M.M., 1980. Los Alcornocales (Quercus suber L.). Instituto Nacional de Investi-gaciones Agrarias, Madrid. 155 pp.
Pereira, H., 2007. Cork: Biology, Production and Uses. Elsevier, Lisboa. 336 pp. Pereira, H., Bugalho, M.N., Caldeira, M.C., 2008. Do sobreiro à cortiça: Um sistema
sustentável. APCOR (Associação Portuguesa de Cortiça), Lisboa. 40 pp. Accessed @ http://www.amorim.com/xms/files/CorticeiraAmorim/Noticias/Do_Sobreiro_a_ cortica_um_sistema_sustentavel.pdf. Last access: 2011-07-10.
Pereira, T.C., Seabra, T., Maciel, H., Torres, P., 2009. Portuguese National Inventory Report on Greenhouse Gases, 1990–2007 Submitted under the United Nations Framework Convention on Climate Change and the Kyoto Protocol. Portuguese Environmental Agency, Amadora. 614 pp.
Sánchez-González, M., Tome, M., Montero, G., 2005. Modelling height and diameter growth of dominant cork oak trees in Spain. Annals of Forest Science 62, 633–643. Silva, J.S., Catry, F., 2006. Forestfires in cork oak (Quercus suber L.) stands in Portugal.
International Journal of Environmental Studies 63 (3), 235–257.
Tomé, M., 2004. Modelo de crescimento e produção para a gestão do montado de sobro em Portugal. Projecto POCTI/AGR/35172/99. Relatório Final—Relatório de Execução Material (Volume I). Publicações GIMREF RFP 1/2004. Universidade Técnica de Lisboa. Instituto Superior Agronomia. Centro de Estudos Florestais, Lisboa. 89 pp. Accessed @http://hdl.handle.net/10400.5/2355.
Tomé, M., Barreiro, S., Cortiçada, A., Paulo, J.A., Meyer, A., Ramos, T., 2007. Inventário florestal 2005–2006. Áreas, volumes e biomassas dos povoamentos florestais. Resultados Nacionais e por NUT's II e III. Publicações GIMREF. RT 5/2007. Universi-dade Técnica de Lisboa. Instituto Superior Agronomia. Centro de Estudos Florestais. Lisboa. 127 pp.
Tomé, M., Coelho, M., Soares, P., 2010. ANNEX E1—Carbon Stock Changes in Portuguese Forests. In: Pereira, T.C., Seabra, T., Maciel, H., Torres, P. (Eds.), Portuguese National Inventory Report on Greenhouse Gases, 1990–2008. Submitted under ART° 3.1. (f) of Decision No.280/2004/EC of the European Parliament and the Council. Portuguese Environmental Agency, Amadora, p. 83.