PATTERNS OF TECHNOLOGICAL INNOVATION
IN INTERMEDIATE COUNTRIES
An Alternative Index and Some Conclusions
Isabel Salavisa
Andrew B. Hill
Novembro 1999
WP n.º 1999/14
DOCUMENTO DE TRABALHO WORKING PAPERD I N Â M I A C E N T R O D E E S T U D O S S O B R E A M U D A N Ç A S O C I O E C O N Ó M I C A
Isabel Salavisa Lança
Andrew B. Hill
WP nº 1999/14
Novembro de 1999
Index
1. RE-EXAMINING THE ROLE OF SCIENCE AND RESEARCH IN INTERMEDIATE COUNTRIES 1 1.1. From the linear model to the chain-linked model by Kline and Rosenberg 1
1.2. Limitations of conventional indices 2
1.3. Focusing on the innovation process 3
1.4. Building alternative indices 5
2. HIGH TECHNOLOGICAL POTENTIAL FIRMS IN THE PORTUGUESE INDUSTRY 6
2.1 The survey 6
2.2 The technological potential index 7
2.3. The characteristics of high potential firms 8
2.3.1. Univariate analyses 9
2.3.2. Discriminant analysis results 12
2.3.3. The pattern of high technological potential firms
and sectors position 13
2.4. Concluding remarks 15
P
P
A
A
T
T
T
T
E
E
R
R
N
N
S
S
O
O
F
F
T
T
E
E
C
C
H
H
N
N
O
O
L
L
O
O
G
G
I
I
C
C
A
A
L
L
I
I
N
N
N
N
O
O
V
V
A
A
T
T
I
I
O
O
N
N
I
I
N
N
I
I
N
N
T
T
E
E
R
R
M
M
E
E
D
D
I
I
A
A
T
T
E
E
C
C
O
O
U
U
N
N
T
T
R
R
I
I
E
E
S
S
-
An Alternative Index and Some Conclusions
ABSTRACT
Intermediate countries face very specific problems in what concerns innovation. They have low levels of R&D (although increasing in recent years) and depend upon imported technology, be it incorporated or non-incorporated. Most of their main sectors are suppliers dominated (see Pavitt, 1984), and their principal task is to absorb appropriate foreign technology, while attempting to reinforce their technological ability.
Taking into consideration the work by Pavitt, Soete, Fagerberg, Basberg and others, we developed an alternative index to R&D expenditure, in order to account for the technological performance of Portuguese manufacturing firms. The new index is based upon labour skills, and specifically upon the proportion of graduates in the firms’ personnel. We have considered it to represent a preliminary capacity to innovate, a propensity to innovate according to the definition by Kline and Rosenberg (1986) and by the Oslo Manual.
A further step consisted of the identification of the main factors underlying Portuguese technological performance, using data from a recent survey of a representative sample of the manufacturing industry (almost 1200 firms; level of confidence of 95% and observed error of 3%), excluding firms with less then 10 workers. The information was collected through a postal questionnaire. Using a number of statistical techniques (discriminant analysis, among others), an interesting and consistent picture of firms with high technological potential emerged.
Results obtained from application of the new index in Portugal suggested that potential for innovation was greater in firms which had a better educated workforce, a larger proportion of indirect workers, higher productivity per capita and which were managed by younger and better educated entrepreneurs. On the basis of these findings it was concluded that technological potential in intermediate countries may depend strongly upon Human Resources.
Paper presented at the EAEPE Conference (European Association for Evolutionary Political Economy),
1. RE-EXAMINING THE ROLE OF SCIENCE AND RESEARCH IN INTERMEDIATE COUNTRIES
A simplistic view of the role of science in the growth process could lead intermediate countries with low levels of R&D/GDP to focus their efforts on increasing their expenditure in science. This view would then lead to the formulation of inadequate, expensive and less efficient policy measures. Undoubtedly the concept of national innovation systems (Freeman, 1987, Lundvall, ed., 1992 and Nelson, ed., 1993) has produced a valuable contribution to this issue, because it has included in the theory both the role of institutions and the specificity of national and spatial configurations, in the innovation process.
Not only have intermediate countries to devote more efforts to the innovation process, through the acquisition, adaptation and absorption of international technology, while maintaining an adequate level of effort in basic and applied research. They have also to take a further step, by paying much more attention to creating the conditions and pre-conditions for innovation. This is our starting point for proposing some new indices and to analyse the case of a specific intermediate country, Portugal.
First, however, we shall present the theoretical foundations of our empirical work.
1.1. From the linear model to the chain-linked model by Kline and Rosenberg
The spread of Shumpeter’s ideas, as is the case with any popularisation, was carried out through some oversimplification. The large diffusion of the linear model, made it dominant till the national systems concept appeared. The fundamental consequence of the model is that it suggests that economic results depend in a linear way on the production of new scientific knowledge, which is obviously inadequate for most countries except a small group of advanced ones. Besides, even within this group, a good performance in science and in R&D is not equally reflected in commercial success, economic growth and productivity. The “European Paradox”, as emphasized by the Green Paper on Innovation (European Commission, 1995) means that European first class science is not paralleled by innovative achievements similar to those of the US and Japan, with implications for trade balance (see also Pavel and Pavitt, 1987; Amable and Boyer, 1993 and 1995).
In 1986, in a remarkable paper, which seems to have had only a modest impact, Kline and Rosenberg proceeded to a thorough critical examination of the linear model. On the basis of a sound and detailed knowledge of the history of innovation, they argued for the adoption of an
interactive model in place of the linear one (Kline and Rosenberg, 1986). One of their paper’s fundamental conclusions is that the production of new knowledge, or the research process, has a minor role in the current stream of innovations (which are mainly made on the basis of the available stock of knowledge). This is not to say that radical innovations based upon research are not at the forefront of economic progress nor that science has a minor role in long term development and growth.
1.2. Limitations of conventional indices
A number of technological indices have become widely accepted and used in empirical research. However, they have been submitted to some criticism, not only because they have underlying conditions of applicability sometimes ignored, but also because they have several restrictions. Authors such as Pavitt (1988), Soete (1987) and Basberg (1987) have shown at length the restrictions and shortcomings as well as the advantages of these indices. The relations between patents, inventions and innovations is very clearly examined by Basberg (1987), among others. Kline and Rosenberg also emphasised that “the overwhelming majority of the inventions recorded at the U.S. Patent Office were never introduced on a commercial basis” (Kline and Rosenberg, 1986: 276). Moreover, they also pointed to the fact that some major improvements in productivity stemmed from innovations of “almost embarrassing technological simplicity”, like containerization in the transport sector since World War II (Ibidem: 278).
Some preliminary conclusions can be drawn.
Firstly, according to Kline and Rosenberg, some powerful innovations are based upon Development rather then Research which has not led to any patent.
Secondly, in terms of economic results, the diffusion or dissemination of new products, processes or practices in the productive system as a whole is most relevant and may be based upon importation of equipment and learning. This is true for most countries, even for the few that have succeeded in catching up, like Portugal. For these a new sort of index is needed to provide a measure of the rate and capacity for absorption of imported technology. Tangible investment has revealed itself to be a significant factor in many catch-up models, which means that new technology is absorbed mainly via the acquisition of productive equipment (“suppliers dominated” according to the Pavitt taxonomy (Pavitt, 1984)), as we confirmed in our case studies in several Portuguese manufacturing sectors.
Thirdly, some countries, being scientifically and technologically advanced, be it in terms of R&D efforts or in terms of the weighted number of patents or the technology balance of payments, have not succeeded in recent decades in obtaining corresponding economic performance. An apparent example is the United Kingdom, which exhibits a technological superavit being one of a small set of countries, which also includes the U.S., Japan, Sweden, Canada and the Netherlands.
The above remarks suggest the necessity for implementing new indices if we are to study less technologically developed countries. However, this task implies the awareness of a number of preliminary conditions required to pursue a continuous R&D effort and also that those conditions can be “measured” in some way. For most countries we have to step back from the innovation process in order to understand its specific features and the most effective policy measures to be taken.
1.3. Focusing on the innovation process
As Boyer and Didier have written, “The difference between research and innovation is beginning to be acknowledged and admitted in economic analysis and a change of view is occurring in respect of the innovation process in the economic system” (Boyer and Didier, 1998: 15). The focus on the innovation process, together with the adoption of interactive models, has consequences at various levels: in the formulation of indicators; in the conception of national surveys; and, finally, in the formulation of policies. But a fundamental theoretical consequence arises: the process of innovation is re-inserted in its societal and economic context and disentangled from the science production process. Innovating entrepreneurs re-occupy their central place.
Innovation appears now as a much wider and distinct phenomenon in relation to the previous conception, principally because it includes a large set of activities besides research: the specific efforts for innovation, the acquisition of patents, the conception of products, experimental production, training, market surveys, etc. (Boyer and Didier, 1998: 16). The Oslo Manual presents a more comprehensive list including: research and experimental development; acquisition of disembodied technology and know-how (patents, non-patented inventions, licences, disclosures of know-how, trademarks, designs, patterns and computer and other scientific and technical services related to the implementation of innovation, plus the acquisition of packaged software not classified elsewhere); acquisition of embodied technology; tooling up and industrial engineering; industrial design; other capital acquisition; production start-up; marketing for new or improved products and a part of the activities of design, training, marketing and the production or acquisition of software (OECD, 1997: 58-61).
In the second place, the innovation process is a complex one embracing not only the various departments of the firm, but also its relationship with the environment. Elements such as the kind of competition prevailing, the type and quality of the factors, the pattern of demand and the nature of the industries upstream and downstream, will influence the firm’s innovative performance (Boyer and Didier, 1998: 18-19).
In the third place, and as a result of the above features, the specific configuration of the innovation process may assume a great national variety, not only in terms of intensity, but also in terms of the factors and relations at stake.
1.4. Building alternative indices
As we stated above, standard input and output indices are not appropriate to deal with the case of less technologically developed countries. This is true both in static and dynamic terms. The more comprehensive concept of activities relevant to innovation adopted by OECD recently, together with the corresponding indices, represents an effective step forward. However, our problem is of a more fundamental nature. It consists in the identification of the potential of a country or industry to attain innovation. Contrary to the standard neoclassical theory, it is not proven that the bigger the lagging behind the bigger the potential for catching up. The potential depends upon the attainment of some minimal conditions. On this subject we share the views of Abramovitz (1994) and Abramovitz and David (1996).
The internalization of new products, processes, practices, norms, routines and organizational forms implies the ability to mobilize the intellectual resources of the workers. This task demands the existence of critical thresholds of education and qualification, besides the existence of entrepreneurs and managers of an adequate profile. From our point of view the indices concerning these two dimensions deserve a central role in our approach.
Our index is based upon the idea that the technological potential depends, in the first place, upon the size of the intellectual resource base in the firm, which we operationalized as the proportion of graduates employed since the existence of graduate level skills and knowledge may be considered to represent a precondition for the sustained adoption of new technologies, the creation of incremental improvements and, sometimes, the transition to a stage characterized by internal R&D.
With this conception in mind we tried to identify the characteristics of firms with a high technological potential, in relative terms, in the Portuguese manufacturing industry.
2. HIGH TECHNOLOGICAL POTENTIAL FIRMS IN THE PORTUGUESE INDUSTRY
The original purpose of the survey was to identify the main factors contributing to Portuguese competitiveness1. It was carried out using a representative sample2 (1157 firms) of the manufacturing industry, excluding firms with less than 10 workers. The information was collected through a postal questionnaire, applied between September 1996 and February 1997. The sample is also representative at a sectoral level3.
From the filled questionnaires it was possible to construct an extensive database4 with
information referring mostly to 1996, although the quantitative data refer to 1994 and 1995. Some of the latter refer to pluriannual periods. The information gathered concerned the general characterization of the firm and included the following aspects: commercial, markets, technology, organization, strategies, investment, financial situation and results, human resources and entrepreneurs.
Once tested in previous works (see I. Salavisa Lança, coord., 1998), the data base was then used as the fundamental material to answer the question: what are the characteristics of the higher technological potential firms within Portuguese manufacturing industry?
2.2 The technological potential index
Of the 1157 firms in the sample, 49% claimed to employ at least one graduate, from which we concluded that 51% did not have any graduate in their service (see Salavisa Lança, coord., 1998, vol. II, Chapter 1). Sectoral heterogeneity was quite pronounced both in the proportion of firms having graduates and in the proportion of graduates in the workforce. The number of cases was much greater in chemical products and fabricated metals and machinery and was lowest in wood and wood products and textiles, apparel and leather.
Although theoretically expected, this heterogeneity was considered in the definition of the technological potential index. In fact, we defined a firm i belonging to sector j as having high technological potential if it obeys the following condition5:
Proportion of graduates of firm ij > 1,5 x mean proportion of graduates of sector j where
1 See I. Salavisa Lança, coord., Competitive Trajectories in Portuguese Industry – Factors, Infra-structures and Entrepreneurs’ Behaviour, Report by request of the Portuguese Industrial Association (AIP), co-funded by PEDIP II, Lisbon, Dinâmia, 1998, 3 volumes.
2 Level of confidence of 95% and an observed error of 3%. The database is the official one (BELEM –
Base Portuguesa de Estabelecimentos e Empresas), constructed by INE (National Institute for Statistic Information). Being theoretically exhaustive, in 1996 it contained 15.954 manufacturing firms with 10 or more workers.
3 Representativeness was assured for 25 of the 29 sectors of 3 digits’ ISIC industries. 4 Helena Carvalho was responsible for the database and for most of the statistical work.
5We drew inspiration from M. Laranja (1998), adapting his index and using it in a very different
Rate of graduates = (Number of graduates / Total number of employees) x 100
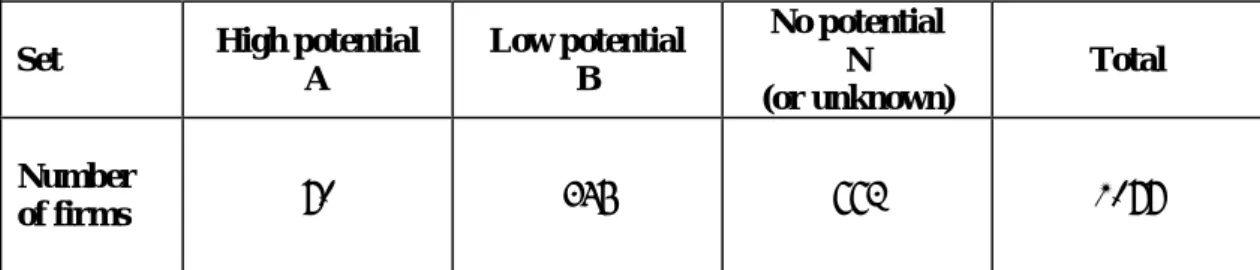
After defining the High Potential group of firms two additional groups were defined; a Low Potential group and a group with No (or unknown) Potential. The former had a proportion of graduates lower than the sector mean and the latter consisted of firms having no graduates and those who failed to state whether graduates were employed. 95.4% of companies not stating whether graduates were employed had fewer than 100 employees (and 45% had fewer than 20). In general, small companies in Portugal are less likely to employ graduates and for this reason we included the firms which did not state whether graduates were employed in the No Potential group rather than excluding them from the analysis.
Table 1 shows the number of firms in each of the three groups. Because of missing data for some of the variables used in the analyses the final sample was 1077.
T
Taabbllee11 N
Nuummbbeerrooffffiirrmmssaaccccoorrddiinnggttootthheetteecchhnnoollooggiiccaallppootteennttiiaal l
Set High potential
A Low potential B No potential N (or unknown) Total Number of firms 70 345 662 1077
The next step consisted in identifying the characteristics that distinguished high potential firms from the low and no potential ones.
2.3. The characteristics of high potential firms
The identification of the relevant features was based on a large number of variables concerning various domains related to the firm such as commercial, markets, technology, organization, strategies, investments, financial situation, human resources, entrepreneurs and management, besides a general characterization, including size, age of the firm, and so on.
The search for the characteristics was performed through two kinds of procedures: 1. Application of univariate analyses to all variables in order to find those that had
2. Application of a discriminant analysis, to determine significant discrimination dimensions which would characterize high potential firms, and which would differentiate them from firms of low potential and no potential. The independent variables selected for use in this analysis were those found to distinguish reliably among the three types of firm in the univariate analyses.
2.3.1. Univariate analyses
Due to differences in the nature of variables two different statistical procedures were used. Categorial and short scale (4 points) ordinal variables were submitted to chi-square tests. Quantitative and larger scale ordinal variables (≥ 5 points) were submitted to one-way ANOVAS.
The chi-square results are shown in Table 2. They reveal that none of the non-quantitative variables showed statistically reliable differences between the high potential and the other two groups.
T Taabbllee22 N Noonn--qquuaannttiittaattiivveevvaarriiaabblleessaannddrreessuullttssoofftthhee
2 test test Variable
2 test results FirmLegal status of the firm Test not legitimate (*)
Existence of foreign capital Not significant
Percentage of foreign capital (4 points scale) “ “
Existence of own brand “ “
Existence of certification “ “
Existence of certified products “ “
Application for public subsidies “ “
Firm operates as subcontractor “ “
Firm is subcontracted “ “
Existence of exports “ “
Exports/sales (3 points scale) “ “
Exports for EC (12) / Total exports (3 points scale) “ “ Entrepreneurs
Exercise of a second employment “ “
Note: (*)The
2for “Legal status” was not legitimate because there were too many cells with expected frequencies less then 5.
The quantitative variables analysed by means of one-way ANOVAS were submitted to a post hoc test, in order to discover which pairs of group means differed significantly6. The results are summarized in Table 3.
Table 3 shows that only 7 variables were selected for the discriminant analysis. These were:
Investment / sales (1994 and 1995 average);
Rate of post-basic education (more than 6 years of schooling) (%); Rate of indirect workers
indirect workers / personnel (%) (1995); Value added / personnel (1995).
And concerning the entrepreneurs the variables were: Length of service with the company;
Age;
And level of education.
A stepwise discriminant analysis was then applied to the seven selected variables.
6 One way ANOVAS merely indicate whether at least one pair of means in a set of group means differ
significantly. But the analysis does not indicate which pair (or pairs) differs significantly. The analysis must then be pursued. We used one of the following tests: Bonferroni (which implies the assumption of homogeneity of variance) and Games-Howell (when this assumption was not met).
T Taabbllee33 Q Quuaannttiittaattiivveevvaarriiaabblleess::rreessuullttssoofftthheessttaattiissttiiccaalltteessttss Group Means(*) Variables N B A Significance of F
(ANOVA) Group differences Selected variables Firms
Age of firms (ordinal scale) 2.6 3.1 2.9 P<0.0001 N=A, B=A No
Size of firms (ordinal scale) 1.6 2.5 1.8 P<0.0001 N=A, N<B, A<B No
Increase of personnel (1991-1995) 8.7 5.1 8.1 P=0.594 - No
Training investment per capita (1995) (103escudos) 74.4 26.4 37.2 P=0.014 N=A, B=A, N=B No
R&D Technicians / Personnel (%) (1995) 10.6 7.0 13.3 P<0.0001 B<N, B<A, A=N No
Cashflow / Sales (%) (1995) 6.4 8.0 14.6 P=0.012 N=B=A No
R&D / Sales (%) (1995) 1.1 1.2 2.6 P=0.300 - No
Intangible investment / Sales (%) (1995) 2.8 2.9 3.7 P=0.793 - No
Net profitability of sales (%) (1995) -1.2 0.5 -1.6 P=0.305 - No
Passive/Active (1995) 0.74 0.71 0.65 P=0.323 - No
Average increase of sales (1991-1995) 8.0 7.6 8.5 P=0.955 - No
Investment / Sales (%) (1994 and 1995 average) 12.3 9.4 5.8 P=0.008 N=B, A<N, A<B Yes
Rate of post-basic education (>6 years of education) 31.0 38.8 52.6 P< 0.0001 N<B<A Yes
Indirect workers / Personnel (%) (1995) 16.4 25.0 32.8 P<0.0001 N<B<A Yes
Value added / Personnel (1995) (103escudos) 2170 3305 5591 P<0.0001 N<B<A Yes
Entrepreneurs
Length of service (years) 13.8 13.7 10.0 P=0.009 N=B, A<B, A<N Yes
Age (years) 45.7 45.4 41.3 P=0.009 N=B, A<B, A<N Yes
Level of education (ordinal scale) 2.5 3.4 3.7 P=0.016 N<B<A Yes
Note: (*)The groups are:
N - no potential (or unknown) B - low technological potential A - high technological potential
2.3.2. Discriminant analysis results
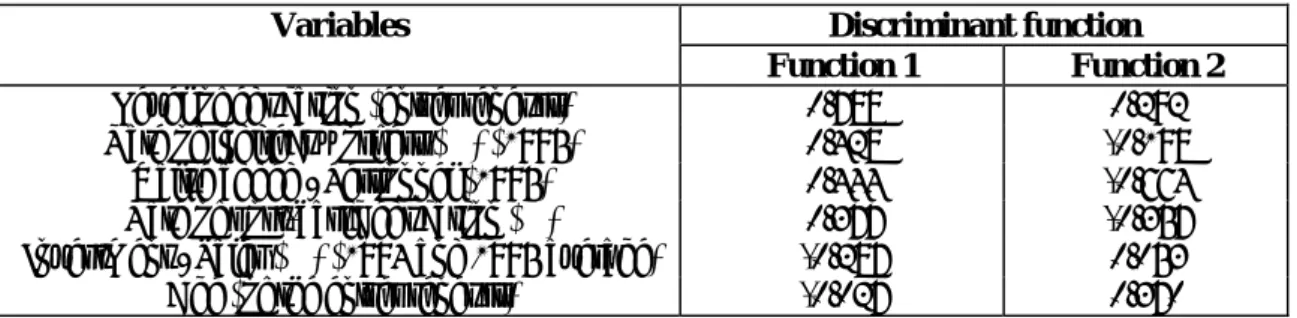
From the stepwise discriminant analysis two discriminant functions were extracted and both were statistically significant (p<0.0001). The stepwise procedure did not select one of the seven variables, that concerning length of service of entrepreneurs. The results are shown in Table 4, which displays the coefficients of the two functions.
T
Taabbllee44
D
Diissccrriimmiinnaannttffuunnccttiioonnssccooeeffffiicciieennttss
Variables Discriminant function
Function 1 Function 2
Level of education (entrepreneurs) 0.788 0.292
Rate of indirect workers (%) (1995) 0.428 -0.198
Value added / Personnel (1995) 0.444 -0.664
Rate of post-basic education (%) 0.377 -0.357
Investment / Sales (%) (1994 and 1995 average) -0.287 0.053
Age (of the entrepreneurs) -0.027 0.370
Table 4 indicates that the first dimension in terms of which discrimination among the groups can be made (first function) is essentially defined by four variables: the educational level of the entrepreneurs, the firm’s organizational development, the workers’ educational level and the rate of productivity. The second function contrasts rate of productivity, proportion of indirect workers and workers’ educational level (all negatively weighted) with the age and level of education of the entrepreneurs (both positively weighted).
Discriminant scores were then computed for each function. These are a weighted combination (the coefficients being those of the discriminant functions) of the values of the six selected variables for each firm. Table 5 presents the average discriminant score for each of the three groups (high, low and no potential). These averages for the groups are called group centroids and are displayed graphically in Figure 1, with function 1 as the vertical axis and function 2 as the horizontal one.
T
Taabbllee55 A
Average discriminant scores (centroids) Set
Function 1 Function 2
Group N = No potential -0.697 -0.101
Group B = Low potential 0.417 0.214
Group A = High potential 1.195 -0.780
2.3.3. The pattern of high technological potential firms and sectors position
F Fiigguurree11 G Grroouuppcceennttrrooiiddssiinntthheeddiissccrriimmiinnaannttffuunnccttiioonnssssppaaccee 1.5 Group N = No potential Group B = Low potential Group A = High potential
1
0.5
0
From Figure 1 and Table 4 we can outline the profile of high potential firms, since they have high scores on function 1 and low scores on function 2. Those firms tend:
- to be run by younger and more educated entrepreneurs;
- to have a larger proportion of indirect workers, that is to say, to be more organizationally developed;
- to have a more educated work force;
-1 -0.5
-1 -0.8 -0.6 -0.4 -0.2 0 0.2 0.4Function 2
- to have a higher productivity per head.
We also computed the discriminant scores for the 9 sectors at 2 digits level of ISIC. The results are shown in Table 6 and in Figure 2. It may be deduced that the sector having highest potential is chemicals (sector 35). Paper and printing (sector 34), fabricated metals and machinery (sector 38) and food, beverages and tobacco (sector 31) also appear to have high technological potential. The sectors associated with no potential are textiles, apparel and leather (32) and other manufacturing industries (39).
T
Taabbllee66 D
Diissccrriimmiinnaannttssccoorreessffoorrsseeccttoorrss
Sector Function 1 Function 2
31 Food, beverages & tobacco 0.363 -0.059
32 Textiles, apparel & leather -0.327 0.260
33 Wood products & furniture -0.596 -0.254
34 Paper, paper products & printing 0.275 -0.274
35 Chemical products 0.637 -0.141
36 Non-metallic mineral products -0.237 -0.056
37 Basic metal products 0.118 -0.002
38 Fabricated metal products 0.250 -0.128
39 Other manufacturing -0.317 0.133
F
Fiigguurree22 D
Diissccrriimmiinnaannttssccoorreessffoorrsseeccttoorrss
31 Food, beverages & tobacco 32 Textiles, apparel & leather 33 Wood products & furniture 34 Paper, paper products & printing 0.8
35 Chemical products
36 Non-metallic mineral products 37 Basic metal products 0.6
38 Fabricated metal products 39 Other manufacturing 0.4 0.2 0 -0.1 0.1 0.2 0.3 Function 2 -0.4 -0.3 -0.2 0
Function 1
2.4. Concluding remarks
In order to identify the pattern of the highest technological potential firms in Portuguese manufacturing, we considered that it was necessary to use an approach that would not follow the conventional one, based upon the effort in R&D. This was due both to a practical consideration - the small amount of R&D activities in Portuguese manufacturing -, and to a theoretical consideration. According to the latter, it seems reasonable to suppose that firms with a greater potential for innovation will be more committed to the use of highly qualified human resources. The index of such commitment was the proportion of graduates employed, an index previously used in other studies.
Using the data from a survey of a representative sample of the manufacturing industry, and submitting the indices to several statistical analyses, we discovered a pattern that seems consistent on three different levels: firstly, internally consistent since the various relevant features of the high potential firm seem to complement one another to define a viable configuration; secondly, consistent with the theoretical assumptions about the process of innovation in an intermediate country, upon which we based the empirical work; thirdly, consistent with the prior knowledge we obtained from a number of case studies7. The high potential firm tends then to be run by a younger and more educated entrepreneur; to the organisationally more developed; to have a more educated work force and to have a higher productivity per head. Other company characteristics did not emerge as significant and therefore the “key” to potential for innovation seems to lie in human resources.
BIBLIOGRAPHY
ABRAMOVITZ, M. (1994), “The Origins of the Postwar Catch-Up and Convergence Boom”, in J. Fagerberg et alii (ed.) (1994), pp. 21-52.
ABRAMOVITZ, M. and DAVID, P.A. (1996), “Convergence and Deferred Catch-up: Productivity Leadership and the Waning of American Exceptionalism”, in R. Landau et alii (dir.) (1996), pp. 21-62.
AMABLE, B. and BOYER, R. (1993), “L’Europe est-elle en retard d’un modèle technologique?”, Economie internationale, no. 56, vol. 4, pp. 61-90.
AMABLE, B. and BOYER, R. (1995), “Europe in the World Technological Competition”, Structural Change and Economic Dynamics, vol. 6, pp. 167-183.
BASBERG, B. L. (1987), “Patents and the Measurement of Technological Change: A Survey of the Literature”, Research Policy, vol. 16, no. 2-3-4, pp. 131-141.
BOYER, R. and DIDIER, M. (1998), Innovation et croissance, Paris, La Documentation Française, 198p.
EUROPEAN COMMISSION (1995), Green Paper on Innovation, EC, Brussels, V + 51p. + Annexes.
FAGERBERG, J., VERSPAGEN, B. and VON TUNZELMANN, N. (ed.) (1994), The Dynamics of Technology, Trade and Growth, Aldershot, Edward Elgar, IX + 231p.
FREEMAN, C. (1987), Technology Policy and Economic Performance – Lessons from Japan, London and New York, Pinter Publishers, IX + 155p.
KLINE, S.J. and ROSENBERG, N. (1986), “An Overview of Innovation”, in R. Landau and N. Rosenberg (ed.) (1986), pp. 275-305.
LANDAU R. and ROSENBERG, N. (ed.) (1986), The Positive Sum Strategy - Harnessing Technology for Economic Growth, Washington D.C., National Academic Press, XIV + 640p. LANDAU, R., TAYLOR, T. and WRIGHT, G. (dir.) (1996), The Mosaic of Economic Growth, Stanford, Stanford University Press, XII + 459p.
LARANJA, M. (1998), “Diagnóstico da inovação em empresas inovadoras: alguns resultados de um programa de auditorias”, Paper presented to the Workshop C&T e inovação em Portugal: situação e perspectivas, Lisbon, CISEP, September 25, 1998.
LUNDVALL, B.A. (ed.) (1992), National Systems of Innovation – Towards a Theory of Innovation and Interactive Learning, London, Pinter Publishers, XIII + 342p.
NELSON, R.R. (ed.) (1993), National Innovation Systems – A Comparative Analysis, New York and Oxford, Oxford University Press, XI + 541p.
OECD (1997), Proposed Guidelines for Collecting and Interpreting Technological Innovation Data – Oslo Manual, Paris, OCDE, 122p.
PAVEL, P. and PAVITT, K. (1987), “Is Western Europe Losing the Technological Race?”, Research Policy, vol. 16, no. 2-3-4, pp. 59-85.
PAVITT, K. (1984), “Sectoral Patterns of Technical Change: Towards a Taxonomy and a Theory”, Research Policy, vol. 13, no. 6, pp. 343-373.
PAVITT, K. (1988), “Uses and Abuses of Patent Statistics”, in A.F.J. van Raan (ed.) (1988), pp. 509-536.
SALAVISA LANÇA, I. (coord.) (1994), “Investments, technological modernization and organizational change: case studies in SMF”, report by request of IAPMEI, 6 volumes, Lisbon, Dinâmia
SALAVISA LANÇA, I. (1997 a), “Human Resources and development in the Portuguese data processing equipment industry: diagnostic and forward study”, in TDC/FUNDETEC/DINÂMIA (1997), pp. 119-133.
SALAVISA LANÇA, I. (1997 b), “Human Resources and development in the Portuguese automation systems and equipment industry: diagnostic and forward study” in TDC/FUNDETEC/DINÂMIA (1997), pp.79-117.
SALAVISA LANÇA, I. (coord.) (1998), Competitive Trajectories in Portuguese Industry – Factors, Infra-structures and Entrepreneurs’ Behaviour, Report by request of the Portuguese Industrial Association (AIP), co-funded by PEDIP II, Lisbon, Dinâmia, 1998, 3 volumes.
SOETE, L. (1987), “The Impact of Technological Innovation on International Trade Patterns: the Evidence Reconsidered”, Research Policy, vol. 16, pp. 101-130.
TDC/FUNDETEC/DINÂMIA (1997), Information and electronic technologies in Portugal: competitive development and Human Resources, Lisbon, Direcção-Geral da Indústria, XI+287p. VAN RAAN, A.F.J. (ed.) (1988), Handbook of Quantitative Studies of Science and Technology, Amesterdam, Elsevier Science Publishers/North Holland, IX + 774p.