Automatic 3D pulmonary nodule detection in CT
images: a survey
Igor Rafael S. Valentea,b, Paulo C´esar Cortezb, Edson Cavalcanti Netob,
Jos´e Marques Soaresb, Victor Hugo C. de Albuquerquec, Jo˜ao Manuel R. S.
Tavaresd,∗
aInstituto Federal do Cear´a, Campus Maracana´u, Av. Parque Central, S/N, Distrito
Industrial I, 61939-140, Maracana´u, Cear´a, Brazil
bUniversidade Federal do Cear´a, Departamento de Engenharia de Teleinform´atica, Av.
Mister Hull, S/N, Campus do Pici, 6005, 60455-760, Fortaleza, Cear´a, Brazil
cPrograma de P´os-Gradua¸c˜ao em Inform´atica Aplicada, Universidade de Fortaleza, Av.
Washington Soares, 1321, Edson Queiroz, 60811341, CEP 608113-41, Fortaleza, Cear´a, Brazil
dInstituto de Ciˆencia e Inova¸c˜ao em Engenharia Mecˆanica e Engenharia Industrial,
Departamento de Engenharia Mecˆanica, Faculdade de Engenharia, Universidade do Porto, Rua Dr. Roberto Frias, S/N, 4200-465, Porto, Portugal
Abstract
This work presents a systematic review of techniques for the 3D automatic detection of pulmonary nodules in computerized-tomography (CT) images. Its main goals are to analyze the latest technology being used for the devel-opment of computational diagnostic tools to assist in the acquisition, storage and, mainly, processing and analysis of the biomedical data. Also, this work identifies the progress made, so far, evaluates the challenges to be overcome and provides an analysis of future prospects. As far as the authors know, this is the first time that a review is devoted exclusively to automated 3D tech-niques for the detection of pulmonary nodules from lung CT images, which makes this work of noteworthy value. The research covered the published works in the Web of Science, PubMed, Science Direct and IEEEXplore up to December 2014. Each work found that referred to automated 3D seg-mentation of the lungs was individually analyzed to identify its objective, methodology and results. Based on the analysis of the selected works, sev-eral studies were seen to be useful for the construction of medical diagnostic
aid tools. However, there are certain aspects that still require attention such as increasing algorithm sensitivity, reducing the number of false positives, improving and optimizing the algorithm detection of different kinds of nod-ules with different sizes and shapes and, finally, the ability to integrate with the Electronic Medical Record Systems and Picture Archiving and Commu-nication Systems. Based on this analysis, we can say that further research is needed to develop current techniques and that new algorithms are needed to overcome the identified drawbacks.
Keywords:
3D image segmentation, computer-aided detection systems, lung cancer, pulmonary nodules, medical image analysis.
1. Introduction
Lung cancer is the leading cause of cancer deaths in the world [1]. In developed countries, patients diagnosed with this pathology have a five-year survival rate between 10 and 16%. This occurs because about 70% of lung cancer cases are diagnosed in advanced stages, preventing effective treat-ments. However, in cases where lung cancer is diagnosed in early stages, the five-year survival rate increases to 70% [2].
Computerized tomography (CT) has become the most sensitive imaging modality for the detection of small lung nodules, particularly since the intro-duction of helical multislice technology [3]. More recently, one of the hopes to change the scenario of late diagnosis has been conducted by monitoring pro-grams with low-dose CT, particularly applied to risk groups such as smokers [4].
After identifying a pulmonary nodule through CT, the physician is asked about its malignancy. During the investigation, the radiologist must list the diagnostic possibilities and offer a result based on the analysis of the nodule morphology and clinical context. This diagnosis may have no treatment, no follow up, or may recommend surgical resection. However, it should always seek a cost benefit trade-off analysis of treatment strategies by not allowing a potentially malignant nodule to continue evolving, by limiting unneces-sary invasive investigations and radiation from repeated CT scans as well as containing patient anxiety. The chosen strategy should follow traditional recommendations and incorporate the recent extensive and fast changing re-search found in the literature. The nodule imaging features and the role of
the radiologist are essential to the definition of this diagnosis [5].
In general, a lung nodule is defined as a focal opacity with a diameter between 3 and 30 mm [6]. The term “micronodule” is reserved for opacities less than 3 mm in diameter and the term “mass” is used for opacities which are larger than 30 mm. The accuracy in calculating the nodule diameter is critical because the nodule size is related to malignancy. For example, the percentage of malignancy in the End-Use Load and Consumer Assessment Program (ELCAP) database [7] is 1% for nodules smaller than 5 mm, 24% for nodules between 6 and 10 mm, 33% between 11 and 20 mm and 80% for nodules with a diameter up to 20 mm [8]. In asymmetric or non-spherical nodules, errors may occur when calculating the diameter. If the nodule is too small, the measures should be calculated after maximizing the image size. As a result of inaccuracies in the diameter measured manually, automated methods for measuring nodule diameters have been developed [9].
However, despite initiatives to promote early diagnosis, physicians do not always make the best use of the data acquired from the imaging devices [10, 11]. Limitations of the human visual system, insufficient training and experience, factors such as fatigue and distraction may contribute to the in-efficient use of available information [12, 13, 14]. In this scenario, automated techniques of image analysis processing can be applied as medical aid tools in an effort to minimize these difficulties. The central idea of this approach is to modify the displayed image, highlighting the possible existing abnormalities for radiologists [15].
Since 1980, several attempts have been made to develop a system able to detect, segment [16, 17] and diagnose pulmonary nodules from CT scans. As the appearance of pulmonary nodules varies according to its type, ma-lignancy or not, size, internal structure and location, nodule detection and segmentation have become a major challenge, often involving methodologies of various levels, each handling a particular aspect of the problem [18].
These systems are known as computer-aided diagnosis systems (CAD) and go beyond just image processing in order to provide specific information about the lesion that can assist radiologists in the diagnosis. However, image processing alone is not able to solve problems such as fatigue, distraction or limitations in training [15].
CAD systems can be divided into two systems: detection system (CADe) and diagnostic system (CADx). The goal of a CADe system is to identify regions of interest in the image that can reveal specific abnormalities and alert physicians to these regions. A CADx system is to provide medical aid
in the identification of the disease, its type, severity, stage, progression or regression. This latter system can either use only image information or can combine other data relevant to the diagnosis. Some CAD systems can act as CADe and CADx systems by first identifying any potentially abnormal regions and then providing a quantitative or qualitative evaluation of the identified abnormalities [15]. However, this work only takes into account the CADe systems.
Reviews of techniques to detect pulmonary nodules from CT images are not something new; several critical reviews have already been written on the subject, especially to identify the best techniques already developed at the time, and to compare the data; for example, Lee et al. [19], Sukuzi [20], Eadie, Taylor and Gibson [21], El-Baz et al. [22] and Firmino et al [23]. Lee et al. [19], Eadie, Taylor and Gibson [21] analyzed techniques until 2010 and Sukuzi [20] and El-Baz et al. [22] till June 2012. More recently, Firmino et al. [23] reviewed through tol August 2013.
However, due to developments of new computational techniques and new medical devices, an up-to-date review is necessary; and this is the main contribution of this work. Besides the chronological update, this work has considered aspects related to the scientific fields of biomedical engineering and medicine as well as taking into account the real needs in the daily life of a hospital or imaging clinic, and has incorporated suggestions for integration with relevant systems, such as Electronic Medical Record Systems (EMR) and Picture Archiving and Communication Systems (PACS). These factors are extremely relevant to contribute to the effective implementation of a CAD tool in daily medical practice, which is the ultimate goal of these analytical techniques. From analysis to evaluation, this work details the tasks for de-tecting nodules from lung CT images, discusses the tools, the most common tips and techniques step by step. This analysis demonstrates the most com-monly used techniques in accordance with the desired database, in order to obtain the results more quickly. For each technique identified the methodol-ogy, the database used, the algorithms developed and results are discussed in order to compare against the other techniques similarly identified. Also, the future prospects of the works identified are described, considering the biomedical engineering and medical fields. Thus, due to the structure of this work, it can be used by both a beginner researcher or a health profes-sional who wishes to gain a better understanding in this field, as well as for the experienced researcher who wants to know in detail the best and latest techniques developed in this area.
Finally it should be pointed out that we did not find any work devoted exclusively to research into 3D techniques for the automatic detection of pulmonary nodules in lung CT images. In order to fill this gap, this work proposes to examine the main techniques for automatic 3D detection of pul-monary nodules published until December, 2014, to identify and classify the most commonly used keywords, and to analyze the progress that has already been achieved in the area and the challenges that have not yet been overcome, and finally to assess the future prospects in this research area.
The remainder of this work is organized as follows: Section 2 details the databases and research methods used in the survey, as well as the set of steps developed during the systematic review proposed. Section 3 is devoted to the assessment of the CADe systems, and describes the objectives and the structures of these systems as well as the main theoretical concepts necessary for the correct interpretation of this study. Section 4 analyzes the results of the selected works, and the keywords more commonly used. Also this section presents an analysis of the more relevant works found in the survey, as well as information concerning computational algorithm training and statistical validation of the results and algorithm limitations. Section 5 is the Discussion section, in which we analyze the progress made, identify the challenges still to be overcome and future prospects in this field. Finally, in Section 6, the Conclusion summaries the findings obtained in this study.
2. Work selection criteria
The methodology adopted to carry out this systematic review is based on six steps: (1) develop relevant search terms for Web of Science, PubMed, Science Direct and IEEE Xplore databases; (2) execution of the database search; (3) removal of repeated works found; (4) apply the inclusion criteria: only 3D automated lung nodule segmentation techniques from CT images; (5) synthesis of the keywords obtained from the selected works and review the terms of highest incidence, in order to optimize search terms in future works; and, finally, (6) evaluation of each identified segmentation technique according to a defined set of metrics, such as: sensitivity, false positives per examination (FP), number of nodules used in the validation, size of the nodules, response time and types of nodules.
To perform the search in the databases the following logical expressions were used: (”3D” OR ”3-dimensional” OR ”three-dimensional”) AND (”de-tection” OR ”segmentation” OR ”cad” OR ”cade”) AND (”lung” OR ”lungs”
OR ”pulmonary” OR ”chest”) AND (”nodule” OR ”nodules” OR ”cancer” OR ”tumor” OR ”tumors”). These logical expressions were adapted to the syntax of the search engines of the Web of Science, PubMed, Science Direct and IEEE Xplore, according to the rules described by each database. In the proposed survey only works containing the logical expressions listed in their respective titles were included. In the initial survey, we obtained a total of 73 works, 44 in Web of Science, 5 in PubMed, 15 in IEEE Xplore and 9 in Science Direct. From these works, 22 were identified as repeated in the databases. After identification and removal of repeat works, a total of 51 works were assigned to the next step.
In the analysis and classification stage, each item was individually checked in order to classify it according to its main purpose: automated algorithms to segment lung nodules in 3D, 3D automatic classification of lung nodules, sys-tematic literature review of segmentation and/or classification of lung nod-ules, correlated work (which describes a nodule segmentation or classification technique, but not applied to the lung, as well as techniques for measuring nodule volumes that are not fully automatic) or others (any other works that cannot be classified in the previous categories). After this analysis, only 38 articles [24, 4, 18, 22, 25, 26, 27, 28, 29, 30, 31, 32, 33, 34, 35, 36, 37, 38, 39, 40, 41, 42, 43, 44, 45, 46, 47, 48, 49, 50, 51, 52, 53, 54, 55, 56, 57, 58] were identified as 3D automated algorithms to segment lung nodules in CT images, the target of this work.
3. CADe systems
3.1. Brief definition of a CADe system
In general, CADe systems have the following goals: highlight areas of the CT images that may have pulmonary nodules, contribute to the detection of small nodules (which can not be visually identified by the physicians) and reduce the evaluation time required.
CADe systems are an important tool in medical radiology. However, many systems do not have all the necessary requirements to be considered useful by most radiologists. Among the requirements necessary [59]:
• Improve the efficiency of the evaluation and maintain high sensitiv-ity. The sensitivity (aka true positive rate) of these systems can be calculated as:
Sensitivity = T P
T P + F N, (1)
where TP (true positive) this is when the system expresses a positive output for a sample that has the disease, and FN (false negative) is when the results from the system are given as negative for a sample that actually has the disease;
• A low number of false positives (FP). A false positive occurs when the system determines the existence of a disease when the sample does not have the disease. False positives can result in an increase of exam analysis time by radiologists, and may result in detection errors; • Have high-speed processing. This refers to the time required for the
system to respond to nodule detection requests;
• Present high level of automation, avoiding the need for manual oper-ations. The system should automatically receive Digital Imaging and Communications in Medicine (DICOM) files [60] of the exams, and process and store the results in standard files;
• Present low implementation costs, training, support and maintenance; • Detect different types, sizes and shapes of nodules, such as isolated nodules, micronodules (< 3 mm), partially solid, nodules attached to lung edges or lung cavities, and;
• Software safety assurance to prevent potential attacks that may result in data loss, lack of accuracy in the results, change, unavailability or misuse of data.
3.2. Structure of CADe systems
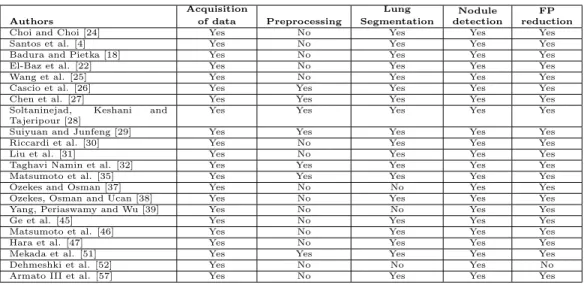
In general, CADe systems are composed of five main stages: acquisition of data, preprocessing, lung segmentation, nodule detection and the reduction of false positives. The stages considered by each of the selected works for the automated detection of pulmonary nodules in lung CT images are indicated in Table 1.
Authors Acquisition of data Preprocessing Lung Segmentation Nodule detection FP reduction
Choi and Choi [24] Yes No Yes Yes Yes
Santos et al. [4] Yes No Yes Yes Yes
Badura and Pietka [18] Yes No Yes Yes Yes
El-Baz et al. [22] Yes No Yes Yes Yes
Wang et al. [25] Yes No Yes Yes Yes
Cascio et al. [26] Yes Yes Yes Yes Yes
Chen et al. [27] Yes Yes Yes Yes Yes
Soltaninejad, Keshani and Tajeripour [28]
Yes Yes Yes Yes Yes
Suiyuan and Junfeng [29] Yes Yes Yes Yes Yes
Riccardi et al. [30] Yes No Yes Yes Yes
Liu et al. [31] Yes No Yes Yes Yes
Taghavi Namin et al. [32] Yes Yes Yes Yes Yes
Matsumoto et al. [35] Yes Yes Yes Yes Yes
Ozekes and Osman [37] Yes No No Yes Yes
Ozekes, Osman and Ucan [38] Yes No Yes Yes Yes
Yang, Periaswamy and Wu [39] Yes No No Yes Yes
Ge et al. [45] Yes No Yes Yes Yes
Matsumoto et al. [46] Yes No Yes Yes Yes
Hara et al. [47] Yes No Yes Yes Yes
Mekada et al. [51] Yes Yes Yes Yes Yes
Dehmeshki et al. [52] Yes No No Yes No
Armato III et al. [57] Yes No Yes Yes Yes
Table 1: Processing stages included in each of the selected works.
3.2.1. Acquisition of data
This step is responsible for obtaining the set of images used by the CADe system. In an ideal context, the acquisition will be accomplished through the integration between a PACS, a EMR and a CADe system. In this scenario, the lung CT images can be processed by the CADe system before being an-alyzed by the radiologist, thus the interpretation of the examination starts with the suspicious regions indicated by the CADe system. Additionally, through the EMR, the radiologist may have access to other clinical informa-tion that can aid in the diagnosis.
From the standpoint of development and design of CADe systems, there are some public databases which can be used for development, maintenance and training. Generally, these databases are used to train students, to serve as a repository for rare cases, and to allow comparisons between the perfor-mance of different CADe systems [61]. Among the more important public databases available are: Lung Image Database Consortium (LIDC) [62, 63], Lung Image Database Consortium and Image Database Resource Initiative (LIDC-IDRI) [64, 65], Early Lung Cancer Action Program (ELCAP) [7], Nederlands Leuvens Longkanker Screeningsonderzoek (NELSON) [66] and Automatic Nodule Detection 2009 (ANODE09) [67, 68].
The LIDC database is a publicly available database of 399 thoracic CT scans with nodule size reports and diagnosis reports, that serves as a med-ical imaging research resource. Four radiologists reviewed each scan using
the following process. In the first or “blinded” phase, each radiologist re-viewed the CT scan independently. In the second or “unblinded” review phase, results from all four blinded reviews were compiled and presented to each radiologist for a second review, allowing the radiologists to review their own annotations together with the annotations of the other radiologists. The results of each radiologist’s unblinded review were compiled to form the final unblinded review. The LIDC radiologists annotations include freehand out-lines of nodules ≥ 3 mm in diameter on each CT slice in which the nodules are visible, along with the subjective ratings on a five- or six-point scale of the following pathologic features: calcification, internal structure, subtlety, lobulation, margins, sphericity, malignancy, texture, and spiculation. The annotations also include a single mark (an approximate centroid) of nodules ≤ 3 mm in diameter as well as non-nodules ≥ 3 mm [63, 62, 69].
Guided by the premise that “public-private partnerships are essential to accelerate scientific discovery for human health” and their successes in this realm, the Foundation for the National Institutes of Health (FNIH) created the Image Database Resource Initiative (IDRI) in 2004 to further advance the efforts of the LIDC. The IDRI joined the five LIDC institutions with two ad-ditional academic centers and eight medical imaging companies. Through the IDRI, these companies provided additional resources to expand substantially the LIDC database to a targeted 1000 CT scans and to create a complemen-tary database of almost 300 digital chest radiographic images associated with a subset of these CT scans. As a result, the LIDC-IDRI database was ended up with 1018 scans (including the 399 scans from LIDC database), each of which includes images from a clinical thoracic CT scan and an associated XML file that records the results of a two-phase image annotation process evaluated by four experienced thoracic radiologists. The database contains 7,371 lesions marked “nodule” by at least one radiologist, and 2,669 of these lesions were marked “nodule ≥ 3 mm” by at least one radiologist, of which 928 (34.7%) received the same ratings from all four radiologists. These 2,669 lesions include nodule outlines and subjective nodule characteristic ratings [64, 65].
The ELCAP database, that became available in 2003, consists of 50 docu-mented low-dose CT scans for the performance evaluation of computer-aided detection systems. The NELSON trial has accrued 15,523 participants across four institutions since 2003. Annual CT screening studies were interpreted first at the local institution and then again at a central site. CT scans from the NELSON study have been used by researchers associated with the project
to investigate, for example, interobserver variability of semi- automated lung nodule volume measurements, the discrimination between benign and ma-lignant nodules, automated lung nodule detection, and automated lung seg-mentation. The research value of image databases acquired during clinical studies has been realized in other anatomic sites as well, such as CT colonog-raphy. The ANODE09 is a database of 55 scans from a lung cancer screening program and a web-based framework for objective evaluation of nodule de-tection algorithms. Any team can upload results to facilitate benchmarking [66, 64, 68].
3.2.2. Preprocessing
Preprocessing treatments are performed on the lung CT slices (images) in order to improve their quality, thus giving better results in nodule detection. This stage is important since the lungs also contain several structures that can be confused with nodules. Just eight of the selected works for this review indicate the preprocessing techniques used: linear interpolation [26, 29, 46], median filter [27, 28], morphological Hat operation [28], Gaussian filter [32, 52] and weighted-sum filter [51].
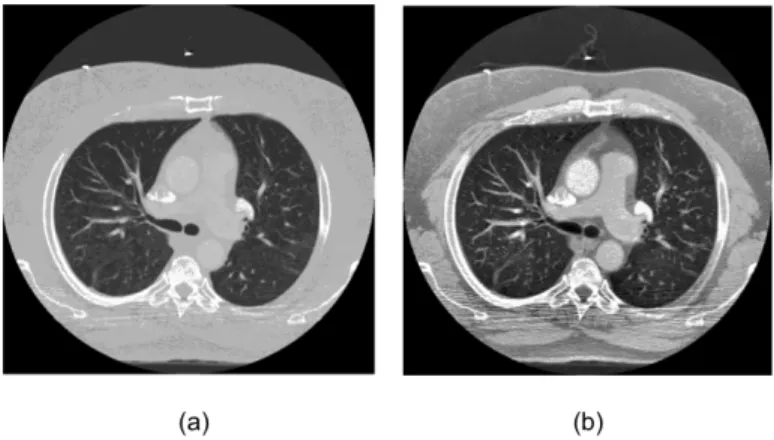
Other techniques that can be considered for the preprocessing stage are: enhancement filter [70, 71], contrast limited adaptive histogram equaliza-tion [72],auto-enhancement [73], wiener filter [73], fast Fourier transform [74], wavelet transform [74], anti-geometric diffusion [74], erosion filter [75], smoothing filters [76] and noise correction [76]. Figure 1 gives an illustration of preprocessing applied to a lung CT image, in which an improved distribu-tion of level colors and, consequently, a better visualizadistribu-tion of the lung and its structures, is accomplished.
3.2.3. Lung Segmentation
Lung segmentation is a crucial step for any CADe system that aims to contribute to the early diagnosis of cancer and other lung diseases. This task is challenging because of non-existing heterogeneity in the region of the lung, as well as the existence of similar density structures, such as arteries, veins, bronchi and bronchioles, and the use of different imaging devices with differ-ent protocols. The performance of a particular technique can be evaluated thought statistical metrics, such as accuracy, processing time (computational cost), as well as its level of automation. In general, the existing techniques can be classified into four categories: methods based on thresholding, de-formable models and shape or edge based models [22]. Figure 2 gives an
Figure 1: Example of an adaptive histogram-equalization of an image from LIDC-IDRI database: (a) is the original image and (b) is the equalized image.
example of lung segmentation using the thresholding and region growing methods and a selection of the two largest regions (eliminating the trachea).
Figure 2: Example of lung segmentation: (a) the original image and (b) the segmented image.
3.2.4. Nodule detection
After the definition of the search region of interest for the nodules (e.g., the segmented lung fields), the next step in a CADe system is nodule de-tection. The purpose of this step is to identify the presence of pulmonary nodules in the analyzed images. Early detection of lung nodules may increase the chance of patient survival [2], but this task is complex, as discussed by
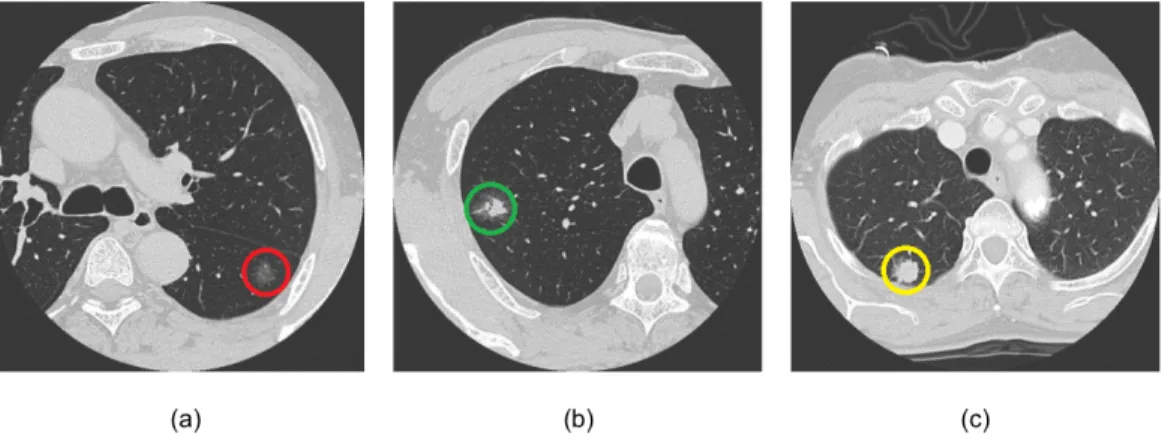
Quekel et al. [77] and Li et al. [78]. The nodules appear as circular objects of low contrast within the lungs. The difficulty of CADe systems is to dis-tinguish true nodules from shades, vessels and ribs. Additionally, the nodule features may vary depending on the type of nodule. As an example Figure 3 illustrates three 3D lung CT images adapted from Suzuki et al. [79], in which it is possible to identify three pulmonary nodules, one in each image. Their shapes, densities and locations are completely different. These difficulties contribute to making the detection of pulmonary nodules challenging.
Figure 3: Lung CT image: (a) a non-solid nodule (red color), (b) a partially solid nodule (green color) and (c) a solid nodule (yellow color).
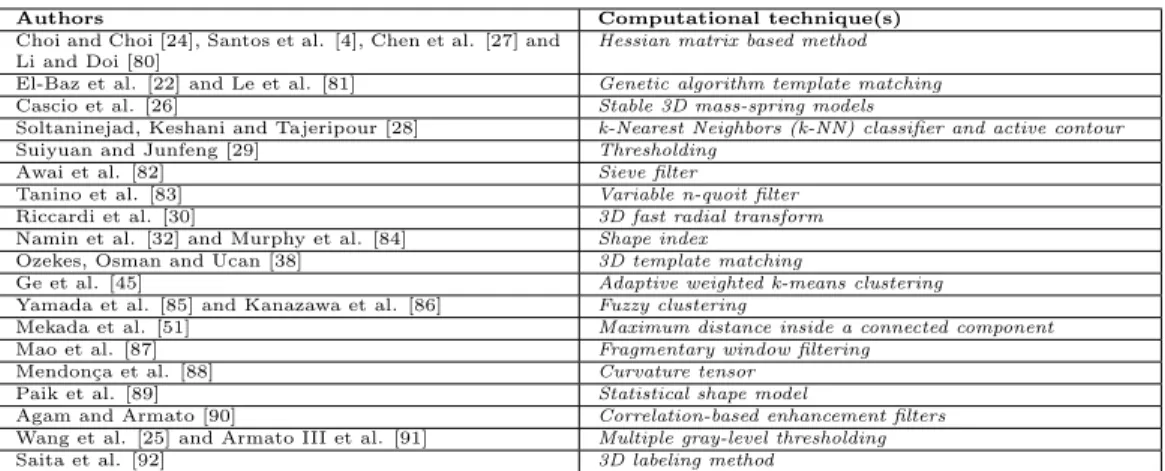
The computational techniques that have been used to carry out the auto-matic detection of pulmonary nodules in lung CT scan images are indicated in Table 2.
3.2.5. False positive reduction
One of the greatest difficulties encountered in current CADe systems is the relatively high number of false positives, which can hinder the correct interpretation of medical examinations. A high number of false positives usually confuses the radiologist in the interpretation task, thus reducing the efficiency of the CADe system. Additionally, radiologists may lose confidence in the CADe system as a useful tool. Consequently reducing the number of false positives is of great importance, while maintaining high sensitivity [93]. Reducing the false positive results is a challenge not only for the CADe systems but also for the radiologist during his/her interpretation of the im-age. The radiologist may also suffer interference factors such as fatigue,
Authors Computational technique(s) Choi and Choi [24], Santos et al. [4], Chen et al. [27] and
Li and Doi [80]
Hessian matrix based method El-Baz et al. [22] and Le et al. [81] Genetic algorithm template matching Cascio et al. [26] Stable 3D mass-spring models
Soltaninejad, Keshani and Tajeripour [28] k-Nearest Neighbors (k-NN) classifier and active contour
Suiyuan and Junfeng [29] Thresholding
Awai et al. [82] Sieve filter
Tanino et al. [83] Variable n-quoit filter
Riccardi et al. [30] 3D fast radial transform Namin et al. [32] and Murphy et al. [84] Shape index
Ozekes, Osman and Ucan [38] 3D template matching
Ge et al. [45] Adaptive weighted k-means clustering Yamada et al. [85] and Kanazawa et al. [86] Fuzzy clustering
Mekada et al. [51] Maximum distance inside a connected component
Mao et al. [87] Fragmentary window filtering
Mendon¸ca et al. [88] Curvature tensor
Paik et al. [89] Statistical shape model
Agam and Armato [90] Correlation-based enhancement filters Wang et al. [25] and Armato III et al. [91] Multiple gray-level thresholding
Saita et al. [92] 3D labeling method
Table 2: Computational techniques that have been used to carry out the automatic de-tection of pulmonary nodules in lung CT scan images.
subjectivity of the analysis, images acquired with improper configuration of the equipment and noise. A detailed analysis of the LIDC-IDRI database can help us understand the difficulties encountered during this task. In this database, each scan was analyzed by four experienced radiologists in two phases. In the first phase or “blinded” phase, each radiologist examined the scan without knowing the result of the analysis of the other three radiolo-gists. In the second phase or “unblinded” phase, each radiologist had the opportunity to inspect the result of the other radiologists and review, or not, his/her analysis. Even with the two phases, there was not a consensus in all cases. From the 2,669 lesions marked “nodule ≥ 3 mm” by at least one ra-diologist, only 928 (34.7%) received similar results from all four radiologists. This shows that the image analysis task is susceptible to many subjective factors, and therefore the false positive reduction step needs to be improved [62].
The elimination of false positives can be performed by analyzing the ex-tracted features of the potential nodule found. Initially, potential nodules are segmented and their features are extracted; the main features being: in-tensity pixel values, morphology and texture. Using these features, machine learning techniques are applied in order to detect the true nodules and false nodules. A major difficulty of this step is to balance the number of samples used and their types properly, since different types, shapes and locations of nodules can confuse the classifier. However, using public databases may allow replication of results and the improvement of developed techniques,
which initially was not possible due to the use of private datasets.
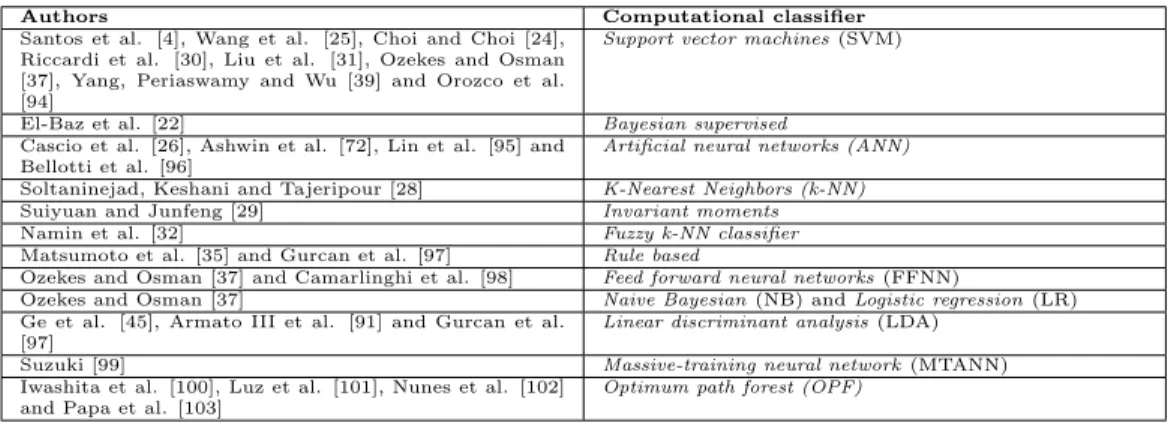
The computational classifiers that have been used in the false positive reduction step are indicated in Table 3.
Authors Computational classifier
Santos et al. [4], Wang et al. [25], Choi and Choi [24], Riccardi et al. [30], Liu et al. [31], Ozekes and Osman [37], Yang, Periaswamy and Wu [39] and Orozco et al. [94]
Support vector machines (SVM)
El-Baz et al. [22] Bayesian supervised
Cascio et al. [26], Ashwin et al. [72], Lin et al. [95] and Bellotti et al. [96]
Artificial neural networks (ANN) Soltaninejad, Keshani and Tajeripour [28] K-Nearest Neighbors (k-NN) Suiyuan and Junfeng [29] Invariant moments
Namin et al. [32] Fuzzy k-NN classifier
Matsumoto et al. [35] and Gurcan et al. [97] Rule based
Ozekes and Osman [37] and Camarlinghi et al. [98] Feed forward neural networks (FFNN)
Ozekes and Osman [37] Naive Bayesian (NB) and Logistic regression (LR) Ge et al. [45], Armato III et al. [91] and Gurcan et al.
[97]
Linear discriminant analysis (LDA)
Suzuki [99] Massive-training neural network (MTANN)
Iwashita et al. [100], Luz et al. [101], Nunes et al. [102] and Papa et al. [103]
Optimum path forest (OPF)
Table 3: Computational classifiers that have been used for the false positive reduction task.
4. Selected works
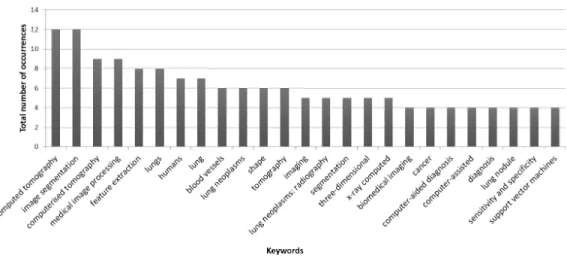
During the analysis of the works identified as being related to lung 3D segmentation techniques from lung CT images, a great variation of keywords were used. In order to identify the most effective keywords to search for works related to 3D segmentation of pulmonary nodules, a statistical analysis was applied to the keywords (Figure 4). Thus the latest works with best results, using the chosen keywords, are analyzed in this section.
Choi and Choi [24] developed an automatic technique for the detection of lung nodules based on a feature descriptor guided by the 3D shape of the ob-ject. In this technique, after the lung nodule segmentation, potential nodules are detected using multi-scale dot enhancement filtering, followed by extract-ing features of each nodule and their refinement usextract-ing the eliminatextract-ing edges technique. The proposed method was validated using the LIDC database (acquired up to 2009). In total 84 exams with 148 isolated, juxtavascular and juxtapleural nodules with diameters between 3 and 30 mm were used. The algorithm had a sensitivity of 97.5%, accuracy of 99.0%, specificity of 97.5%, 0.998 area under the receiver operating characteristic (ROC) curve and 6.76 false positives per examination.
Santos et al. [4] created a methodology for automatic detection of small lung nodules (with diameters between 2 and 10 mm) using Gaussian mixture
Figure 4: Keywords most used in the works classified as being related to the lung 3D segmentation of pulmonary nodules from CT images.
models, Tsallis entropy and SVM. Other techniques used have already been implemented in several similar applications, such as region growing. Other more restrictive techniques were used, such as hessian matrix and Shannon’s entropy. The algorithm was validated in the LIDC database, obtaining a sensitivity of 90.6%, specificity of 85%, accuracy of 88.4% and 1.17 false positives per slice. A total of 112 exams and 118 nodules were used for training. For validation, 28 exams and 72 nodules were used. The algorithm presented a computational cost of 3.7 minutes per exam.
Badura and Pietka [18] developed a new approach to the segmentation of different types of lung nodules on lung CT images. The technique is based on two fields of computational intelligence: fuzzy connectivity (FC) and evo-lutionary computation. The method was validated in LIDC and LIDC-IDRI databases, including isolated, juxtavascular, juxtapleural and low density nodules, with diameters between 3 and 30 mm. A total of 23 nodules from LIDC and 551 nodules from LIDC-IDRI were used. The best results were obtained using the MRFC-OB variant of the proposed algorithm, which cor-rectly identified the voxels of nodules in 83.03 ± 13.84% (LIDC-IDRI) and 91.12 ± 15.79% (LIDC) of the cases. The true positive rate was equal to 50%
(TPR50) of the exams where the voxels were identified by 50% of radiologists
as belonging to a nodule. In the exams where the voxels were identified by
correctly identified the voxels of nodules in 95.50 ± 7.86% (LIDC-IDRI) and 99.94 ± 0.22% (LIDC) of the cases.
El-Baz et al. [22] proposed a new algorithm for lung nodule detection us-ing Genetic Algorithm Template Matchus-ing. The algorithm is based on three steps: (i) isolate nodules, arteries, veins, bronchi and bronchioles from other anatomical structures; (ii) isolate the nodules using deformable 3D and 2D templates, describing the geometry and the distribution of gray levels typical of a nodule of the same type, and, finally, (iii) eliminate the false positives using three characteristics that define the true nodules robustly. The algo-rithm was validated in a private database, presenting 82.3% of sensitivity and 9.2% of false positives, i.e, only 12 sample of the whole set. A total of 200 exams and 130 calcified, not calcified and cavity nodules, with diameters greater than 10 mm were used. The algorithm spent 5 minutes per exam.
Wang et al. [25] created a new SVM based on the 3D matrix pattern technique in order to prevent the loss of structural and local information that usually occurs in one-dimensional and two-dimensional approaches of pulmonary nodule detection. Thus, the 3D volumes of the nodules consid-ering the quantitative region of interest (ROI)-based analysis can be used directly as an input for the training and test phases. According to the au-thors, the use of three-dimensional patterns can effectively reduce the high number of false positives compared to 1D and 2D analysis. The algorithm was validated in a private database of 196 exams and 108 nodules, with a sensitivity of 98.2%, 0.995 area under the ROC curve and 9.1 false positives per image. The nodules used had diameters of between 5 and 30 mm and the types isolated, juxtavascular and juxtapleural. A total of 13 exams and 32 nodules and non-nodules were used for the algorithm training.
Cascio et al. [26] proposed an aid diagnosis system able to detect small lung nodules (3 mm diameter) on CT scans based on stable 3D mass–spring models. This method consists of an automated initial selection from the list of potential nodules (isolated and juxtapleural), and their respective segmenta-tion and classificasegmenta-tion. Techniques such as region growing and mathematical morphology were applied in order to include juxtapleural nodules. The Sta-ble 3D Mass-Spring Model (MSM) combined with spline curves was used to perform the segmentation and feature extraction. The system was evaluated in a set of 84 exams and 148 nodules from the LIDC database, obtaining a sensitivity of 97% with 6.1 false positives per exam. A reduction to 2.5 false positives per exam was obtained with a sensitivity of 88%. The nodules used had diameters from 3 to 30 mm and the algorithm presented a performance
of 1.5 minutes per exam.
Chen et al. [27] proposed a new algorithm based on local intensity struc-ture analysis and surface propagation in 3D chest CT images to segment and separate pulmonary nodules and vessels. These authors used the line struc-ture enhancement (LSE) and blob-like strucstruc-ture enhancement (BSE) filters. A procedure known as front surface propagation (FSP) was used to perform accurate segmentation of vessels and nodules. The evaluation used a private database and the LIDC database. The private database had 20 exams and 416 nodules. The LIDC database used had 20 exams and 55 nodules, all isolated with diameters from 3 to 27 mm. In the private database, the algo-rithm had a sensitivity of 95% with 9.8 false positives per exam. In the LIDC database, the algorithm had a sensitivity of 91.5% with 10.5 false positives per exam.
Soltaninejad, Keshani and Tajeripour [28] created a methodology for seg-mentation and visualization of nodules based on four steps: (i) a median filter is used for noise removal and a morphological Hat operation is performed for image enhancement, then the lungs are segmented using an adaptive thresh-olding algorithm; (ii) the nodule detection was two parts: feature extraction and classification, using 2D stochastic characteristics for feature extraction and 3D anatomical features for removal of false positives, by applying a k-NN classifier; (iii) the nodule contours are extracted using active contours and, finally, (iv) a 3D visualization technique is applied to the segmented nodules to evaluate the result. To evaluate this solution 58 nodules (solid, non-solid, bronchioles attached, lung wall attached and cavity) from three databases were used: private 1, private 2 and ANODE09. The algorithm had a sensitivity of 90% with 5.63 false positives per exam.
Suiyuan and Junfeng [29] developed a technique based on shape features capable of detecting lung nodules through interpolation, segmentation, and recognition as well as a search for suspicious regions. Initially, the test images are interpolated to the same scales in the X, Y and Z axes, in order to recover the original 3D shape of the nodules. Then, the region of the pulmonary parenchyma is segmented and nodule candidates are obtained by thresholding
and region growing. Finally, false positives are eliminated by the use of
invariant moments. According to the authors, the algorithm recognized 100% of nodules with 1.0 false positive per exam.
Riccardi et al. [30] presented a new system for pulmonary nodule de-tection on CT scans. Initially, the lung tissue is sectioned using histogram thresholding, region growing and mathematical morphology. Then, the 3D
fast radial filter is applied in order to select potential nodules, whose geomet-ric characteristics are obtained through the scale space analysis technique. Finally, a false positive reduction step is applied using a SVM-based feature extraction algorithm that uses the techniques of maximum intensity projec-tion processing and Zernike moments. The system was evaluated in a series of 154 CT exams and 117 nodules (isolated, juxtapleural and juxtavascular) from the LIDC database, with diameters equal to or greater than 3 mm. The system had a sensitivity of 71% with 6.5 false positives per exam. The number of false positives was reduced to 2.5 with a sensitivity of 60%. An independent test using the ANODE09 database obtained an overall score of 0.310.
Liu et al. [31] proposed a new algorithm based on support vector
ma-chines. For training and testing the SVM-based classifier, a simulation
method of lung nodules based on three-dimensional space was created. The detection method is based on several steps, including simulation and 3D insertion nodule, lung segmentation, extraction of the potential nodules, cal-culation of the geometry and intensity characteristics as well as the reduction of false positives. The algorithm was validated in three databases: a private database, LIDC, and a database with simulated data, with respectively 10, 21 and 144 isolated nodules with diameters between 3 and 27 mm. Nine ex-ams of a private database, 23 exex-ams of LIDC and 129 exex-ams of the simulated database were used. The algorithm had a sensitivity of 86.0%, accuracy of 90%, specificity of 92% and 4.9 false positives per exam.
Namin et al. [32] created a methodology for pulmonary nodule detection and classification on CT scans using volumetric shape index (SI) and fuzzy k-NN. First, the pulmonary parenchyma is segmented by thresholding. Then, Gaussian filters are applied for noise reduction and nodule optimization. The next step is to use the SI technique to detect suspicious nodules, also including the vessels. With this technique, it is possible to recognize the nodules that are attached to vessels, lung wall or mediastinal surface. Then, characteristics such as roundness, mean intensity and variance, stretching and variations in potential nodule edges are extracted to classify the nodules in malignant or benign. The method was evaluated in the database LIDC using 63 exams and 134 nodules with diameters between 2 and 20 mm. The algorithm had a sensitivity of 88.0% and 10.3 false positives per exam.
Matsumoto et al. [35] developed a technique for pulmonary nodules detec-tion based on the analysis of the three-dimensional characteristics of nodules and their surroundings, in order to separate nodules from pulmonary
ves-sels. Additionally, the performance of a radiologist with and without the support of the proposed technique was evaluated. To evaluate the technique, 30 exams from a private database with 66 solid and subsolid nodules with diameters equal to or greater than 4 mm were used. The algorithm had a sensitivity of 79.0% and 4.5 false positives per exam.
Ozekes and Osman [37] proposed an diagnosis aid system based on 3D fea-ture extraction and learning based algorithms for detecting pulmonary nod-ules on CT scans. Initially, the eight directional search technique is applied to extract the regions of interest. Then, several 3D features are extracted, such as: connected component labeling, straightness, thickness, vertical and hor-izontal widths, regularity and vertical/horhor-izontal relationship between dark pixels. To classify each region of interest the following techniques were used: FFNN, SVM, NB and LR. To evaluate the algorithm 11 exams with 11 nod-ules from LIDC, with diameters from 3 to 16 mm were used. The technique had a sensitivity of 100%, specificity of 81.5%, 0.850 area under the ROC curve and 44 false positives per exam.
Ozekes, Osman and Ucan [38] developed a new approach for detecting pulmonary nodules based on four steps. First, in order to reduce the number of regions of interest and the processing time, the lung is segmented using the Genetic Cellular Neural Networks technique. Then, for each lung region, regions of interest are obtained by the eight directional search technique. The 3D volume is obtained by combining all the 2D regions of interest. A 3D template is created to find similar nodule structures. Finally, thresholding based on fuzzy logic rules is applied to the regions of interest. To evaluate the algorithm 16 exams with 16 nodules from LIDC, with diameters between 3.5 and 7.3 mm were used. The technique had a sensitivity of 100% with 13.375 false positives for exam.
Yang, Periaswamy and Yu [39] created a methodology based on a new 3D volume shape descriptor to reduce the number of false positives for ground-glass opacity nodules (GGO). The volume and 3D format of the nodules are created by the concatenation of histograms and spatial gradient directions. The algorithm was evaluated on 216 scans with 324 nodules (81 GGOs) of a private database, with diameters between 2 and 18 mm. The technique had a sensitivity of 81.0% with 4.3 false positives per exam.
Ge et al. [45] proposed a new algorithm using a 3D gradient field method and 3D ellipsoid fitting to optimize the false positive reduction step for the detection of pulmonary nodules. The technique proposes the development of new features based on the 3D layout of the volumes of interest. 3D gradient
descriptors were formulated and 19 new gradients features were derived from the statistics. Six ellipsoidal characteristics were obtained by calculating the lengths and the length ratios of the main axes of an ellipsoid defined on the segmented object. Both field gradient ellipsoidal features and characteristics were designed to distinguish spherical objects, such as pulmonary nodules, from elongated objects, such as vessels. The performance of the reduction of false positives in the 25-new dimensional space was compared to the per-formance of a 19-dimensional space using features extracted with previously developed methods. The performance characteristics combined in space us-ing 44 dimensions, was also evaluated. To evaluate the classification linear discriminant analysis was used. The parameters used for feature selection algorithm were also used to optimize the simplex. The algorithm perfor-mance was evaluated in a private database with 82 exams and 116 isolated, juxtapleural and juxtavascular nodules with diameters between 3 and 30.6 mm. The algorithm presented 96% of sensitivity with 6.92 false positives per image and 80% of sensitivity with 0.34 false positives per image.
Matsumoto et al. [46] defined a new 3D feature called diminution index that is able to differentiate vessels and pulmonary nodules attached to vessels. The algorithm was trained with 4 exams and 30 nodules. The evaluation was conducted in a private database with 12 exams and 100 nodules with diameters between 3 and 5 mm. The algorithm had a sensitivity of 78% and 5.3 false positives per exam.
Hara et al. [47] developed a new recognition approach using second order autocorrelation and multi-regression analysis to detect small nodules (diam-eter ≤ 7 mm) on CT scans. By combining with a previously developed technique, the algorithm had a sensitivity of 94% with 2.05 false positives per exam. The validation was performed on a private database containing 139 nodules.
Mekada et al. [51] proposed a new method using shape features and a minimum directional difference filter (Min-DD) for detection of small pul-monary nodules on CT scans. Initially, potential nodules are detected using the maximum distance inside a connected component (MDCC). Then, the reduction of false positives is performed using the technique Min-DD. The method performance was evaluated in a private database of 7 tests and 361 nodules with a diameter greater than 2 mm. The algorithm had a sensitivity of 71.0% and 7.4 false positives per exam.
Dehmeshki et al. [52] presented a technique using shape based region growing for segmentation of pulmonary nodules. Initially, 3D features are
calculated for each voxel. Then, shape features are extracted. Finally, a hy-brid extraction method incorporating the shape features and region growing based on 3D intensity is applied, realizing highly accurate separation between objects that have different shapes but similar intensity values. The algorithm was evaluated in a private database containing 6 exams and 33 nodules, with sensitivity of 91.0% and 1.29 false positives per image.
Armato III et al. [57] developed a new technique that incorporates two-and three-dimensional analysis to explore the data obtained from a CT scan. Initially the lungs are segmented by thresholding. The rolling ball technique is applied to optimize the segmentation of the lungs. The set of segmented images are iteratively thresholded and a 10 points scheme is used to identify continuous three-dimensional structures. Structures with volumes below the threshold level are considered as a potential nodules, which are subjected to two and three-dimensional analyses. To distinguish between the potential nodules and non nodules, a linear discriminant analysis technique is used. The technique was applied in a private database with 17 exams and 187 nodules, with diameters between 3.1 and 27.8 mm, with sensitivity of 72% and 4.6 false positives per exam.
Some of the selected works are not fully automatic, as require user inter-vention, or nor indicate the values of sensitivity and/or about false positives: [33], [34], [36], [40], [41], [42], [43], [44], [48], [49], [50], [53], [54], [55], [56] and [58]. Although these works are not the focus of this review, they are briefly introduced here.
Wang et al. [33] proposed the detection of pulmonary nodules by combin-ing the extraction of the nodules by multi-directions PCA with their identi-fication based on a 3D backpropagation neural network.
Yang et al. [34] used a three-dimensional pulmonary nodule detection method for thoracic CT scans based on a bounding box technique and a three-dimensional sphere-enhancement filter for nodule candidate selection in order to enhance the volume of interest (VOI). Then, 3D features are extracted from the VOI to train a neural network classifier.
Wang, Engelmann and Li [36] and Wang, Engelmann and Li [41] sug-gested an algorithm based on a VOI built at the position of the nodule under study. This VOI is transformed into a 2D image by use of a “spiral-scanning” technique in order to simplify the segmentation task. It is used a dynamic programming technique to delineate the “optimal” outline of the nodule in the 2D image, which is transformed back into the 3D image space in order to provide the interior of the nodule.
Zeng et. al [40] proposed a method that assumes nonrigid lung deforma-tion and rigid tumor. They use the B-Spline-based nonrigid transformadeforma-tion to model the lung deformation while imposing rigid transformation on the tumor to preserve its volume and shape [104, 105, 106]. A 2D graph-cut algorithm is used to segment a 3D dataset.
Farag et al. [42] suggested two new adaptive probability models of visual appearance of small 2D and large 3D pulmonary nodules to control the evolu-tion of deformable boundaries. The appearance prior is modeled based on a translation and rotation invariant Markov-Gibbs random field of voxel inten-sities with pairwise interaction analytically identified from a set of training nodules. The nodule appearance model is detached from the mixed distri-bution using its close approximation with a linear combination of discrete Gaussians.
Way et al. [43] proposed a 3D active contours model based on
two-dimensional active contours (AC) with the addition of three new energy components to take advantage of the 3D information: gradient, curvature and energy mask. The search for the best energy weights in the 3D AC model is guided by the simplex optimization method. Morphological and
gray-level features were extracted from the segmented nodule. The
rub-ber band straightening transform (RBST) is applied to the shell of voxels surrounding the nodule. Additionally, texture features based on run-length statistics are extracted from the RBST image. Finally, a linear discriminant analysis classifier with stepwise feature selection based on a second simplex optimization is used to select the most effective features.
Zhang et al. [44] used a new automated method to segment juxtapleu-ral nodules in which a quadric surface fitting procedure is used to build a boundary between the juxtapleural nodule under study and its neighboring pleural surface. Additionally, a scheme based on a parametrically deformable geometric model was developed to cope the problem of segmenting nodules attached to vessels.
Ge et al. [48] suggested 3D gradient field descriptors and derived 19 gradient field features from their statistics. The gradient field features and ellipsoid features were used to distinguish spherical objects such as lung nod-ules from elongated objects such as vessels.
Okada, Comaniciu and Krishnan [49] proposed a robust algorithm for segmenting 3D pulmonary nodules in CT scans. The method is based on parametric Gaussian model to adjust the volumetric data evaluated in the Gaussian scale-space and a non-parametric 3D segmentation scheme based
on the normalized gradient ascent method to define the attraction to the target tumor in the 4D spatial intensity joint space.
Fetita et al. [50] proposed a method based on a specific gray-level math-ematical morphology operator, the SMDC-connection cost, to be used in the 3D space of the thorax volume in order to discriminate lung nodules from other dense (vascular) structures.
Dehmeshki, Ye and Costello [53] presented a new method for shape based segmentation of 3D medical images. The 3D geometric information is cal-culated for each voxel by computing the partial derivatives of the 3D input image. The shape features of the iso-intensity surfaces are then extracted and combined with a 3D intensity-based region growing algorithm to accurately identify connected objects with different shapes but of similar intensity.
Fan et al. [54] suggested an approach for the automatic segmentation of lung nodules in a given VOI from high resolution multi-slice CT images by dynamically initializing and adjusting a 3D template and analyzing its cross correlation with the structure of interest.
Armato et al. [55] developed an automated method to analyze the three-dimensional nature of structures in CT scans and identify those structures that represent lung nodules. Contiguous three-dimensional structures are identified in each thresholded lung volume and the structures that satisfy a volume criterion define an initial set of nodule candidates. A feature vector is then computed for each nodule candidate. A rule-based scheme is applied to the initial candidate set to reduce the number of nodule candidates that correspond to normal anatomy.
Delegacz et al. [56] designed a 3D visualization system to aid physicians in observing abnormalities of the human lung. An segmentation filter was developed to enhance the lung boundaries and filter out small and medium bronchi from the original images. The pairs of original and filtered images are processed with the contour extraction method to only identify the lung field for further study. In the next step, the segmented lung images containing the small bronchi and lung textures are used to generate the volumetric dataset to be inputed into the 3D visualization system. Additional processing is performed to smooth the 3D lung boundaries.
Zhao et al. [58] developed a 3D multicriterion automatic segmentation algorithm to improve the accuracy of delineation of pulmonary nodules on helical computed tomography (CT) images by removing their adjacent struc-tures. The algorithm applies multiple gray-value thresholds to nodule ROIs. At each threshold level, the nodule candidate in the ROI is automatically
detected by labeling 3D connected components, followed by a 3D morpho-logic opening operation. Once a nodule candidate is found, its two specific parameters, gradient strength of the nodule surface and a 3D shape com-pactness factor, are computed. The optimal threshold is then determined by analyzing these parameters.
To compare the articles identified in this review, the following attributes were used: sensitivity, false positives per examination (FP), number of nod-ules used in the validation, size of the nodnod-ules, response time and types of nodules. These attributes are present in most of the selected articles. 16 articles were excluded for not presenting sensitivity and or false positives. The comparison is summarized in Table 4.
5. Discussion
During the analysis of the works selected for this review, it was noted that several of the proposed techniques presented potential for building medical diagnosis aid tools. Some techniques have achieved sensitivity greater than 95%, such as the ones proposed by Choi and Choi [24], Badura and Pietka [18], Wang et al. [25], Cascio et al. [26], Chen et al. [27], Suiyuan and Junfeng [29], Ozekes and Osman [37], Ozekes, Osman and Ucan [38]. However, most of the techniques that had a sensitivity greater than 95% had a high rate of false positives, and other issues that need a detailed analysis.
Choi and Choi [24] had a false positive rate of 6.76 per exam but only 148 nodules were used in the analysis. Badura and Pietka [18] obtained sensitivity values of 95.5% and 99.94% in LIDC and LIDC-IDRI databases, with a low false positive rate. However, this sensitivity was obtained in cases that all four radiologists positively confirmed that the structures were considered as nodules. In cases where only two of the four radiologists confirmed the nodules, the sensitivity dropped significantly, reaching values of 91.12% and 83.03%. Wang et al. [25] obtained excellent results in sensitivity, but with a false positive rate of 9.1 per image. Additionally, the database used is not public, which prevents the replication of results.
Cascio et al. [26] showed sensitivity of 97%, but with 6.1 false positives per exam. When the sensitivity was reduced to 88%, the technique achieved a better rate of false positives, standing in this case at 2.5 per exam. Chen et al. [27] showed 9.8 false positives per exam when using a particular database. In LIDC database, the algorithm showed less sensitivity in relation to the private database, with 10.5 false positives per exam. Suiyuan and Junfeng
Metho d Y ear Sensitivit y (%) FP/exam N °of no dules Size Resp onse time No d ule t yp es Choi and Choi [24] 2014 97.5 6.76 148 3-30 mm NI Isolated, juxta v ascular and juxtapleural San tos et al. [4] 2014 90.6 1.17/image 72 2-10 mm 3.7 min/exam NI Badura and Pietk a [18] 2014 83.03 and 91.12 0.49% and 9.15% 574 3-30 mm 6.53 s/image Isolated, juxta v ascular, juxtapleural and lo w densit y El-Baz et al. [22] 2013 82.3 9.2% 130 ≥ 10 mm 5 min/exam Calcified, not calcified and ca vit y W ang et al. [25] 2013 98.2 9.1/image 108 5-30 mm NI Isolated, juxta v ascular and juxtapleural Cascio et al. [26] 2012 97.0 and 88.0 6.1 and 2. 5 148 3-30 mm 1.5 min/exam Isolated and juxtapleural Chen et al. [27] 2012 95.0 and 91.5 9.8 and 10.5 416 and 55 3-27 mm NI Isolated Soltaninejad, Keshani and T a jerip our [28] 2012 90.0 5.63 58 NI NI Solid, non solid, bronc hi-oles attac hed, lung w all at-tac hed and ca vi t y Suiyuan and Junfeng [29] 2012 100.0 1.0 NI NI NI NI Riccardi et al. [30] 2011 71.0 and 60.0 6.5 and 2. 5 117 ≥ 3 mm NI Isolated, juxta v ascular and juxtapleural Liu et al. [31] 2010 86.0 4.9 175 3-27 mm NI Isolated T agha vi Namin et al. [32] 2010 88.0 10.3 134 2-20 mm NI NI Matsumoto et al. [35] 2008 79.0 4.5 66 ≥ 4 mm NI Solid and subsolid Ozek es and Osman [37] 2008 100.0 44 11 3-16 mm NI NI Ozek es , Osman and Ucan [38] 2008 100.0 13.375 16 3.5-7.3 mm NI NI Y ang, P eriasw am y and W u [39] 2007 81.0 4.3 324 2-18 mm NI Solid and GGO Ge et al. [45] 2005 96.0 and 80.0 6.92 and 0.34/image 116 3-30.6 mm NI Isolated, juxtapleural and juxta v ascular Matsumoto et al. [46] 2005 78.0 5.3 100 3-5 mm NI NI Hara et al. [47] 2005 94.0 2.05 139 ≤ 7 mm NI NI Mek ada et al . [51] 2003 71.0 7.4 361 ≥ 2 mm NI NI Dehmeshki et al. [52] 2003 91.0 1.29/image 33 NI NI NI Armato I I I et al. [57] 1999 72.0 4.6 187 3.1-27.8 mm NI NI T able 4: 3D main tec hniques for automatic detection of pulmonary no dules from lung CT images. NI = not informed.
[29] presented a technique that detects 100% of the database nodules with only 1.0 false positive per exam. However, the number of nodules used in the validation, their diameters and types were not informed, among other information necessary for comparison. For these reasons, it is not possible to state that these results can be replicated in other databases.
The works of Ozekes and Osman [37] and Ozekes, Osman and Ucan [38] also showed sensitivity of 100%, but with false positive rates located in 44 and 13.375 per exam, respectively. Additionally, the number of nodules used for validation was only 11 and 16. Also, the types of nodules used were not informed. For these reasons, we cannot state that these results can be replicated in other databases.
Only 3 studies presented false positive rate less than 2 per exam. Santos et al. [4] showed sensitivity of 90.6% and 1.17 false positives per examination. However, only 72 nodules were used for validation. Suiyuan and Junfeng [29] had a rate of only 1.0 false positive per test, but the number of nodules used in the validation, their diameters and types were not informed, among other information necessary for comparison. Finally, Dehmeshki et al. [52] showed sensitivity of 91.0% and only 1.29 false positives per examination. However, only 33 nodules were used in a private database, and therefore, it is not possible to say that this performance will be replicated in tests with public databases.
Hence, it is clear that even the latest techniques have not yet overcome all the challenges presented in the task of detecting pulmonary nodules on CT scans. The increased sensitivity associated to low false positive rate, the ability to recognize different types, shapes and sizes of nodules, and easy integration with EMR and PACS, are essential to give credibility to CADe systems and allow their use in daily medical practice.
5.1. Future prospects
We believe that further research is needed to develop CADe systems or
to optimize existing systems. Additionally, we also believe that a closer
relationship between researchers and the medical community is necessary, since the lack of recognition of some specific needs have hindered the wide use of CADe systems. For us, the challenges that must be overcome to allow the use of CADe systems in daily medical practice, are:
• development of new techniques, or change existing ones, in order to increase the sensitivity and maintain a low number of false positives;
• the ability to detect different types of nodules (solid, partially solid or non-solid) at different positions, whether isolated, juxtavascular or juxtapleural;
• observe the evolution of CT scanners and develop algorithms that can detect and properly target micronodules (≤ 3 mm);
• development of a platform integration between EMR and PACS, ob-serving industrial standards;
• use a large database of pulmonary nodules for algorithm evaluation, containing all types of nodules and in all locations, observing the pro-portion of the cases identified in the world and in specific regions; • promoting approximation between the many parties involved in the
process, such as government, physicians, patients, engineers, scientists and technicians.
6. Conclusion
This paper presented a critical review of techniques of automatic pul-monary nodule detection on 3D CT scans. The research included articles published up to December, 2014 on Web of Science, PubMed, Science Direct and IEEE Xplore databases. Advances in increasing sensitivity and reducing false positives have been obtained, but ideal rates are still to be achieved.
In general, many published studies showed potential for use in medical practice. However, some requirements still need to be achieved in order to facilitate their acceptance and use. For this reason, a closer relationship between the researchers and the medical community is necessary, since the lack of recognition of the specific needs have hindered a wider use of CADe systems. This will only be possible through a joint effort between the involved parties in the process, including government, physicians, patients, engineers, scientists and technicians.
For this reason, we believe that only this effort will foster the development of techniques and the generation of results closer to the needs of physicians, to be adopted in daily practice. Moreover, the integration of CADe systems with EMR and PACS is extremely important, and the improvements in sensitivity and reduction of false positives are essential requirements to generate reliable results.
Considering the critical review carried out, the analysis and evaluation of techniques with the best results, by analyzing the keywords that allowed us to obtain more effective results in the research and suggestions of future prospects in the development of CADe systems, this review is particularly useful for researchers working in the development and/or improvement of CADe systems for pulmonary nodule detection.
Acknowledgments
The authors thank IFCE (Instituto Federal do Cear´a) for academic
sup-port, CAPES (Coordena¸c˜ao de Aperfei¸coamento de Pessoal de N´ıvel
Supe-rior) for the financial support and LESC (Laborat´orio de Engenharia de
Sis-temas de Computa¸c˜ao) for providing the laboratory infrastructure for the
execution of the research activities reported in this paper. Victor Hugo
C. de Albuquerque acknowledges the sponsorship from the CNPq
(Con-selho Nacional de Desenvolvimento Cient´ıfico e Tecnol´ogico) via grants #
470501/2013-8 and # 301928/2014-2. References
[1] R. Siegel, D. Naishadham, A. Jemal, Cancer Statistics, 2013, CA: a cancer journal for clinicians 63 (1) (2013) 11–30.
[2] N. Camarlinghi, Automatic detection of lung nodules in computed to-mography images: training and validation of algorithms using public research databases, The European Physical Journal Plus 128 (9) (2013) Article ID 110, 21 pages. doi:10.1140/epjp/i2013-13110-5.
[3] S. Diederich, M. G. Lentschig, T. R. Overbeck, D. Wormanns, W. Hein-del, Detection of pulmonary nodules at spiral CT: comparison of maxi-mum intensity projection sliding slabs and single-image reporting, Eu-ropean Radiology 11 (8) (2001) 1345–1350.
[4] A. M. Santos, A. O. de Carvalho Filho, A. C. Silva, A. C. de Paiva, R. A. Nunes, M. Gattass, Automatic detection of small lung nodules in 3D CT data using Gaussian mixture models, Tsallis entropy and SVM, Engineering Applications of Artificial Intelligence 36 (2014) 27–39.
[5] M. Lederlin, M. Revel, A. Khalil, G. Ferretti, B. Milleron, F. Laurent, Management strategy of pulmonary nodule in 2013, Diagnostic and Interventional Imaging 94 (11) (2013) 1081–1094.
[6] D. M. Hansell, A. A. Bankier, H. MacMahon, T. C. McLoud, N. L.
M¨uller, J. Remy, Fleischner Society: glossary of terms for thoracic
imaging, Radiology 246 (3) (2008) 697–722.
[7] ELCAP, ELCAP public lung image database, acessed: 2015-05-27 (2015).
URL http://www.via.cornell.edu/lungdb.html
[8] C. I. Henschke, D. I. McCauley, D. F. Yankelevitz, D. P. Naidich, G. McGuinness, O. S. Miettinen, D. M. Libby, M. W. Pasmantier, J. Koizumi, N. K. Altorki, J. P. Smith, Early Lung Cancer Action Project: overall design and findings from baseline screening, Lancet 354 (9173) (1999) 99–105.
[9] M. Revel, A. Bissery, M. Bienvenu, L. Aycard, C. Lefort, G. Frija, Are two-dimensional CT measurements of small noncalcified pulmonary nodules reliable?, Radiology 231 (2) (2004) 453–458.
[10] L. B. Lusted, Logical analysis in roentgen diagnosis, Radiology 74 (1960) 178–193.
[11] W. J. Tuddenham, Visual search, image organization, and reader error in roentgen diagnosis. Studies of the psycho-physiology of roentgen image perception, Radiology 78 (1962) 694–704.
[12] H. L. Kundel, G. Revesz, Lesion conspicuity, structured noise, and film reader error, AJR. American journal of roentgenology 126 (6) (1976) 1233–1238.
[13] K. S. Berbaum, E. A. Franken, D. D. Dorfman, S. A. Rooholamini, M. H. Kathol, T. J. Barloon, F. M. Behlke, Y. Sato, C. H. Lu, G. Y. El-Khoury, Satisfaction of search in diagnostic radiology, Investigative Radiology 25 (2) (1990) 133–140.
[14] D. L. Renfrew, E. A. Franken, K. S. Berbaum, F. H. Weigelt, M. M. Abu-Yousef, Error in radiology: classification and lessons in 182 cases
presented at a problem case conference, Radiology 183 (1) (1992) 145– 150.
[15] N. Petrick, B. Sahiner, S. G. A. Iii, A. Bert, L. Correale, S. Delsanto, M. T. Freedman, D. Fryd, D. Gur, L. Hadjiiski, Z. Huo, Y. Jiang, L. Morra, V. Raykar, F. Samuelson, R. M. Summers, G. Tourassi, H. Yoshida, C. Zhou, H.-p. Chan, B. Zheng, Evaluation of computer-aided detection and diagnosis systems, Medical Physics 639 (2007) (2013) Article ID 087001, 17 pages. doi:10.1118/1.4816310.
[16] Z. Ma, J. M. R. S. Tavares, R. M. N. Jorge, A review on the current segmentation algorithms for medical images, in: 1st International Con-ference on Imaging Theory and Applications (IMAGAPP), INSTICC Press, February 5-8, Lisboa, Portugal, 2015, pp. 135–140.
[17] Z. Ma, J. M. R. S. Tavares, R. N. Jorge, T. Mascarenhas, A review of algorithms for medical image segmentation and their applications to the female pelvic cavity, Computer Methods in Biomechanics and Biomedical Engineering 13 (2) (2010) 235–246.
[18] P. Badura, E. Pietka, Soft computing approach to 3D lung nodule segmentation in CT, Computers in Biology and Medicine 53 (2014) 230–243.
[19] S. L. A. Lee, A. Z. Kouzani, E. J. Hu, Automated detection of lung nodules in computed tomography images: a review, Machine Vision and Applications 23 (1) (2012) 151–163.
[20] K. Suzuki, A review of computer-aided diagnosis in thoracic and colonic imaging, Quantitative imaging in medicine and surgery 2 (3) (2012) 163–176.
[21] L. H. Eadie, P. Taylor, A. P. Gibson, A systematic review of computer-assisted diagnosis in diagnostic cancer imaging, European Journal of Radiology 81 (1) (2012) 70–76.
[22] A. El-Baz, A. Elnakib, M. Abou El-Ghar, G. Gimel’farb, R. Falk, A. Farag, Automatic Detection of 2D and 3D Lung Nodules in Chest Spiral CT Scans, International Journal of Biomedical Imaging 2013 (2013) Article ID 517632, 11 pages. doi:10.1155/2013/517632.
[23] M. Firmino, A. H. Morais, R. M. Mendo¸ca, M. R. Dantas, H. R. Hekis, R. Valentim, Computer-aided detection system for lung cancer in com-puted tomography scans: review and future prospects, Biomedical en-gineering online 13 (2014) Article ID 41, 16 pages. doi:10.1186/1475-925X-13-41.
[24] W.-J. Choi, T.-S. Choi, Automated pulmonary nodule detection based on three-dimensional shape-based feature descriptor, Computer Meth-ods and Programs in Biomedicine 113 (1) (2014) 37–54.
[25] Q. Wang, W. Kang, C. Wu, B. Wang, Computer-aided detection of lung nodules by SVM based on 3D matrix patterns, Clinical Imaging 37 (1) (2013) 62–69.
[26] D. Cascio, R. Magro, F. Fauci, M. Iacomi, G. Raso, Automatic detec-tion of lung nodules in CT datasets based on stable 3D mass-spring models, Computers in Biology and Medicine 42 (11) (2012) 1098–1109. [27] B. Chen, T. Kitasaka, H. Honma, H. Takabatake, M. Mori, H. Na-tori, K. Mori, Automatic segmentation of pulmonary blood vessels and nodules based on local intensity structure analysis and surface prop-agation in 3D chest CT images, International Journal of Computer Assisted Radiology and Surgery 7 (3) (2012) 465–482.
[28] S. Soltaninejad, M. Keshani, F. Tajeripour, Lung nodule detection by KNN classifier and active contour modelling and 3D visualization, in: The 16th CSI International Symposium on Artificial Intelligence and Signal Processing (AISP 2012), IEEE, May 2-3, Shiraz, Fars, Iran, 2012, pp. 440–445.
[29] W. Suiyuan, W. Junfeng, Pulmonary Nodules 3D Detection on Serial CT Scans, in: Third Global Congress on Intelligent Systems, IEEE, November 6-8, Wuhan, China, 2012, pp. 257–260.
[30] A. Riccardi, T. S. Petkov, G. Ferri, M. Masotti, R. Campanini, Computer-aided detection of lung nodules via 3D fast radial trans-form, scale space representation, and Zernike MIP classification, Med-ical Physics 38 (4) (2011) 1962–1971.
[31] Y. Liu, J. Yang, D. Zhao, J. Liu, A Study of Pulmonary Nodule De-tection in Three-Dimensional Thoracic CT Scans, in: Second Inter-national Conference on Computer Modeling and Simulation, Vol. 1, IEEE, January 22-24, Sanya, China, 2010, pp. 481–484.
[32] S. Taghavi Namin, H. Abrishami Moghaddam, R. Jafari, M. Esmaeil-Zadeh, M. Gity, Automated detection and classification of pulmonary nodules in 3D thoracic CT images, in: IEEE International Conference on Systems, Man and Cybernetics, IEEE, October 10-13, Istanbul, Turkey, 2010, pp. 3774–3779.
[33] Q. Wang, K. Wang, Y. Guo, X. Wang, Automatic Detection of Pul-monary Nodules in Multi-slice CT Based on 3D Neural Networks with Adaptive Initial Weights, in: International Conference on Intelligent Computation Technology and Automation, Vol. 1, IEEE, May 11-12, Changsha, China, 2010, pp. 833–836.
[34] J. Yang, Y. Liu, W. Li, D. Zhao, A Three-Dimensional Method for Detection of Pulmonary Nodule, in: 2nd International Conference on Biomedical Engineering and Informatics, IEEE, October 17-19, Tian-jin, China, 2009, pp. 1–4.
[35] S. Matsumoto, Y. Ohno, H. Yamagata, D. Takenaka, K. Sugimura, Computer-aided detection of lung nodules on multidetector row com-puted tomography using three-dimensional analysis of nodule candi-dates and their surroundings, Radiation Medicine 26 (9) (2008) 562– 569.
[36] J. Wang, R. Engelmann, Q. Li, Computer-aided diagnosis: a 3D seg-mentation method for lung nodules in CT images by use of a spiral-scanning technique, in: Medical Imaging 2008: Computer-Aided Diag-nosis, International Society for Optics and Photonics, February 19-21, San Diego, California, USA, 2008, pp. 69151H–69151H–8.
[37] S. Ozekes, O. Osman, Computerized Lung Nodule Detection Using 3D Feature Extraction and Learning Based Algorithms, Journal of Medical Systems 34 (2) (2008) 185–194.
[38] S. Ozekes, O. Osman, O. N. Ucan, Nodule detection in a lung region that’s segmented with using genetic cellular neural networks and 3D