371 Marcílio Sousa da Rocha Freitas
Professor-Titular
Universidade Federal de Ouro Preto - UFOP Escola de Minas
Departamento de Engenharia Civil Ouro Preto – Minas Gerais - Brasil [email protected]
André Luis Riqueira Brandão
http://orcid.org/0000-0002-4857-4308 Professor-Adjunto
Universidade Federal de Itajubá – UNIFEI Unidade Acadêmica Engenharia Itabira - Minas Gerais - Brasil [email protected]
Antônio Roque Alves
Professor
Faculdade Santa Rita – FASAR Departamento de Engenharia Civil Conselheiro Lafaiete - Minas Gerais - Brasil [email protected]
Reliability analysis of welded
and bolted connections in
cold-formed steel sections
Abstract
This article shows a study of the level of reliability of welded and bolted con-nections in cold formed steel members, for some limiting states, adopted by AISI and Brazilian codes. The aim of this study is the assessment of the reliability index β for a variation of the nominal live-to-dead load ratios as well as comparison of the value found considering different load combinations. The first order reliability method is used to calculate the reliability index β. In this study, reliability indices smaller than 3.5 were obtained, especially for bolted connections. Consideration of the model errors and FORM method, lead to significant reductions in reliability indices, which are found to be less than the recommended target reliability levels.
Keywords: cold-formed steel, reliability index, calibration, structural reliability.
http://dx.doi.org/10.1590/0370-44672016710087
Civil Engineering
Engenharia Civil
1. Introduction
Welding and bolted fastening are the two most common types of connections in steel construction. These connections may be designed in accordance with the Limit State Design (LSD). In this method, separate load and resistance factors are applied to specified loads and nominal resistances to ensure that the probabil-ity of reaching a limit state is acceptably small. The same concept is also known as Load and Resistance Factor Design (LRFD) in the United States. The AISI Standard (2007) provides an integrated treatment of LRFD and LSD. The AISI LRFD strength prediction approach uses the following values for nominal live-to-dead load ratio (Ln/Dn), the load
com-bination and the target reliability index (βo): Ln/Dn = 5, 1.2Dn+1.6Ln, βo = 3.5. For AISI LSD, the parameters used are:
Ln/Dn = 3, 1.25Dn+1.5Ln,βo = 4.0. While the LRFD method is used in the United States and Mexico, Canada adopts the LSD method. It is to be noted that while the de-sign philosophy used for LRFD and LSD is the same, the two methods differ in the load factors, load combinations, assumed live-to-dead load ratios and the reliability indices. The First-Order Second-Moment (FOSM) reliability analysis model was used for calibration of resistance factors used in the AISI Specification for cold-formed steel members.
This study shows a study of the level of reliability of cold-formed steel (CFS) welded and bolted connections, designed according to the Brazilian Stan-dard (NBR 14762, 2010). The aim of this study is the assessment of the reliability index β for two different load
combina-tions: (i) 1.2Dn+1.6Ln (AISI, 2007) and (ii) 1.25Dn+1.5Ln (AISI, 2007; NBR 14762,
2010), and two nominal live-to-dead load ratios (Ln/Dn) of 5 and 3 (AISI,
2007). Statistical data used for this study were obtained from the measured mechanical and sectional properties and from test-to-prediction ratios of the available experimental results. The results were compared with the target reliability index (βo) of 3.5, the same levels used in AISI LRFD. Then, reli-ability indices were obtained for Ln/Dn
ratio ranging 1 from 10, and compared with the results by FOSM method obtained from Brandão (2012). The First-Order Second-Moment (FOSM) and First-Order Reliability Methods (FORM) were used to assess the reli-ability indices.
2. Probabilistic methods
reli-ability level, is done by the limit state concept. Reliability is the probability of a structure properly performing the
functions for which it was designed over a given time. The structural reliability is normally evaluated using two measures
(Ditlevsen and Madsen, 1996), related by equation:
( )
f
P
=
where β is the reliability index, Pf is the
failure probability, and Φ represents the cumulative distribution of a standard normal variable.
In general, the failure probability can be determined using: accurate ana-lytical integration, numerical integration
methods, approximate analytical methods (like FORM and FOSM methods) and simulation methods.
Hasofer and Lind (1974) introduced the idea of the First-Order Reliability Method (FORM) in the early 70s in struc-tural engineering. In its original form,
the Hasofer-Lind method is applicable to problems with uncorrelated normal random variables. The corresponding re-liability index is defined as the minimum distance from the origin of the reduced coordinate system to the performance function, and can be expressed as:
( ) ( )
x
'*
Tx
'*
HL=
where (x'*) is the point of the
perfor-mance function closest to the origin in reduced coordinates, named design
point. In this definition, the original coordinate system X=(x1, x2, ..., xn) is
transformed into a reduced coordinate
system X'=(x'1, x'2, ..., x'n) according to
Equation 3. i i X X i i
X
X
'
=
μ
For nonlinear performance func-tions, the minimum distance calculation is an optimization problem, defined by
βHL minimization, with the constraint condition g(x) = g(x') = 0 . It is possible to
consider the correlation between random variables in the value of the reliability in-dex. The FORM Method of Hasofer and
Lind was further developed by Rackwitz and Fiessler (1976). Thus, for random variables with non-normal distributions, the Rackwitz-Fiessler method was used to transform the variable distribution into an equivalent normal distribution.
In the First-Order Second Moment (FOSM method), the information of the
random variable distribution is ignored (Hsiao, 1989). The performance function is linearized by the first-order approxi-mation of a Taylor series development, evaluated at the mean values of the ran-dom variables, using the statistical mo-ments up to the second order (mean and variance values).
(1)
(2)
(3)
3. Performance function and statistical data
The performance function can be represented as follows:
g
(.) =
R
nMFP
- (
D
+
L
)
(4)Rn in this equation is the nominal
resistance based on the model used to best predict the resistance, and on the nominal material properties and nominal geometric properties. M, F, P, D and L are
random variables.
M and F (M defining "material" and F "fabrication") denote ratios of actual to
nominal material properties and cross-sectional properties. The values for the mean and variation coefficient (V) were
adopted in this study and were taken from Table F1 - Statistical Data for the
Determination of Resistance Factor in AISI Specification (AISI, 2007).
The factor P is the ratio of test
capacities, representing actual in-situ performance, to the prediction according to the model used. The modeling of the capacity is thus defined by P (P standing
for "professional"). The tested failure loads for welded connections were ob-tained from McGuire and Peköz (1979), Teh and Hancock (2005) and Zhao et al. (1999), while the tested failure loads for bolted connections were obtained from
Maiola (2004) and Sheerah (2009). The predicted values were computed accord-ing to the design formulas obtained from Brazilian Standard (NBR 14762, 2010), which are identical to the AISI (2007), for the analyzed cases. The Kolmogorov-Smirnov adherence test was used to assess the statistical adjustment of the PDFs to the data series of P. D is dead load, and L
is live load. The statistics for these random variables in Eq. (4) are summarized in Table 1 (Ellingwood and Galambos, 1982; Ellingwood et al. 1980).
Load Type Mean/Nominal Coefficient of Variation probability density function (pdf)
Dead Load (D) Dm/Dn = 1.05 VD=0.10 Normal
Live Load (L) Lm/Ln = 1.00 VL=0.25 Gumbel Table 1Dead and live Load statistics.
4. Reliability analysis
pre-373
viously mentioned. The predicted values were computed according to the design formulas in AISI Standard and Brazilian Standard. The number of specimens (n),
mean values (Pm), and the coefficients of
variation (VP), and probability density
functions (pdf) are listed in Table 2. The resistance factors, φ for AISI Standard and
γ for Brazilian Standard, are also included in this table. The relationship between φ
and γ in these cases is defined as follows:
φ=1/γ.
4.1 Welded Connections
For welded connections, the reliabil-ity indices (β) computed for longitudinal and transverse loading are listed in Table 3. Herein, β was calculated for two dif-ferent load combinations: (i) 1.2Dn+1.6Ln
(AISI, 2007) and (ii) 1.25Dn+1.5Ln (AISI,
2007; NBR 14762, 2010), and two live-to-dead load ratios (Ln/Dn) of 5 and 3 (AISI,
2007). The FORM was used to assess the reliability indices. It can be seen that for all cases, the Reliability Indices βFORM values are lower than the target of 3.5.
By using different γ factors for
dif-ferent cases, the values of β vary from 2.99 to 3.47 and the target βo is 3.5. For Longitudinal Flare-Bevel Welds, by using the load combination (i) and Ln/Dn=5, the
value of β was found to be 3.4, which is close to the target of 3.5.
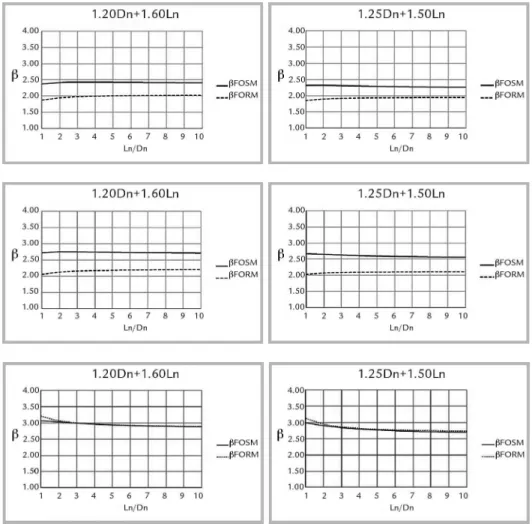
Figures 1 to 5 show the reliability indices, which were obtained for Ln/Dn
ratio ranging 1 to 10, and compared with the results from the FOSM method. The FOSM and FORM Methods were used to assess the reliability indices.
It is noted that the values obtained
from the FOSM Method are higher than the values obtained from the FORM Method. By using the FOSM Method, values similar to Brandão (2012) were obtained. In general, the curves obtained for each of the cases are similar but with a gap between them.
By the calibration of the welded connections cases, with the target re-liability index of 3.5, the load ratio
Ln/Dn of 5 and the load combination
(ii), resistance factors varying from 1.9 to 2.2 were obtained.
Case Failure modes References n Pm VP pdf γ φ
Welded Connections
1 Longitudinal Fillet Welds (L/t<25) Hancock (2005) and Zhao et al. (1999)McGuire and Peköz (1979), Teh and 51 0.93 0.11 Normal 1.65 0.60
2 Longitudinal Fillet Welds (L/t≥25) McGuire and Peköz (1979), Teh and Hancock (2005) 29 0.80 0.11 Normal 2.00 0.50
3 Transverse Fillet Welds McGuire and Peköz (1979), Teh and Hancock (2005) 79 0.98 0.11 Normal 1.55 0.65
4 Transverse Flare-Bevel Welds McGuire and Peköz (1979), Teh and Hancock (2005) 56 1.00 0.15 Normal 1.65 0.60
5 Longitudinal Flare-Bevel Welds McGuire and Peköz (1979), Teh and Hancock (2005) 30 0.90 0.13 Gumbel 1.80 0.55
Bolted Connections
6 Bearing (sheets) Maiola (2004) 184 0.91 0.27 Lognormal 1.55 0.65
7 Bearing (angle and cannel sections) Maiola (2004) 39 1.03 0.28 Lognormal 1.55 0.65
8 Spacing and edge distance Sheerah (2009) 53 0.98 0.19 Gumbel 1.45 0.70
Table 2
Failure modes, statistical data and resistance factor.
Case (i) 1.2Dn + 1.6Ln (ii) 1.25Dn + 1.5Ln
Ln/Dn = 3 Ln/Dn = 5 Ln/Dn = 3 Ln/Dn = 5 Reliability Indices βFORM
1 3.18 3.13 3.05 2.98
2 3.32 3.27 3.19 3.12
3 3.12 3.07 2.99 2.92
4 3.27 3.23 3.15 3.09
5 3.47 3.40 3.33 3.24
Table 3 Computed Reliability Index β for Welded Connections.
Figure 2
Reliability Index β vs. Ln/Dn ratio for Longitudinal Fillet Welds (L/t ≥ 25).
Figure 3
Reliability Index β vs. Ln/Dn ratio for Transverse Fillet Welds.
Figure 4
Reliability Index β vs. Ln/Dn
ratio for Transverse Flare-Bevel Welds.
Figure 5
Reliability Index β vs. Ln/Dn
ratio for Longitudinal Flare-Bevel Welds.
It is important to point out that only the data from McGuire and Peköz (1979) were used in the calibration of the applica-ble welded connection equations currently in AISI (2007). Detailed information can be found in Hsiao (1989), who used the
FOSM Method. In that Reference, the load combination (i) and Ln/Dn ratio of
5 were adopted. In general, the values obtained by using load combination (i) and Ln/Dn ratio of 5 were satisfactory to
the target of 3.5.
Another important aspect is the influence of professional coefficient (P)
on the results. A sensitivity analysis shows that the random variable P, features an
importance factor between 0.30 and 0.50, for the case analyzed.
4.2 Bolted connections
Table 4 shows results of the reli-ability indices β for bolted connections. Calculated was β for two different load
combinations: (i) 1.2Dn+1.6Ln (AISI, 2007)
and (ii) 1.25Dn+1.5Ln (AISI, 2007; NBR
14762, 2010), and two live-to-dead load
ratios (Ln/Dn) of 5 and 3 (AISI, 2007). The
FORM was used to assess the reliability indices.
Table 4
Computed Reliability
Index β for Bolted Connections.
Case
(i) 1.2Dn + 1.6Ln (ii) 1.25Dn + 1.5Ln Ln/Dn = 3 Ln/Dn = 5 Ln/Dn = 3 Ln/Dn = 5
Reliability Indices βFORM
6 1.99 2.01 1.93 1.99
7 2.15 2.18 2.09 2.11
375
Figures 6 to 8 show the reliability indices, which were obtained for Ln/Dn
ratio ranging 1 to 10, and compared with the results by the FOSM method. The FOSM and FORM Methods were used to assess the reliability indices. It can be seen that the FOSM Method produces results inferior to the FORM Method, although
the FORM method is more accurate. By using the FOSM Method, values similar to Brandão (2012) were obtained. As seen in the reliability analysis for welded connections, the curves obtained for each of the cases are similar but with a gap between them.
By proceeding to the calibration of
the cases of bolted connections, with the target reliability index of 3.5, the load ratio Ln/Dn of 5 and the load
combina-tion (ii), the resistance factors 2.47, 2.24 and 1.82 are obtained for cases 6, 7 and 8, respectively. The high values of cases 6 and 7 are justified by the high dispersion of the variable P, shown in Table 2.
Figure 6 Reliability Index
β vs. Ln/Dn ratio for Bearing (sheets).
Figure 7 Reliability Index β vs. Ln/Dn ratio for angle and channel sections.
Figure 8 Reliability Index β vs. Ln/Dn ratio for Spacing and edge distance.
5. Conclusions
The AISI LRFD strength predic-tion approach uses the following values for nominal live-to-dead load ratio (Ln/Dn), the load combination and the
tar-get reliability index: Ln/Dn = 5, 1.2Dn+1.6Ln,
βo = 3.5. By calibration, resistance factors were determined for the load combination
1.2Dn+1.6Ln to approximately provide a
target βo equal to 3.5 for connections. The reliability analysis of welded and bolted connections for thin sheets and cold-formed steel members designed by AISI and Brazilian codes are described
herein. The FORM and FOSM Methods were used to calculate the reliability index
β. In this study, obtained were reliability indices smaller than 3.5, especially for bolted connections. Consideration of model errors and the FORM method lead to significant reductions in reliability in-dices, which are found to be less than the recommended targeted reliability levels.
Through calibration of the stan-dard for welded and bolted connections in cold formed steel members, using the usual load combination of the Brazilian
code, the possibility of adjusting the resistance factors to a value close to 2 was verified.
It is suggested that the Brazilian code should to be adjusted in the near future. In this context, it is appropri-ate to show the importance of the test database to obtain the statistics of professional coefficient (P). Given
the excessively low reliability indices, special attention should be taken to theoretical models of stress tolerance in bolted connections.
Acknowledgements
References
ASSOCIAÇÃO BRASILEIRA DE NORMAS TÉCNICAS. ABNT NBR 14762:2010 Dimensionamento de estruturas de aço constituídas por perfis formados a frio. Rio de Janeiro, Brasil, 2010.
AISI-S100 North American Specification for the Design of Cold-formed Steel Struc-tural Members. American Iron and Steel Institute, Washington, D.C., ANSI/AISI--S100-07, 2007. 183p.
BRANDÃO, A. L. R. Calibração do coeficiente de ponderação da resistência em
barras e ligações de perfis formados a frio. Ouro Preto: Universidade Federal
de Ouro Preto, 2012. (Thesis).
DITLEVSEN, O., MADSEN, H.O. Structural reliability methods. New York:
Wiley, 1996.
ELLINGWOOD, B., GALAMBOS, T. V., MACGREGOR, J. G., CORNELL, C. A. Development of a probability based load criterion for American National Standard A58: building code requirements for minimum design loads in buildings and other structures. NBS Special Publication 577, 1980.
ELLINGWOOD, B., GALAMBOS, T. V. Probability based load criteria. Structural
Safety , n.1,p. 15-26, 1982.
HASOFER, A. M., LIND, N. C. An exact and invariant first-order reliability format.
Journal of Engineering Mechanics Division, v.100, n.1, p.111-121, 1974.
HSIAO, L.E. Reliability based criteria for cold-formed steel members.
Missouri--Rolla: University of Missouri-Rolla,, Missouri, 1989. (Ph.D. Thesis).
LOW, B. K., TANG, W. H. Efficient reliability evaluation using spreadsheet. Journal
of Engineering Mechanics, v.123, n.7, p.749-752, 1997.
MCGUIRE, W., PEKÖZ, T., Welding of Sheet Steel, Report SG-79-2, American Iron
and Steel Institute, 1979.
RACKWITZ, R., FIESSLER, B. Structural reliability under combined random load sequences. Computers and structures, v.9, n.5, p.489-494, 1976.
SHEERAH, I. Cold-formed steel bolted connections without washers on oversized
and slotted holes. 2009. 104p. (Master of Science Engineering Systems).
TEH, L. H., HANCOCK, G. J. Strength of fillet welded connections in G450 Sheet Steels. Research Report, No R802. Australia: Dept. of Civil Engineering, Univ. of
Sydney, 2005.
ZHAO, X. L., AL-MAHAIDI, R., K.P. KIEW. Longitudinal fillet welds in thin-wal-led C450 RHS Members. Journal of Structural Engineering, ASCE, v.125, n.8,
p.821-828, 1999.