WORKING PAPER SERIES
CEEAplA WP No. 15/2010
The Shadow Value of Employer-Provided
Training
Santiago Budría Pablo Swedberg
The Shadow Value of Employer-Provided Training
Santiago Budría
Universidade da Madeira (DGE e CEEAplA)
Pablo Swedberg
Department of Business and Social Sciences, St. Louis University
Working Paper n.º 15/2010
Dezembro de 2010
CEEAplA Working Paper n.º 15/10 Dezembro de 2010
RESUMO/ABSTRACT
The Shadow Value of Employer-Provided Training
This paper adopts an equivalent income approach to calculate the economic value of training activities for workers. Using econometric regression analysis of individual self-reported job satisfaction (JS) and data from the European Community Household Panel dataset (ECHP), the paper shows that employer-provided training exerts a positive and significant effect on JS. On average, this effect is equivalent to a 17.7% increase in labour earnings. Boes and Winkelmann’s (2009) Generalized Ordered Probit for panel data is used to show that the determinants of JS as well as the equivalent income of training differ across the JS distribution.
Keywords: Job satisfaction, employer-provided training, generalized ordered
probit model, equivalent income.
APAs Codes: 3620, 3650 JEL Codes: C23, C25, J28
Santiago Budría
Departamento de Gestão e Economia Universidade da Madeira
Edifício da Penteada Caminho da Penteada 9000 - 390 Funchal Pablo Swedberg
Department of Business and Social Sciences St. Louis University
Madrid Campus Avenida del Valle, 34 28003 Madrid
The Shadow Value of Employer-Provided
Training
Santiago Budría* – University of Madeira and CEEAplA
Pablo Swedberg - Department of Business and Social Sciences, St. Louis University
December 2010
Abstract
This paper adopts an equivalent income approach to calculate the economic value of training activities for workers. Using econometric regression analysis of individual self-reported job satisfaction (JS) and data from the European Community Household Panel dataset (ECHP), the paper shows that employer-provided training exerts a positive and significant effect on JS. On average, this effect is equivalent to a 17.7% increase in labour earnings. Boes and Winkelmann’s (2009) Generalized Ordered Probit for panel data is used to show that the determinants of JS as well as the equivalent income of training differ across the JS distribution.
Keywords: Job satisfaction, employer-provided training, generalized ordered probit model, equivalent income.
APAs Codes: 3620, 3650 JEL Codes: C23, C25, J28
* The financial support from the Spanish Ministry of Education through grant SEJ2006-11067 and the Junta de
Andalucía through grant P07-SEJ-03261 is gratefully acknowledged. Corresponding author: Santiago Budría, Department of Economics, University of Madeira, Rua Penteada 9000-390, Funchal (Portugal). Phone: +351-291 705 055. Fax: +351-291 705 040. E-mail: [email protected].
1. Introduction
Understanding the determinants of workers’ job satisfaction has become of core interest to human resource managers and governments concerned with designing optimal organizational policies. Job satisfaction is positively related to a number of labour market outcomes, including wage growth (Clark, 1999), productivity and establishment performance (Judge et al., 2001), absenteeism (Wegge et al., 2007) and quits (Clark, 2001, Frijters et al., 2007, Sousa-Poza and Sousa-Poza, 2007). From a general perspective, moreover, job satisfaction emerges as one of the most important domains of overall life satisfaction and happiness (Kahneman and Krueger, 2006). Indeed, recent research has shown that employees with higher job satisfaction tend to be healthier (Fischer and Sousa-Poza, 2009).
This paper investigates the contribution of employer-provided training to job satisfaction (JS). Training is an important mechanism for developing and retaining a productive workforce in that it gives workers new opportunities to develop skills and competencies, fulfil career development goals, achieve professional success and strengthen emotional attachment to the firm. To date, however, we still have a poor idea of how and to what extent training activities are appreciated by workers, how workers process these events, and how they transform these opportunities into well-being in the workplace. The number of studies in the field is very limited. The existing research has been conducted at the firm level and within specific occupations, which comes at the cost of representativity. Georgellis and Lange (2007) is a notable exception as they make use of a large-scale dataset to provide a broader view on the subject. Using three waves (1989, 1993, 2000) of the German Socio-economic Panel, they report a positive relationship between firm-sponsored training and JS. However, they do not make full use of the dataset’s panel structure and present results that are based on pooled regressions. More recently, Jones et al. (2009) have used cross-sectional data drawn from the Workplace Employment Relations Survey (WERS) to examine how employer-provided training contributes to a number of job-related outcomes and specific domains of JS. Their results uncover a positive relationship between training and most of the selected indicators. However, using the same dataset but controlling for workplace heterogeneity Haile (2009) finds a much looser relationship.
The first contribution of this paper is to assess the impact of training activities on JS by means of panel estimation. There are various sources of bias associated with cross-sectional micro data. First, neglecting unobserved heterogeneity may result in biased estimates, insofar as personality traits such as extraversion, neuroticism, optimism and self-esteem have been found to be correlated with self-reported measures of satisfaction (Diener and Lucas, 1999, Judge et al., 2002). Second, a common concern arising with this type of estimation is that the correlation between two specific variables (e.g., training and JS) does not necessarily reflect causality. That would be the case if, for example, more satisfied workers are more likely to engage in training activities in the job. In that case, the estimated coefficient would not reflect benefits from being trained, but merely a reverse-causality problem. To deal with these issues, this paper uses panel estimation with individual time-invariant effects. This allows us to establish causal relationships by following people over time and investigating how the JS of the same people changes when they take part in training schemes. Moreover, panel estimation is intended to control for individual effects, thereby addressing the unobserved heterogeneity issue. We use the 1994-2001 Spanish waves of the European Community Household Panel dataset (ECHP); a survey of representative households and individuals containing a host of personal and labour market characteristics. Although the ECHP is not the most up-to-date dataset available in the profession, nor has the most extensive information on training activities at the firm level, the survey’s eight-wave panel structure makes it appealing for our research purposes.
As a second contribution, the paper provides pioneering estimates of the subjective value that workers attribute to training activities. Well-being equations can be used to empirically obtain indifference curves in terms of the various dimensions that are relevant to evaluating well-being. By establishing trade-offs between selected variables, these curves can go a long way towards assessing the economic value and cost of a variety of items that are relevant for economic policy (Ferrer-i-Carbonell and van Praag, 2002, van de Berg and Ferrer-i-Carbonell, 2007, Verhaest and Omey, 2009). Using responses to JS, this paper calculates the trade-off ratio between training and labour income. This ratio is an appraisal of the income variation that is needed to affect JS to the same extent as participation in training does. This exercise must be put into perspective by noting that
previous studies on training typically focus on objective labour market measures including productivity, wages and promotions, among others. Although crucial for evaluating the effectiveness of training programmes, these variables may not be the only or even the most important ones. Objective measures may be obscured if workers with different occupations and employers have different opportunities to reap the benefits of the productivity gains associated with training. Moreover, objective indicators may be poorly correlated with well-being in the job which, arguably, is one of individuals’ major concerns and one of the most relevant aspects in one’s life. As regards objective indicators, self-reported satisfaction may be a more relevant measure for workers and a better indicator of the true benefits that they reap from training activities. This paper therefore proposes an alternative approach for estimating the economic value of private sector training.
Finally, the number of papers investigating the causes and correlates of job-specific and overall life satisfaction has grown in recent years1. It is common in the literature to assume that if a labour-related or personal condition leads to satisfaction, such conditions would necessarily lead to dissatisfaction when absent and vice versa. However, there are reasons to believe that more complex effects might be at work. First, we know from the psychology literature that subjective measures of satisfaction are a construct of various pleasant and unpleasant emotions, with the specific mechanisms that give rise to each being largely independent (Schmukle et al., 2002, Larsen and Prizmic, 2008). Second, Boes and Winkelmann (2009) have recently found that the relationship between well-being and family income is not symmetric, with income being a more important source of negative well-being (when low) than of positive well-being (when high). Finally, and turning to the scope of the present paper, Herzberg (1966, 1987) describes in his two-factor model that certain characteristics tend to be consistently related to job satisfaction (motivators) and others to job dissatisfaction (hygiene factors). Factors having the potential to lead to job dissatisfaction tend to provide the basic conditions needed for satisfaction in normal work environments. If not adequately provided, they contribute to dissatisfaction with work life. These factors act as dissatisfiers because they determine whether the worker is dissatisfied
1 In the task, some authors have put the focus on age (Clark et al., 1996), gender (Clark, 1997), personal and relative
income (Clark and Oswald, 1996, Ferrer-i-Carbonell, 2005), self-employment (Benz and Frey, 2004), overeducation (Verhaest and Omey, 2009), performance-related pay (Green and Heywood, 2008) and part-time work (Booth and van Ours, 2009).
or not. In turn, factors having the potential to lead to job satisfaction are motivators because when such factors are present, individuals tend to feel satisfied with their work. When absent, they do not feel satisfied, but not necessarily dissatisfied either. These factors act as
satisfiers because they determine whether the worker is satisfied or not.
This paper explicitly differentiates between satisfiers and dissatisfiers in the job by exploiting Boes and Winkelmann’s (2009) Generalized Ordered Probit (GOP, henceforth) for panel data. The main advantage of this approach is that it discriminates the impact that a given covariate has on the dependent variable (JS) in different segments of the outcome distribution. In standard ordered response models, the trade-off between two specific covariates is assumed to be constant across outcomes, thus assuming that those factors that put a worker in the upper range of the satisfaction distribution are the same as those that put a worker in the lower range of the distribution. Most papers in the field are based on this assumption and consequently describe the relationship between reported well-being and the variable of interest only in an ‘average’ sense. However, there may be asymmetric effects on measured JS if for example income increases do not lead to higher satisfaction but income losses result in dissatisfaction. Similarly, workers may interpret the lack of training opportunities as a signal of non-compliance by the firm. This signal may be more intense among workers who are already dissatisfied with their job than among workers whose job and attachment to the firm is challenging and intrinsically rewarding. In this case, training would act as a dissatisfier rather than a satisfier, with a similar line of reasoning applying to other dimensions. This paper examines the extent of these asymmetries by conducting a separate investigation of the determinants of low and high JS.
The paper is structured as follows. Section 2 describes the dataset and provides summary statistics of relevant demographic and labour market variables. Section 3 presents the GOP model, outlines its main features, and introduces the equivalent income concept used throughout the paper. Section 4 presents the results and documents existing asymmetries in the determinants of JS. The estimates are used to infer the shadow value of different types of training. Section 5 discusses the results and the robustness of the estimates. Section 6 contains the concluding remarks and several policy implications arising from the analysis.
2. Data and definition of variables
The data is extracted from the 1994-2001 waves of the Spanish sample of the European Community Household Panel. The dataset and the variables are described in Appendix A. We wish to avoid conflating work-related or ‘continuing training’ with initial vocational education or training. To do so, we exclude individuals under 23 years of age, paid apprentices, and those on special employment-related training schemes from our analysis. Our estimating sample consists of private sector men who are between 23 and 60 years old, working normally between 15 and 70 hours a week, and not employed in the agricultural sector. Self-employed individuals, as well as those whose main activity status is paid apprenticeship, training, and unpaid family workers have been excluded from the sample. The case of women is disregarded on account of the extra complication of potential selectivity bias. After dropping observations with missing values, these exclusion restrictions leave us with a total of 17,632 observations.
2.1 Definition of training
The central question in the ECHP concerning training is
• (Q1) ‘Have you been in education or training since January last year?’
Whether such participation effectively occurred in a general/higher education setting or a vocational/training course is answered in another question. Since our focus is on training, we disregard activities regarded as ‘general/higher education’2. The second training question is
• (Q2) ‘Was the vocational education course paid or organized by the employer?’
Given its implications for managerial and human resource policies, we use the information reported in Q2 to differentiate between i) employer-provided training (EP) and ii) training not provided by the employer (NEP). This is our Classification 1 of the training activities.
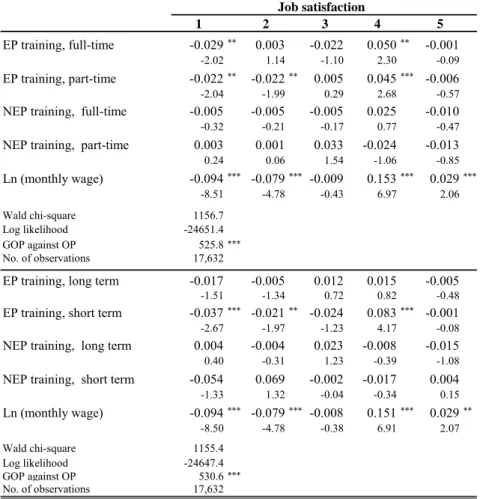
The ECHP does not contain information on the number of training events in which individuals took part. However, it does provide information on the number of weeks training lasted (less than 2 weeks, 2 to 9 weeks, and more than 9 weeks), and on whether training was attended on a part-time or a full-time basis. This information allows us, at least partially, to take into account the role of training intensity. To that end, we construct two alternative classifications. First, we combine the information provided in Q2 with the information on either part-time or full-time attendance to define four categories of training: i) EP attended on a time basis; ii) EP attended on a part-time basis; iii) NEP on a full-time basis; and iv) NEP on a part-full-time basis. This is our Classification 1A. Second, we split EP and NEP activities depending on whether they are short term (less than 9 weeks) or long term (more than 9 weeks). This gives rise to Classification 1B: i) long-term EP; ii) short-term EP; iii) long-term NEP; and iv) short-term NEP3.
Table 1 (Classification 1A) and Table 2 (Classification 1B) report summary statistics of the incidence of the different types of training. We find that 13.4% of the individuals in the sample engaged in some type of training. About seven out of ten of these activities were organized by the employer (9.2%). Most training activities were attended on a part-time basis (8.6% vs. 4.8% on a full-time basis). This pattern is independent of whether or not the training was provided by the employer. Table 2 shows that long-term training programmes (8.7%) were more prevalent than short-term ones (4.7%).
2.2 Job satisfaction
The empirical analysis is based on a subjective, self-reported measure of JS. The ECHP asks respondents to report their level of overall satisfaction in their main work or activity using a 6-point Likert scale. As only 3.0% of the sample reports the lowest satisfaction level, we regrouped responses 1 and 2 into a single category and used a modified 1-5 scale (with 1 being “not satisfied at all” and 5 being “fully satisfied”).
The ECHP contains a number of complementary questions inquiring about facet-specific
3 We do not pursue a single classification with 8 different training categories to avoid problems of small cell size in the
satisfactions in the job, including satisfaction with earnings, job security, type of work, number of working hours, working times, working conditions and distance to the workplace. For reasons of space, however, these domains are not considered in the present paper, which focuses exclusively on overall JS.
Self-reported data has been periodically criticized on the grounds that they are subject to contextual influences. Behind the self-reported information lies an affective and cognitive assessment that, admittedly, may depend on a number of distorting factors related to individual differences including cognitive ability, personality traits, circumstances, aspirations and comparisons with others. If these factors are important, subjective measures of satisfaction may contain some noise relative to the signal value (true utility), and the resulting estimations should be interpreted sceptically. However, much research in the field of psychology and economics has demonstrated that the influence of these factors is limited, and that self-reported data pass a number of validation tests. First, there is consistent evidence that subjective measures of satisfaction and well-being are related (and in the expected direction) to a number of objective indicators including physical health and longevity (Danner et al., 2001), suicide rates and macroeconomic fluctuations (Di Tella et al., 2003) and unemployment (Clark et al., 2008). Secondly, subjective measures of satisfaction show a reasonable amount of internal consistency and temporal reliability: they correlate well with one another and with alternative methods of measurement, including ratings made by family and friends, facial measures of emotion and a vast array of psychological and psychosocial indicators (Cacioppo et al., 2008). Thirdly, and turning to the crux of our investigation, were self-reported JS mere noise then it should be independent from other indicators that are directly related to internal satisfaction. Still, as mentioned above, self-reported JS is related in a meaningful way to productivity, establishment performance, absenteeism and job turnover.
2.3 Summary statistics
Table 3 uses the pooled sample to report summary statistics by levels of JS. For the sake of simplicity, we consider only Classification 1 of the training activities. The first column contains the variables that will later be included in the regressions. The first row shows
that most individuals are fairly satisfied with their jobs, with almost 50% of the sample reporting a satisfaction level above 3 and only 9.64% reporting the lowest satisfaction category.
--- Insert Table 3 about here ---
The first column of statistics refers to the total sample. In our data, 25.5% and 19.6% of the employees have, respectively, tertiary and upper secondary education, while 14.1% works in the public sector and 10.3% plays a supervisory role in the job. The average working load stands at 41.8 hours per week, and the sample average age is 40.0 years. Most individuals have less than five years of tenure (46.7%), although 39.9% has worked in the same firm for ten years or more. More than half of the sample has a permanent contract (60.4%). Singles and immigrants account for 27.8% and 1.4% of the sample, respectively. Some 16.3% of the employees report bad health, while a substantial fraction has experienced unemployment spells (36.3%). Almost 50% of the sample receives health care or medical insurance from the employer, while an additional 3.6% receives housing.
Differentiating between levels of JS permits important differences to emerge in terms of demographic and job characteristics. More satisfied workers are more prone to be older, report higher wages, have tertiary education, a supervisory role, more tenure, a permanent contract, work in the public sector and in a larger firm. On the other hand, they are less likely to be single, report bad health or have experienced unemployment spells. In most cases, differences in the summary statistics among workers with JS=1 and JS=5 are remarkably large. Interestingly, as we move towards higher levels of JS, the incidence of EP training tends to increase from 4.1% at the bottom of the satisfaction scale to 11.0% at the top. In turn, the proportion of workers with NEP training is roughly similar across JS levels. Although this evidence is based on raw statistics and unconditional relationships, it provides preliminary support for the hypothesis that EP training is positively associated with JS.
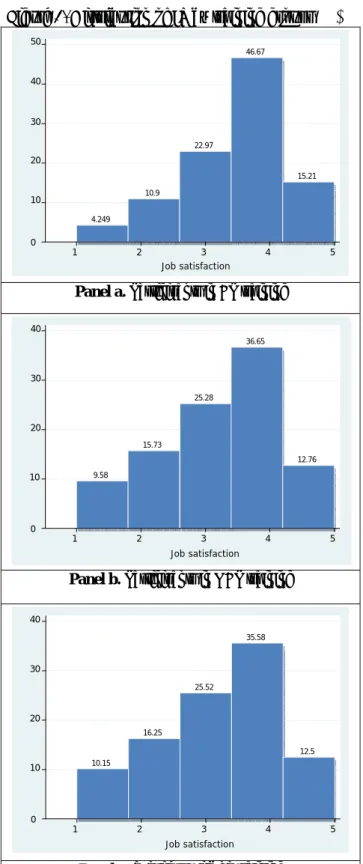
In order to provide a complementary view, in Figure 1 we depict the frequency distribution of JS differentiating between three groups of workers according to whether they have EP
ε β X JS* it it it = + (1) η u γ X β X JS i it M i it * it = + + + (2)
training, NEP training or no training at all. JS scores are more skewed to the left among workers with EP training. About 62% of the individuals in this group report either JS=4 or JS=5, while only 15% reports a satisfaction level below 3. In the other two groups, these figures are more similar, with some 48% in the two top categories and about 26% in the two lowest categories.
--- Insert Figure 1 about here ---
3. The model
Individual JS is assumed to be a function of a latent variable JS* that is not measured. This variable is continuous, has several threshold points that determine the observed value of JS, and is a function of observable characteristics
where i indicates the individual, t indicates the time and X is a vector with K-1 explanatory variables. We allow for individual correlation over time by splitting the error term into
it i
it ν η
ε = + , where νi is an individual time-invariant effect and ηit is an independent error
term. Our reference model is the ordered probit with individual random effects where
) 1 , 0 N( ) , 0 N( 2 ∼ ∼ σ , η
νi ν it , 0Cov (νi,ηit)= . In this setting, it is assumed that the error terms are not related to the explanatory variables, which may not be plausible given the potential correlation between individual unobservable characteristics (such as personality traits) and the right-hand side variables. To address this issue, we introduce a Mundlak (1978) correction term in which the individual random effect is modelled as a function of the mean values of selected time-varying regressors, νi =XiMγ+ui, where ui is a pure error term and XiM is a vector with the time-averaged values of a subset of M variables, M < K, included in X. Eq. (1) can be rewritten as
) u -γ X -β X -δ Φ( -) u -γ X -β X -δ Φ( ] u , X , X | j [JS Prob j-1 i M i 1 -j it 1 -j i j M i j it j i M i it it = = (3)
where the link between JS and JS* is given by * j 1
-j
it j if δ JS δ
JS = ≤ it ≤ for j=1,…, J, with J
being the number of possible outcomes and −∞=δ0 <δ1...<δJ =∞.
The Ordered Probit (OP, henceforth) is probably the most widely-used method for the economic analysis of job-satisfaction and overall well-being. Moreover, the OP yields estimates that are similar to other models based either on the cardinality or on the ordinalization of the dependent variable4. Given this representativity, and for purposes of comparison, the results of the OP model will be reported throughout the paper. We must note that, in this case, the relationship between JS* and the explanatory variables is assumed to be constant, thus yielding a unique vector of estimates β.
In turn, Boes and Winkelmann’s (2009) GOP model yields J different vectors of coefficients. This is done by allowing the ancillary parameters to depend on the model covariates, δj =δj+ Xit~ +βj XiMγ~j. In this case, the probability of outcome j is given by
where Φ is the cumulative normal distribution. The coefficients related to outcome j are j
j β β
β = − ~ and γj =γ−γ~j, where βand γ are the corresponding vectors in the OP model. The impact of a particular covariate k on the probability of outcome j (i.e., the marginal probability effect or MPE) is then
4 Van Praag and Ferrer-i-Carbonell (2008) compare different methods to evaluate subjective ordered responses, including
OP, Probit-adapted OLS (POLS), Cardinal Probit (CP) and Cardinal OLS (COLS). Using a parsimonious well-being equation, they report that “the trade-off ratios and t-ratios are almost the same in all four approaches OP; POLS; CP and COLS” and argue that the four methods are practically equivalent (pp. 36). Similarly, Ferrer-i-Carbonell and Frijters (2004) show estimation results for self-reported happiness that are qualitatively identical (in terms of direction, significance, and trade-offs among regressors) when assuming either cardinality or ordinality, although the fixed-effect ordered logit model exhibits particular features as compared to the other models.
) 4 ( )β u -γ X -β X -δ φ( -)β u -γ X -β X -δ φ( x j] Prob[JS ) (x MPE j-1 i j-1,k j it j Mi j i j,k M i 1 -j it 1 -j k it k j ∂ = = ∂ =
where φ is the normal density function, xk is the k-th element of vector X and β is the j,k k-th element of vector βj. The main feature of this approach is, therefore, that it does not
impose a constant ratio of MPEs across outcomes of the dependent variable. This refinement allows the relative importance of the different covariates to vary across the JS distribution5.
3.1 Right-hand side variables
We pose that JS is a function of personal and job characteristics. The first set of variables includes completed education, age (and squared), singlehood, immigrant status, health condition, unemployment experience and household size. The job variables include net monthly labour earnings, public sector, supervisory role in the job, working hours, tenure, type of contract and firm size. Additionally, we include controls for industry and occupation. To account for non-linear effects, age, household size, labour earnings and working hours are entered in their natural logarithm form. In order to account for other sources of compensation in the job, we additionally include two indicators of whether the individual receives housing and medical insurance from the employer. Finally, the set of job characteristics includes the core feature of our analysis: training. The benchmark specification, which is based on Classification 1, consists of two training dummies controlling for EP and NEP training, respectively.
Apart from the full set of controls, the estimating equation includes year fixed effects and the Mundlak correction term XMi . This term must contain representative information of the individual in order to account for the potential correlation between the individual random effect and the observable characteristics. Although the choice of these variables is somewhat discretionary, the literature has shown a preference for information related to income, family size and hours of work (Ferrer-i-Carbonell, 2005). We follow this view and
5 In the OP model, for example, Eq. (4) collapses to:
k i M i it j k i M i it 1 -j k j(x ) φ(δ -X β-X γ-u )β -φ(δ -X β-X γ-u)β MPE =
and, consequently, the relative impact of any two distinct covariates k and p is constant across outcomes
β β ) (x MPE ) (x
expand our estimating equation by adding the (individual) time averaged value of three variables: monthly labour earnings, household size and working hours.
3.2 The equivalent income concept
Well-being and satisfaction equations can be used to assess the importance of a given dimension relative to other dimensions, and to construct equivalence scales between relevant variables. We will centre our analysis on the impact that training has on JS, using labour income as a reference scale. Although other variables can be used, employing income as a reference measure provides a clear-cut interpretation. This equivalent income approach is very similar to the one used in Ferrer-i-Carbonell and van Praag (2002), van de Berg and Ferrer-i-Carbonell (2007) and Verhaest and Omey (2009) to estimate the shadow value/cost of informal medical care, chronic diseases and educational mismatches, respectively.
Consider the impact that training participation has on the probability of observing outcome
j. The equivalent income of training is defined as the percentage increase in earnings needed to change the probability of outcome j to the same extent,
where w is labour earnings, tr is training and ∆w is the equivalent income. For the sake of simplicity, the remaining variables are omitted from the notation. In terms of MPEs, the above condition implies that ceteris paribus, and for each outcome j, the equivalent income of training is given by the equation MPE (tr) ∆ln(w)j MPEj(ln(w))
j = ⋅ . Taking into account
that ∆ln(w)j =ln(1+∆wj), we obtain our equivalent income formula
4. Empirical results
Table 4 reports the first set of estimates. These are expressed in terms of Eq. (4): the
) 6 ( 1 -(ln(w)) MPE (tr) MPE exp ∆w j j j ⎟ ⎟ ⎠ ⎞ ⎜ ⎜ ⎝ ⎛ = ) 5 ( 0] tr ∆w)), ln(w(1 | j [JS Prob 1] tr ln(w), | j [JS Prob = = = = + =
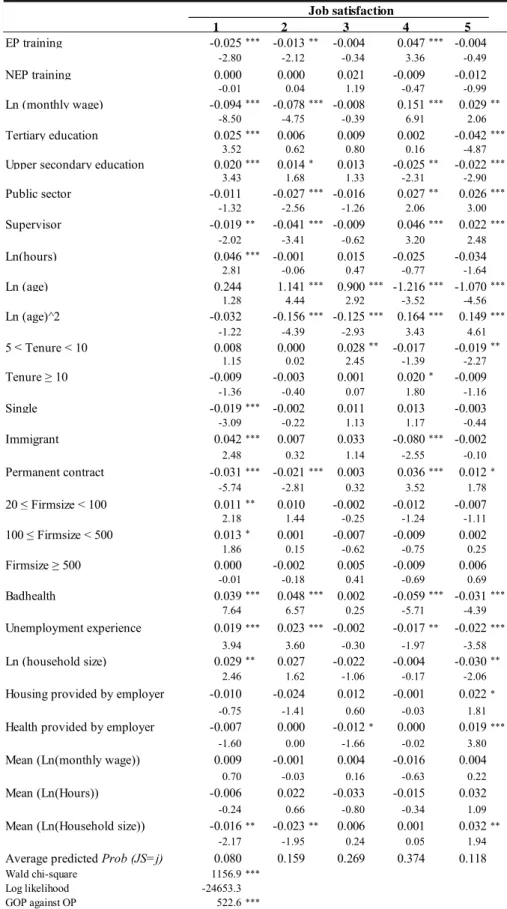
coefficient in column j for variable k represents how the probability of outcome j changes for a marginal increase (or discrete change in case of dummy variables) in variable k. Thus, if a variable exerts a positive effect on job satisfaction, it must decrease the probability of reporting a low JS level and/or increase the probability of high JS. The MPEs are calculated at the sample mean of the continuous variables and for the reference individual.
--- Insert Table 4 about here ---
Most of the qualitative effects found in the data do not come as a surprise to the connoisseur of literature on job satisfaction. However, the results provide a novel view on the subject by breaking down these effects across outcomes of the JS distribution. In what follows, we discuss the main findings.
4.1 Training and the determinants of JS
As expected, labour earnings are closely related to overall JS. A 0.01 increase in logarithmic earnings (an approximately 1% increase in the level of earnings) decreases the probability of reporting the lowest satisfaction category (JS=1) by 0.094 percentage points (pp), and a similar effect is found for JS=2 (-0.078 pp). Conversely, a 1% increase in labour earnings significantly increases the probability of reporting JS=4 (0.151 pp) and JS=5 (0.029 pp). To make the results more meaningful, let us consider a 50% increase in earnings, which corresponds to a 0.4055 change in ln (monthly wage). In this case, the probability of JS=1 decreases by 9.4×0.4055=3.81 pp, while the probability of JS=4 rises by 6.08 pp. To put these effects in perspective, in the bottom of Table 4 we report the average probability of the different outcomes implied by the model. Thus, for example, we find that the average probability of outcome JS=1 (8.0%) decreases by almost a factor of two when the representative individual experiences a 50% increase in earnings. The same increase, however, does not change the likelihood of the remaining outcomes by more than one fifth of their average probability.
satisfied in their jobs. Specifically, having tertiary and secondary education raises the probability of reporting the lowest satisfaction level by between 2.0 and 2.5 pp. Conversely, the probability of full satisfaction decreases by 2.2 and 4.2 pp if the individual has upper secondary and tertiary education, respectively. Being employed in the public sector, having a supervisory role and working fewer hours significantly raise the probability of reporting high JS and/or decrease the probability of reporting low JS. Age does not significantly affect the probability of observing JS=1, although older workers are more prone to be moderately or fully satisfied in the job6. The likelihood of job dissatisfaction (low JS) decreases with a permanent contract and rises among immigrants and singles. Similarly, reporting bad health, previous unemployment episodes and living in a larger household are negatively related to JS. As expected, workers who receive health insurance or housing from the employer are more likely to be satisfied with their jobs, the former effect being more significant than the latter.
All in all, these results are consistent with earlier studies indicating that JS is increasing in labour income, u-shaped in age, lower among singles and more educated individuals, and higher among public servants and workers with a permanent contract. The lower satisfaction found among individuals living in larger households, having health problems, and working more hours is also consistent with previous studies. As most of these results have long been discussed in the literature, we will not elaborate on them further7.
Next, we turn to the training variables. We detect a differential effect on JS depending on whether or not the training is provided by the employer. Specifically, NEP training is innocuous in terms of JS: it does not significantly affect the probability of reporting low or high JS. In contrast, workers report higher levels of JS when they participate in EP programmes. This participation reduces the probability of JS=1 and JS=2 by 2.5 and 1.3 pp, respectively, while increasing the probability of JS=4 by 4.7 pp. These effects are significant at the 5% level. It is worth noting that the training effect is not homogenous
6 Inspection of the linear and the quadratic term shows that the probability of JS=5 is decreasing until age 36 and
increasing thereafter. This minimum takes place at age 41 when it comes to JS=4.
across satisfaction levels. The negative, significant impact on the probability of outcome JS=1 does not switch to positive and significant in JS=5. This observation suggests that while EP training significantly reduces the probability that a worker is dissatisfied with the job, the same training does not induce the individual to be among the most satisfied workers. Indeed, a glance at Table 4 reveals that these asymmetric effects apply to most other covariates. For this reason, the next subsection is devoted to i) examining the extent of these asymmetries more accurately and ii) contextualizing the importance of EP training with regard to other covariates in different segments of the JS distribution.
4.2 Asymmetric effects in the determinants of JS: satisfiers and dissatisfiers
We find that some variables which are relevant to explaining low JS are not relevant to explaining high JS, and vice versa. This result is novel in the literature. Specifically, a glance at the last column of Table 4 reveals that working in the public sector (2.6 pp), age and age squared (-1.07 and 0.149 pp for a 1% increase, respectively), tenure (-1.9 pp for tenure between 5 and 10 years), housing and health insurance provided by the employer (2.2 and 1.9 pp, respectively) significantly affect the probability of an individual being fully satisfied in the job. These variables act, therefore, as satisfiers, because they are not relevant to explaining why some workers are not at all satisfied with their jobs. Conversely, hours of work, singlehood and firm size are dissatisfiers: they are not significantly related to outcomes JS=4 or JS=5, but turn out to be statistically significant for JS=1.
To make the point more clear, in Table 5 we rank the determinants of high and low satisfaction according to their marginal effects and assuming a null effect for the variables that are not significant at the 10% level. For the logarithmic variables we consider the effect of a 50% increase on JS. This is intended to make the comparison between the categorical and the continuous variables more meaningful. For the purposes of our discussion, we exclude the Mundlak correction terms from the ranking. As is apparent, the rank of the different dimensions varies substantially across JS levels. Notwithstanding, certain profiles can be established. Some covariates have a higher rank when accounting for low JS than for high JS. Thus, for example, earnings (14th) and permanent contract (13th) rank very low in JS=5 but are, in contrast, amongst the most relevant dimensions
when accounting for JS=1 (3rd and 4th, respectively). Therefore, these variables act mostly as dissatisfiers. This is also the case of hours of work, singlehood and firm size. Conversely, the satisfiers can be characterized by increasing importance as we move towards higher JS levels. Among these, we include age, public sector, housing and health provided by the employer and, to a lower extent, tenure. Finally, a third group of variables (education, supervisory role, immigrant, bad health and unemployment experience) do not exhibit a clear pattern across JS levels. EP training can be included in this group for it ranks high (6th) among the determinants of JS=1 and JS=4 and low when accounting for JS=2 (11th) and JS=5 (15th). Still, if we restrict the analysis to the bottom and the top satisfaction levels, EP training acts as a dissatisfying rather than a satisfying factor.
--- Insert Table 5 about here ---
In Table B1 of Appendix B we report the MPEs implied by the OP model. In this case, the ratio of MPEs between the different covariates as well as the ranking of variables (last column) is constant across JS levels. In this setting, any given covariate is assumed to be as important for job satisfaction as for job dissatisfaction, thus eliminating, a priori, any possible distinction between satisfiers and dissatisfiers in the job. Whether or not to reject this hypothesis must be decided by globally testing the GOP against the OP. The null hypothesis is given by the restricted (OP) model, H0: βj = β for all j=1,…, J, while the alternative hypothesis corresponds to the unrestricted (GOP) model: H1: βj ≠ βm for some j ≠ m. The likelihood ratio test consists of calculating the difference times two between the log-likelihood value of the restricted and the unrestricted model. This statistic, reported in the bottom part of Table 4, follows a ji-square distribution with degrees of freedom equal to the number of restrictions, (J-1)×K. According to its empirical value, 522.6, the hypothesis of equality of coefficients across outcomes of the dependent variable must be rejected.
4.3 The subjective value of EP training
Now we can use the estimation results and Eq. (6) to determine the equivalent income of training activities. The calculation is not performed for NEP training given that, as seen
above, these activities are irrelevant to JS.
Before proceeding, a remark is in order. Our estimating equation contains two distinct MPEs associated with earnings: (1) a direct effect, measured by the labour earnings coefficient, and (2) an indirect effect via the Mundlak correction term averaging earnings over an 8-year period. The first term measures the impact on JS of transitory changes in earnings; an effect that van Praag and Ferrer-i-Carbonell (2008) call the shock effect. The second term, in turn, accounts for permanent, long-term changes in earnings, as it is associated with the average level of earnings over the sample period. While differentiating between transitory and permanent changes is potentially interesting, a glance at Table 4 reveals that, in our case, the permanent effect fails to be statistically significant in all segments of the outcome distribution. For this reason we only consider the MPE of the shock effect in what follows.
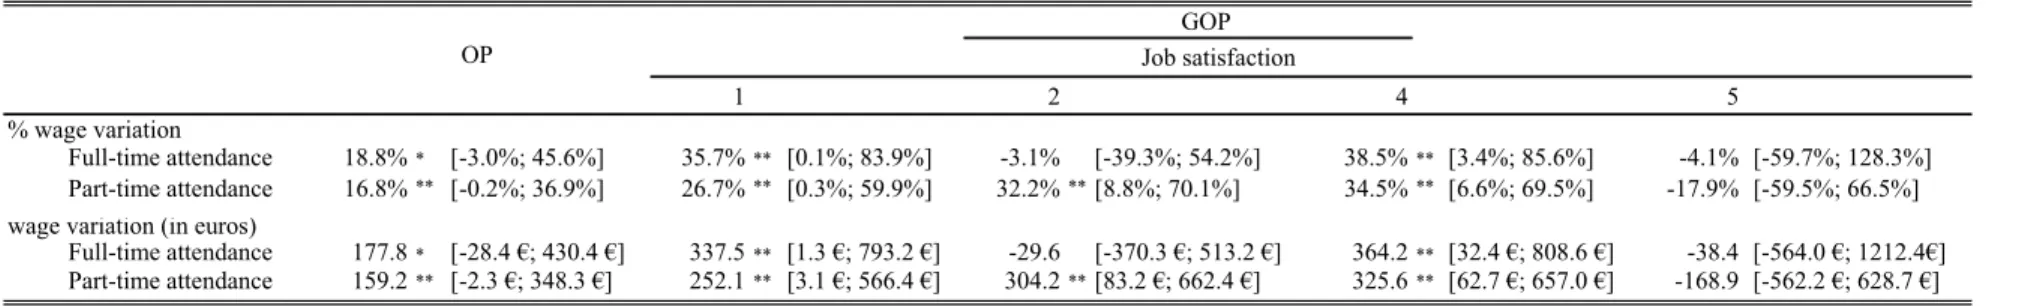
The results are reported in Table 6. The first row shows the percentage variation in wages needed to compensate the provision of EP training. The second row transforms this figure into euros using the sample average wage (€944.9) as the reference. All the estimates include a 95% confidence interval8.
--- Insert Table 6 about here ---
In the OP model (first column), the effect of training on JS is equivalent to a net monthly wage increase of 17.7%. For the sample average wage, this variation amounts to €166.8. This figure is the same for all workers, irrespective of their latent satisfaction level. In the GOP model, in turn, the trade-off ratio shows variation across segments of the JS distribution. In this case, training is not equally relevant for all workers: it is more valuable among workers with low latent satisfaction levels (JS=1 and JS=2) and among workers with moderately high satisfaction (JS=4). Specifically, the equivalent income measure amounts to a 30.5% variation in monthly earnings (€287.8) for JS=1, decreases to 18.2%
8 The equivalent income measure is a ratio of two distinct covariates. Therefore, we need to take into account the
standard deviation of such a ratio in order to compute the confidence interval. This is done by using the “nonlinear combinations of estimators” option in STATA, which yields first and second moments of nonlinear combinations of the different covariates.
(€172.0) for outcome JS=2, and then rises to 36.1% (€341.4) for JS=4. The corresponding figure is not significantly different from zero in JS=5, thus confirming that (the lack of) EP training is not a relevant dimension among workers with high latent satisfaction levels. As neither income nor training are relevant to account for JS=3, we omit this category from the analysis9.
To examine whether differences across segments of the JS distribution in the shadow value of training are relevant from a statistical point of view, we tested the GOP against the OP specification, now focussing exclusively on the income and training variables and disregarding the remaining covariates. Following the test, we rejected the hypothesis that the equivalent income of training is constant across JS levels10.
4.3.1 Differences across training types
Classifications 1A and 1B allow us to explore whether there exist relevant differences in the subjective valuation of different training schemes. The results are presented in Tables 7 and 8. They are based on the MPEs reported in Table B2 of Appendix B.
--- Insert Tables 7 and 8 about here ---
Training activities attended on a full-time basis are only slightly more valuable than those attended part-time. On average, the difference is small (€177.8 vs. €159.2 in the OP model) although it can be larger among workers who are unsatisfied with their jobs (€337.5 vs. €252.1 for JS=1) and those who are moderately satisfied (€364.2 vs. €325.6 for JS=4). Table 8 differentiates between long- and short-term training activities. The results unambiguously show that short-term programmes are more valuable for workers. In the
9 This should come as no surprise. The fact that income is not relevant for the central outcome JS=3 is consistent with
income being positively related to high JS and negatively related to low JS, with a similar reasoning applying to training.
10 In this case, we do not test the GOP against the OP model globally. Rather, we focus on whether or not differences
across outcomes are statistically significant only in the case of earnings and EP training. This is done by estimating a GOP model where the earnings and training effects are assumed to be constant across outcomes (null hypothesis). We then use the log-likelihood value of this restricted model to conduct the likelihood ratio test against our benchmark model. This statistic follows a ji-square distribution with (J-1)×2 degrees of freedom. The corresponding value, 26.7, falls again beyond the 99% confidence interval.
OP model, the subjective value of short training programmes amounts to a 32.6% wage increase (€308.4), and rises further in the GOP model among individuals who are not satisfied at all in the job (47.8% or €453.0). However, the highest valuation corresponds to workers who are moderately satisfied with the job, JS=4. In this case, the income compensation amounts to a 72.8% variation in the net monthly wage.
In contrast, long-term training activities fail to be relevant for JS. Their equivalent income amounts to a negligible 6.5% of monthly earnings in the OP or, to put it differently, to €63.5. This compensation is not significant at conventional levels, with similar results found for the GOP. This finding may be surprising as it seems to contradict the intuition that investing in human capital for longer periods must yield larger gains. However, this may not be the case in light of previous research showing that training programmes may actually be more effective when they are shorter in length (Bassanini et al., 2005, pp. 125). Moreover, in many cases shorter courses are tailored to specific skill needs, based on specific contents, and aimed at improving and updating on-the-job skills, while longer programmes tend to be more general and less related to the current job (Budría and Pereira, 2007). The high valuation of short-term programmes would be consistent with workers appreciating more specific training with immediate purposes.
5. Discussion
We have found that EP training is a relevant dimension of JS. This is true even after controlling for a large set of job market and demographic characteristics, including labour earnings, education and tenure, and after controlling for individual (random) effects. We have provided a quantitative assessment on this issue by calculating the equivalent income of EP training. The estimates reveal some variation across individuals with low and high latent satisfaction levels and across training types. The average estimate provided by the OP model indicates that the importance of training for the worker would be equivalent to a 17.7% increase in net monthly earnings.
The first question that arises is whether this value, which amounts to a considerable sum, is credible. The estimate is quite impressive if we take into account that alternative methods
based on objective measures typically show lower benefits from training activities. The comprehensive evidence reported by the OECD (2004) and Bassanini et al. (2005) suggests that private returns to training (which are below 5% in most cases) are pyrrhic enough to consider training activities as being very relevant for the earnings prospects of workers. Most figures, however, are based on broad definitions of training. More meaningful comparisons can be made by considering studies that focus on firm-provided training. To name a few, in Parent (1999) and Blundell et al. (1999) the wage returns to training range from 3% to 12% depending on whether instrumental variables or fixed-effects are used in the estimation. These returns are slightly lower in Pischke (2001), who finds that one year of full-time, work-related training increases wages by between 2.6% to 3.8%. In Goux and Maurin (2000), an initial return of 7.1% drops to -5.7% after considering selectivity issues. In Leuven and Oosterbeek (2008), an initial 9.5% falls to a return that is close to zero when unobserved heterogeneity is taken into account.
The main message from these estimates, which can be extended to other papers, is that returns to employer-provided training rarely lie within the two-digit realm. How does this evidence compare with a subjective appraisal? We must note that our estimates are already controlling for labour earnings. That is, the variation in JS due to an increase in earnings as a result of participation in a training programme is already netted out from the training coefficient. This coefficient therefore focuses on the intangible, non-pecuniary benefits of the programme, showing that training brings important benefits for the worker in addition to wage and productivity returns. More importantly, these subjective benefits are found to be remarkably larger than the objective ones.
Is EP training worth almost 200 euros a month?
There are at least two reasons why we consider that our estimates are not outrageous. First, there is evidence to suggest that as much as between 50% and 70% of the productivity effects from training are not realized by individuals, with firms extracting considerable rents from their human capital investments (OECD, 2004). The larger estimates found with the subjective method would be consistent with workers internalizing part of these firm effects.
The second explanation has to do with the concept of procedural utility suggesting that individuals not only value outcomes as usually assumed in economic theory, but also the conditions and processes leading to these outcomes (Frey et al., 2004). Training activities organized by employers are expected to improve opportunities for skill use within the firm, allowing workers to take advantage of their skills and valued abilities in an enriching environment of job content and task variation. Similarly, participation in EP training activities may allow workers to hold more attractive roles in the firm, improve their perceived social position, enhance self-respect and lead to higher recognition of job status and occupational prestige. These two dimensions (opportunity for skill use and valued social position) were identified by Warr (1994) as driving forces of JS. An additional factor pointed out by Warr is the opportunity of benefitting from supportive supervision. It is likely that participation in EP training is followed by periods of supportive management, participation in decision-making and improved support from the boss or employer, thus raising the worker’s perception of the job’s value. We found evidence to suggest that, taken together, these dimensions prove to be more relevant for JS than the potential earnings gains arising from training.
A related finding is that workers with very low and moderately high satisfaction levels are more sensitive to (the lack of) training opportunities than workers who are very satisfied with their jobs. This finding just barely scratches the surface of how and to what extent individuals who are apparently equal but satisfied to different degrees may value training opportunities. Although testing for explanations is beyond the scope of this research, we may advance two candidate hypotheses. First, we are tempted to argue that the benefits of training in terms of opportunity for skill use, valued social position and supportive supervision are lower among individuals who are already very satisfied in the job. It is likely that workers in this group already hold jobs in which space for improvement in these terms is small, although we lack a theoretical framework to support this view.
The second explanation refers to psychological employment contracts, which have recently gained increasing importance among human resource practicioners to understand the relationship between workers and firms (Rousseau and Wade-Benzoni, 1994). Psychological contracts are based on a set of expectations that employees have concerning
their firm as well as what the firm expects of their employees. Non-compliance or violation of a psychological contract signals that the parties to the contract no longer share a common set of values and objectives, leading employees to lower their level of commitment to the organization and engage in dysfunctional behaviour. Training policies, one of the most relevant domains of human resource management, may contribute to the reinforcement or incompliance of such contracts through the provision or under-provision of training opportunities. As far as training opportunities are concerned, the results suggest that workers with low satisfaction levels as well as moderately satisfied workers are more prone to see their psychological contract with the firm unfulfilled in the absence of training opportunities. Conversely, fully satisfied workers are more likely to feel more attached to the firm and to experience their jobs as more challenging and intrinsically rewarding. It is conceivable that the absence of training has a very limited impact on the job evaluation made by this group.
Endogeneity and reverse causality
An important question in this type of research is the direction of causality. Are trained workers more satisfied or more satisfied workers are more likely to get training? Similarly, it is arguable that JS and training are simultaneously determined, and that part of the estimated effect is due to a spurious relationship. Although these concerns are important and in some sense common in the literature, there are reasons to be pragmatic. First, the within-group component of the panel estimation is based on the observation of how the JS of the same people responds to changes in training participation over time. This implies that individual unobserved factors that may simultaneously affect JS and training (such as personality traits, productivity, commitment) have already been accounted for in the estimation.
Second, the endogeneity of training is a common concern in the literature. Most of this concern, however, stems from research that focuses on wages and productivity, insofar as workers are likely to be selected (or self-selected) into training due to differences in potential productivity. Whether training participation is also mediated by JS levels is less apparent. Still, we cannot discard this possibility. To shed light on this issue, we conducted an exploratory exercise aimed to test whether periods of high JS are followed by increased
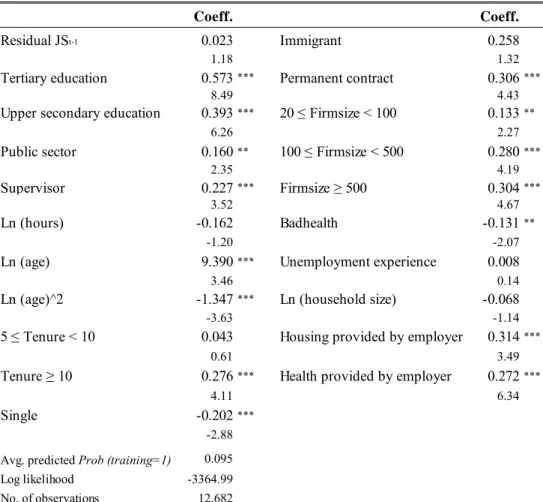
training participation. More specifically, we asked whether individuals who are more satisfied in the job at time t-1 are more likely to participate in EP training at time t. This was done by calculating the residual (unexplained) JS of each respondent from our benchmark JS equation and then estimating a training participation equation in which residual JS in the previous period and the usual socio-demographic characteristics were entered as regressors. Observations with missing values for the lagged residual were excluded from the estimating sample. The probit estimates, reported in Table C1 of Appendix C, seem to be at odds with the existence of reverse causality. Although positively related, previous JS fails to be statistically significant when accounting for training participation. Thus, we cannot reject the hypothesis that individuals above the JS regression line (i.e., with higher residual JS) are as likely to participate in training as their less satisfied counterparts11. The same result holds when we considered residual JS at time
t-2 and t-3, the average residual JS between t-3 and t-1, and when the monthly wage was included in the participation equation. Still, given the yearly basis of our data, we could not explore whether the response of training to JS takes place within the same year.
Robustness of the results
A final question regards the robustness of the estimates to changes in the set of controls included in the regressions. To isolate the effect of training on JS, a large number of covariates are considered in the paper. It may be argued, however, that some of the covariates are endogenous and that a more parsimonious specification would capture the ‘true’ effect of training more appropriately. Thus, for example, if participation in EP training improves a worker’s chances of being offered a permanent contract or a supervisory role, the satisfaction effects of these covariates can be interpreted as benefits gained from the training itself rather than the benefits from having a permanent contract and a supervisory role. A similar reasoning applies to other variables, including tenure and working hours. Although these effects are more likely to operate in the opposite direction (i.e., participation in training is a consequence, not the cause, of certain job conditions) we conducted some sensitivity analyses.
11 The results for the remaining variables do not present surprises for the connoisseur of the literature: education, tenure,
In computations not reported here, we estimated a set of four alternative equations ranging from our benchmark specification to a very parsimonious equation where earnings, education, age and training were the only controls. We found that as the number of regressors decreased, the implied shadow value of training increased. The maximum increase was some 30% in the simplest specification. Specifically, when moving from the benchmark model to the most parsimonious model, the shadow value of EP training rose from €166.8 to €223.1 in the OP. For full-time training the corresponding increase was from €177.8 to €235.4, while for part-time training it increased from €159.2 to €214.9, and from €308.4 to €356.9 for short-term training. Long-term training remained non-significant and the results from the GOP presented similar variations. From this exercise we concluded that, first, the trade-off ratio between income and training implied by the JS equation is reasonably robust across alternative specifications and, second, that the estimates reported in the paper can be interpreted as a lower bound of a larger set of estimates.
In parallel computations, we also explored whether the equivalent incomes changed much when using gross rather than net monthly earnings, and when switching from monthly to hourly earnings. The changes were not substantial, but pointed to slightly higher estimates with gross and hourly earnings. Additional encompassing tests showed no preference between the different earnings variables.
6. Conclusions
In this paper we used panel data to investigate the causal relationship between training and job satisfaction. We differentiated between employer-provided and non employer-provided training activities and found that while NEP training is not relevant for JS, EP training exerts a significant effect on workers’ JS. The results were used to provide pioneering estimates of the economic value that workers implicitly attribute to EP training.
The results from the OP model were complemented with the estimation method proposed by Boes and Winkelmann (2009). This approach allowed us to differentiate between
provision of housing and health insurance by the employer are more closely related to job satisfaction than to job dissatisfaction (satisfiers). Conversely, (low) earnings, hours of work, singlehood, (not having a) permanent contract and firm size were identified as dissatisfiers. EP training belongs to this second group, at least when the lowest and the highest satisfaction levels were considered.
As a consequence of the existing asymmetries in the determinants of JS, the shadow value of training was found to differ across JS levels. More specifically, we found that EP training is very valuable among workers with low and moderately high latent JS and largely irrelevant for workers who are completely satisfied with their jobs. We differentiated between several types of training and found that short-term training spells are particularly rewarding.
There are several policy implications arising from the results. First, recommendations regarding the expansion of training among the working population are typically based on estimates of wage and productivity returns. The results here suggest that these returns may largely understate the true benefits of training activities. While objective estimates typically yield very low returns, the subjective approach used in the paper shows that as far as JS is concerned, taking part in training schemes can, on average, be equivalent to a 17.7% increase in earnings. This finding supports the notion that if enhancing JS among the workforce is a political goal, then the under-provision of training is greater than previously thought.
Second, in the literature on High Performance Work Systems (HPWS), training is considered part of a larger package of human resource practices aimed at protecting and enhancing a firm’s investment in human capital. Much of the current debate centres on identifying what practices are more relevant along this dimension. The results in this paper suggest that EP training should be one of the pillars of a successful HPWS, insofar as it is closely related to JS among specific groups of workers. The results, moreover, can help employers design training programmes that are both effective and economical. We found that short training spells are particularly relevant for JS and that courses attended on a part-time basis are roughly as rewarding as those attended full-part-time. Therefore, implementing
training schemes of this kind may help employers see their financial and emergent costs reduced.
Thirdly, the results can encourage organizations to make full use of human capabilities and safeguard employees’ needs by paying more attention to psychological issues. From previous studies we know that dissatisfied workers are less productive, less loyal to the job and less cooperative. Our findings, which show that EP training is particularly rewarding among dissatisfied workers, suggest that training efforts directed towards this group may have a large effect on the average JS level in the firm. On the contrary, EP training programmes appear to have little impact on workers who are already very satisfied, thus suggesting that in order to retain and motivate this group, employers should rely on alternative compensation schemes.
Finally, the paper suffers from some limitations that are worth noting. First, the information on training activities reported by participants in the ECHP is far from being perfect. Differentiating between long- and short-term training allowed us to control for the role of training intensity only partially. It would be very interesting to know how, and to what extent, the estimates change when the exact duration of the training spell and the number of courses attended are taken into account. Similarly, knowing whether the training is certified or not, general versus firm-specific or attended on site or off site, would yield interesting results. This information, however, is not available in most panel datasets. The results presented here should therefore be complemented with further research as new panel data providing more detailed information on EP training activities become available.
As a second limitation, the paper does not attempt to ascertain whether the value of training differs across population groups. Participation in training schemes among specific workers may be more beneficial than would be expected from estimates based on the total working population. Differentiating between levels of education may give rise to interesting results in this regard. Previous research has shown that training interacts positively with formal education by increasing earnings and job opportunities. Although our results control for labour earnings, it is likely that educated individuals are more
sensitive to the (under-) provision of training activities due to existing synergies between education and recently acquired skills. Job satisfaction is also influenced by processes of social comparison and the perception of other worker’s situations and rewards (Clark et al., 2009). To the extent that more educated individuals have more aspirations and expect more from jobs, the role of training among these groups is likely to exhibit a greater effect. Similarly, differences in tenure and gender may mediate the final impact that training has on JS.
References
Bassanini, A., A. Booth, G. Brunello, M. De Paola and E. Leuven (2005), Workplace Training in Europe, IZA Discussion Paper 1640.
Benz, M. and B. Frey (2004), Being Independent Raises Happiness at Work, Swedish Economic Policy Review 11(2), 95-134.
Blundell, R., Dearden L., Meghir C., and Sianesi B. (1999), Human Capital Investment: The Returns from Education and Training to the Individual, the Firm and the Economy,
Fiscal Studies, 20(1), pp. 1-23.
Boes, S., and R. Winkelmann (2009), The Effect of Income on General Life Satisfaction and Dissatisfaction, Social Indicators Research 95, 111-128.
Booth, A. and J.C. van Ours (2009), Hours of Work and Gender Identity: Does Part-Time Work Make the Family Happier?, Economica 76(301), pp. 176-196.
Budría, S. and P.T. Pereira (2007), The Wage Effects of Training in Portugal: Differences across skill groups, genders, sectors, and training types, Applied Economics 39(6), 787-807.
Cacioppo, J., L.C. Hawkley, A. Kalil, M.E. Hughes, L. Waite and R.A. Thisted (2008), Happiness and the Invisible Threads of Social Connection: The Chicago Health, Aging and Social Relations Study, in The Science of Subjective Well-Being, M. Eid and R.J. Larsen (Eds.), The Guilford Press, New York.
Clark, A.E. (1999), Are wages habit-forming? Evidence from micro data, Journal of Economic Behavior and Organization, 39, 179-200.
Clark, A.E. (2001), What really matters in a job? Hedonic measurement using quit data,
Labour Economics, 8, 223-242.
Clark A.E., and A. Oswald (1996), Satisfaction and comparison income, Journal of Public Economics, 61, 359-381.
Clark A.E., A. Oswald and P. Warr (1996), Is job satisfaction U-shaped in age? Journal of Occupational and Organizational Psychology, 69, 57-81.
Clark, A.E., E. Diener, Y. Georgellis and R.E. Lucas (2008), Lags And Leads in Life Satisfaction: a Test of the Baseline Hypothesis, Economic Journal, 118(529), 222-243.
Clark, A.E., N. Kristensen and N. Westergård-Nielsen (2009), Job Satisfaction and Co-worker Wages: Status or Signal?, Economic Journal, 119(536), 430-447.
Danner, D., D.A. Snowdon and W.V. Friesen (2001), Positive emotions in early life and longevity: findings from the nun study, Journal of Personality and Social Psycology, 80, 804-813.
Diener, E. and R. Lucas (1999), Personality and subjective well-being, in Well-being: the foundations of hedonic psychology, D. Kahneman, E. Diener and N. Schwarz (eds.). New York: Sage.
Di Tella, R., R.J. MacCulloch and A. Oswald (2003), The Macroeconomics of Happiness,
The Review of Economics and Statistics, 85(4), 809-827.
Ferrer-i-Carbonell, A. (2005), Income and well-being: an empirical analysis of the comparison income effect, Journal of Public Economics, 89(5-6), 997-1019.
Ferrer-i-Carbonell, A. and B. van Praag (2002), The Subjective Costs of Health Losses due to Chronic Diseases: An Alternative Model for Money Appraisal, Health Economics, 11, 709-722.
Ferrer-i-Carbonell, A and P. Frijters (2004), How Important is Methodology for the estimates of the determinants of Happiness?, Economic Journal 114(497), 641-659. Fischer, J. and A. Sousa-Poza (2009), Does job satisfaction improve the health of workers?
New evidence using panel data and objective measures of health, Health Economics, 18(1), 71-89.