How Does a Prior Alliance
Between Target and Acquirer
affect R&D Performance?
Trabalho Final na modalidade de Dissertação apresentado à Universidade Católica Portuguesa para obtenção do grau de mestre em Business Economics
por
Diogo Carmo Oliveira Pina Ferreira
sob orientação deProfessor Doutor Ricardo Gonçalves
Católica Porto Business School Setembro de 2018
Acknowledgements
I would like to thank everyone that supported me throughout these months by motivating and inspiring me to persevere throughout the process of writing this thesis.
I would like to thank my supervisor, Professor Ricardo Gonçalves, not only for his crucial advice and knowledge of the subject, but also for his patience, and passion conveyed towards scientific investigation.
I would like to thank my family for always being there for me, especially during the moments I was feeling adrift. Thank you, Mum, Dad, Sister and Grandma, for your unconditional love and constant comfort. I must also thank my grandfather, who helped shape me into who I am today, and I am sure will be beyond delighted for this achievement.
Finally, I would like to thank my friends for not giving up on me and understanding my absence throughout these months. And Sofia, whose determination and affection enabled me to succeed.
Abstract
The pharmaceutical industry has been in the spotlight for the last decades regarding some conflicting trends. Despite a consistent increase in research and development (R&D) investment, the number of approved drugs has remained, at most, constant. In addition, the pharma industry has witnessed a large trend in consolidation through mergers and acquisitions (M&As), which has not always translated in an improvement in R&D productivity. The aims of this paper are to study the effect of a pre-acquisition alliance on the R&D productivity of the merged firm, as well as looking at specific alliance characteristics that may influence this outcome. This study looks at the pharmaceutical industry from 1981 to 2017 and finds that the existence of an alliance prior to a merger negatively affects the R&D productivity of the merged firm. Reasons for this relationship may be that the knowledge gained during the alliance period does not benefit the acquirer in a way that is significant enough to increase its R&D productivity, or even that this earned insight is not immediately reflected during the post-M&A period. The implications of these findings look to improve the understanding of the productivity crisis in the pharmaceutical sector.
Keywords: M&A, Merger, Acquisition, R&D, Alliance, R&D productivity,
Table of Contents
Acknowledgements ... iii
Abstract ... v
Table of Contents ... vii
List of Figures ... ix
List of Tables ... xi
1. Introduction ... 13
2. Literature review ... 17
2.1 Alliances ... 17
2.2 Advantage of collaborating before M&A ... 19
2.3 Mergers and acquisitions in pharmaceutical industry ... 20
2.3.1 Brief history ... 20
2.3.2 Determinants of Mergers and Acquisitions ... 20
2.4 Pipelines, patents, NME costs ... 23
2.5 Declining R&D productivity ... 26
2.6 Similar literature ... 28
3. Data and Methodology ... 31
3.1 Data ... 31 3.1.1 Data processing ... 31 3.1.1 Preliminary data ... 34 3.2 Methodology ... 39 3.2.1 Dependent variable ... 39 3.2.2 Independent variable ... 40 3.2.3 Control variables ... 41 3.2.4 Regressions ... 43 3.2.5 Summary Statistics ... 45 4. Results ... 46 5. Discussion ... 52 6. Limitations ... 57 References ... 59
List of Figures
Figure 1 - Approval timeline for new molecular entities (NMEs) ... 26 Figure 2 - Volume of M&A deals (1981-2017) ... 35 Figure 3 - M&A deal volume with and without previous alliance (1981-2017) ... 36 Figure 4 - Alliances vs M&A activity (1981-2014) ... 37 Figure 5 - Relationship between R&D Productivity (sales) and alliance duration ... 49
Figure 6 - Relationship between R&D Productivity (shareholder returns) and alliance duration ... 49
List of Tables
Table 1 - Summary statistics ... 34 Table 2 - Summary statistics for key variables ... 45 Table 3 - Regression results showing the effect of a previous alliance on R&D productivity ... 50
Table 4 - Regression results showing the effect of alliance duration and number of drugs collaborated on R&D productivity ... 51
Chapter 1
1. Introduction
The pharmaceutical industry has seen some incredible breakthroughs in its recent years. For example, drugs and vaccines protecting against malaria have saved around 1.14 million children between 2011 and 2015, deaths from measles in Africa have been reduced by 79% between 2000 and 2014, the industry has been the third largest contributor towards the R&D of neglected diseases, and the number of deaths arising from HIV/AIDS has decreased by more than 50% from 2005 to 2015 alone (IFPMA, 2017). However, the pharma sector has also undergone significant change over the past decades; from suffering productivity shocks, seeing its research and development costs for new molecular entities soar, facing expiration of key patents and witnessing a wave of consolidation in the sector. The average R&D cost of producing a new drug and placing it on the market is estimated to be around US$2.5 billion (2013 dollars) (DiMasi et al., 2016), whereas the number of drugs that are approved for production are no higher this year than they were 50 years ago (Munos, 2009).
In a knowledge and research-intensive industry such as the pharmaceutical industry, when faced with declining R&D efficiency, changes in the firms’ strategic outlook must be considered. Moreover, innovation becomes more efficient when firms collaborate instead of working in isolated environments; not only because of the high costs involved in R&D, but also in testing, manufacturing, and marketing the drugs. For this reason, many multinational pharmaceutical companies are looking at creating growth options by engaging in mergers and acquisitions with (usually) smaller firms to improve declining drug pipelines. However, M&As are often associated with integration problems
and cultural shocks (Thanos and Papadakis, 2012; Bauer and Matzler, 2014), which may not be desirable in the short-run. For this reason, firms look at establishing alliances and collaborations with other firms to improve their understanding of the targets’ assets, competencies and knowledge, due to the inherent difficulty in valuing these assets quantitatively (Kogut, 1991; Higgins and Rodriguez, 2006; Meschi et al., 2017). Balakrishnan and Koza (1989, p. 8) conclude in their study that, “the joint-venture affords opportunities for learning and gathering new information about the value of the partner’s assets”.
Two key studies have found that declining product pipelines and deteriorating R&D productivity are main drivers for M&A activity. The first study looks at a sample of 160 pharmaceutical firms from 1994-2001 and find a positive relationship between deteriorating product pipelines and propensity to engage in an M&A (Higgins and Rodriguez, 2006). The second study finds that small and large firms use mergers in different situations. Whereas for large firms, mergers are used mainly as a response to patent expirations and declining pipelines; small firms use mergers as an exit strategy due to financial issues (Danzon et al., 2007). On the other hand, Porrini (2004) investigates the existence of a previous alliance between acquirer and target and investigates the effect it poses on post-acquisition performance. The author finds a positive relationship between the two variables.
Currently, the most similar study to this one is that of Danzon et al. (2005, p. 317), where it is found that products “developed in an alliance tend to have a higher probability of success”. Nevertheless, the period studied is limited to 1988-2000 and there is no mention of the effect this has on the company’s R&D productivity. Therefore, following a similar line of thought, the aim of this paper is to investigate what effect a pre-acquisition alliance between two firms in the pharmaceutical industry has on the future R&D productivity of the combined firm. Compared to other studies, this paper offers a more thorough investigation
due to the time period considered, 1981-2018. The goal of this paper is to fill an existing gap in the literature by focussing on a specific – pharmaceutical – industry to try and capture what effect collaborations (in the form of alliances) have on R&D. This paper then focusses on two alliance characteristics, namely alliance duration and number of drugs collaborated during the alliance, to try and capture more specific determinants of R&D productivity.
There are several reasons for choosing the pharmaceutical industry for this study. Firstly, it is one of the most research-intensive industries in the world, and the most research intensive in the US (PhRMA, 2018). Secondly, it has been in the forefront of every wave of mergers and acquisitions; with a very strong trend of consolidation in the last decade. Lastly, it is an industry that features a high number of inter-firm collaboration, showing an increasing trend of alliances serving as a complement to mergers. For example, GlaxoSmithKline is allocating around 50% of its R&D budget to establishing alliances with partners from academia and with the biotechnology industry (Schuhmacher et al., 2016).
The main findings in this study include the observation of a negative significant relationship between alliances and R&D productivity at the time of the merger. In other words, the existence of a pre-acquisition alliance leads to a decrease in R&D productivity for the merged firm. Furthermore, a negative significant relationship was also found between the duration (number of years) of an alliance and its effect on R&D productivity. Finally, the number of drugs collaborated between firms in an alliance prior to a merger was found to contribute negatively towards R&D productivity; however, this result was not found to be significant.
As Ornaghi (2009) refers in his paper, it is impossible to exclude the possibility that any correlation that may arise from M&A outcomes is due to sources of unobservable factors. For example, if the reason behind the decision of a firm to merge is due to an anticipation of poor financial performance, the analysis in this
paper may not be picking out the effects of the merger. Instead, this paper follows the assumption that alliances established prior to a merger or acquisition allowed the acquiring firm to gain an insight into its target’s characteristics, that would not be possible otherwise.
The remainder of this paper is organized as follows. Chapter 2 presents the theoretical assumptions and background of the concepts discussed throughout, including alliances, R&D productivity and M&As. Chapter 3 discusses the methodology used to explain the research questions, the sources of the data used, and what kind of empirical analysis will be performed. Chapter 4 presents and discusses the empirical findings. Chapter 5 introduces a discussion of the results. Finally, Chapter 6 points to the limitations of the study.
Chapter 2
2. Literature review
2.1 Alliances
Alliances are relationships between two or more firms that involve the exchange, sharing or co-development of resources and capabilities (Gulati, 1995) as well as the pooling of resources and skills in order to achieve mutually common goals (Varadarajan and Cunningham, 1995). Alliances introduce several advantages for organisations that engage in them: they stimulate the rate of entry of firms into new markets (Elmuti and Kathawala, 2001; Haase and Franco, 2015), allow firms to learn from each other (Hamel et al., 1989; Anand and Khanna, 2000; Kale et al., 2000), enable the access to complementary assets (Arora and Gambardella, 1990; Rothaermel, 2001), help to overcome market failures (Williamson, 1989), help to build new competences (Hennart, 1991; Varadarajan and Cunningham, 1995), facilitate entry into new markets and enhance knowledge about new technologies (Kogut, 1991; Mowery et al., 1996; García-Canal et al., 2002), allow sharing of risks, as well as costs that may originate from R&D or manufacturing processes (Ohmae, 1989; Varadarajan and Cunningham, 1995; Lu and Beamish, 2001), foster the development of new products (Rothaermel and Deeds, 2004) and improve market power (Porter and Fuller, 1986; Kogut, 1991).
Additionally, strategic alliances can take on several configurations depending on which part of the value chain they influence and to what extent equity plays a role. Whereas a joint venture will involve some equity share between two companies (say, a 50-50 share), a joint R&D contractual agreement does not have
18
to include equity. Instead, it may simply feature a written contract which is agreed by both parties (Kale and Singh, 2009). Nevertheless, this study shall be focussing on R&D alliances between two or more firms who jointly collaborate to research and/or produce a new drug. An example of an R&D alliance between two pharmaceutical firms was that of AstraZeneca with Cambridge Antibody Technology to collaborate on monoclonal antibodies (Ernst & Young, as cited in Jones and Clifford, 2005, p808).
However, it is crucial to mention that alliances also possess some disadvantages, especially if they are not managed correctly, which may lead to the destruction of core capabilities (Hamel, 1991). In his paper, Elmuti (2001) states that many researchers have come to the conclusion that the rate of success of alliances is quite low and many do not actually succeed. Bamford et al. (2004) and Kalmbach and Roussel (1999) go further and report that between 30% and 70% of alliances fail, whilst Das (2000) mentions that around half of alliances formed are actually stable or achieve satisfactory performance. Therefore, establishing collaboration deals is something that must be carefully planned and researched to avoid common mistakes such as the ones mentioned above. Moreover, the characteristics that make up the pharmaceutical industry intensify the probability that alliances could be less successful. The pharmaceutical sector is one of the sectors with the highest intensity of R&D (Ornaghi, 2009), it is surrounded by high degrees of uncertainty and riskiness (DiMasi et al., 1991; Rothaermel and Boeker, 2008) and is a technology intensive industry (Orsenigo
et al., 2001). These set of conditions assist in the probability that alliances may be
more prone to failure in relation to ones that are established in less technologically intensive sectors.
19
2.2 Advantage of collaborating before M&A
Market failure due to information asymmetry is frequent and a source of many problems, mainly because the acquiring firm tends to possess little or inaccurate information about its potential target (Porrini, 2004; Higgins and Rodriguez, 2006; Zaheer et al., 2010); leading to situations of adverse selection where targets can turn out to be “lemons” (Akerlof, 1970). Higgins and Rodriguez (2006) find that in the situations where the target firm withholds information from the acquiring firm about the value of their assets, the acquirer “tends to succumb to the winner’s curse and overpay for the target” (Higgins and Rodriguez, 2006, p. 356). Furthermore, regular due diligence might not solve this issue because there is always a possibility that the target firm may distort the true valuation of its assets, whether intentionally or not. Coff (1999, as cited by Zaheer et al., 2010) identified three types of information asymmetry that may arise when valuing assets of a target firm, these include: quality of assets; transferability of assets, and prospects for synergy.
For these reasons, when deciding on acquiring a firm, besides performing the regular corporate due diligence procedures, firms should engage in other activities which allow them to collect crucial information about the target firm. The proposal in this report is that alliances should be considered as a way of acquiring information that would otherwise be non-accessible to obtain better insight into the true value of the company.
20
2.3 Mergers and acquisitions in pharmaceutical industry
2.3.1 Brief history
The pharmaceutical industry has been characterized by various merger waves along the years, contributing to an increased concentration for the past 40 years. In his book focussing of mergers and acquisitions in the pharmaceutical industry, Rajesh Kumar (2012) found that in 1985 the largest ten pharmaceutical firms accounted for 20% of world sales and in 2002 this value increased to 48%. It would come as no surprise if today this value were to have increased even more. In addition, between 1985 and 2007, numerous M&As led to a consolidation of 51 companies becoming only 10.
The two largest M&As in the history of the pharmaceutical industry were consummated during the second merger wave, which began in the 1990s and went up until the 2000s, more specifically, both occurred in 2000. The first one was Pfizer’s acquisition of Warner-Lambert for around US$164 billion and the second was Glaxo Wellcome’s merger with SmithKline Beecham for around US$108 billion (values adjusted for inflation). To understand how prevalent M&A’s are in the pharma industry, in 2013, 2014 and 2015, three out of the ten major deals during each of these years occurred in this sector (Bloomberg, 2018).
2.3.2 Determinants of Mergers and Acquisitions
The main motives behind M&A’s in the pharmaceutical industry can usually be divided into five main categories, but I shall focus on the three most relevant ones for this study. These include, strategic response to environmental change, economies of scale and scope, and access to new technologies. Firstly, the idea that industry-wide shocks can lead to the creation of merger waves was firstly introduced by Gort (1969), and these help to understand how merger waves
21
could happen in other industries, such as banking and telecommunications (Grabowski and Kyle, 2012). During the 1980s, the pharmaceutical industry suffered an environmental transformation with R&D productivity falling as well as price competition becoming more intense due an increase in generic drugs, increased government pressure and a major crisis of patent expiration (Munos, 2009). With this in mind, firms had to reinvent their strategies to improve R&D productivity, limit buyer power and try to challenge generic drug producers. Thus, mergers and acquisitions turned into an attractive strategy that firms with large amounts of accumulated cash could pursue to face these challenges, which ultimately led to the first wave of M&A’s in the pharma industry. Mergers and acquisitions are an efficient way to cut costs because they allow for consolidation of operations, departments and administrative functions such as HR, legal, marketing and R&D staff. An example of this can be seen in the merger between Ciba and Sandoz that led to the creation of Novartis. This merger allowed the merged entity cost savings of around CHF1.5 billion in its first year of existence (Rajesh Kumar, 2012) due to the cost reduction in their highly complex supply chain that was the backbone of their manufacturing business. However, in an analysis published by Munos (2009) focussing on the effect of M&As on NME (new molecular entity) output, it was found that M&As are an effective way of boosting NME output for small firms but the same is not true for large companies. More specifically, there is a 95% probability that an M&A will increase NME output for small firms, whereas for large firms it is 95% likely that an M&A will not affect NME output.
Economies of scale and scope can be categorized as proactive motives for M&As, and these may include achieving economies of scale in research and development processes to increase productivity. Citing a series of studies by Henderson and Cockburn, Grabowski and Kyle (2012) describe that when examining the effect of scale and scope on productivity, the authors find that
22
large firms engaging in a broader scope of R&D activities produce a higher drug output than focused firms; showing that there is a positive correlation between economies of scope and productivity. However, there are some limitations towards this study. Even though the authors use very detailed data, the sample is composed of only 10 firms, which is troublesome when attempting to generalize the results. The famous merger between Pfizer and Warner-Lambert, Inc. allowed Pfizer to broaden its product lines with products including Listerine mouthwash and Wilkinson Sword shaving products (Rajesh Kumar, 2012), and its R&D focus into new areas such as oncology and ophthalmology. In addition, Pfizer managed to obtain full ownership of Lipitor (a blockbuster cholesterol drug) that went on to become the best-selling drug in the world with sales exceeding US$5 billion. However, Grabowski and Kyle (2012) argue that a point has been reached where the effect of diminishing returns may start to be noticed because both the benefits from economies of scale and scope become cancelled out. The increased bureaucracy and the various challenges arising from motivating large teams of individuals to foster their creativity may not be worth the increased breadth in R&D research.
Thirdly, pharmaceutical companies may turn to mergers and acquisitions to gain access to the source of new products in high-growth therapeutic areas. The process of producing and commercializing drugs consists mainly of three stages: drug discovery, development and commercialization. The drug discovery phase is composed of two sub-phases: basic research and preclinical research and development, which on average take around 6 years (DiMasi et al., 2003; Lin, 2009). Thus, to accelerate entry into new therapeutic areas and to avoid drug development processes that may be unsuccessful, large pharmaceutical companies (Big Pharma) tend to establish alliances and/or merge with smaller research-based firms to access their new technologies. An example of this situation occurred when Hoffman-LaRoche acquired part of Genentech in 1990
23
to gain access to their products which Hoffman-LaRoche believed were innovative and had great potential (Rajesh Kumar, 2012). Finally, companies may wish to engage in M&As as a result of ageing product pipelines and patent expiration issues, but this shall be explored further below.
Moreover, mergers tend to have the ultimate goal of cost-cutting and slimming drug pipeline portfolios and when a merger actually goes through, the R&D portfolios of both firms are examined in order to “eliminate those they see as ‘duplicative’” (Comanor and Scherer, 2013, p. 110). Having said this, if firms decide to collaborate in cooperative agreements before immediately engaging in a merger or acquisition, the likelihood of pursuing new drugs will be lower because larger firms tend to be more risk averse. This may be due to regulators having become more risk averse over time (DiMasi et al., 2016).
2.4 Pipelines, patents, NME costs
Various studies have been carried out regarding research and development costs of new drugs and biologics in the pharmaceutical industry. These studies look at the value of the resources used to discover and develop new compounds by focussing on the overall probability of clinical success of the different phases of the NME creation process. One possible explanation for the formation of alliances between firms in the pharmaceutical industry has to do with the ever-increasing R&D cost of developing new molecules. When observing a period between 1983-1994, DiMasi et al. (2003) obtained an out-of-pocket R&D cost estimate of US$1.04 billion (adjusted to 2013 dollars). In the latest report, DiMasi and Grabowski (2016) estimated the cost to be of around US$2.5 billion. This large increase in R&D costs (166% increase) can be explained by the different time periods studied by each paper. Whereas the first study involved NME approvals
24
in the 1990s, the latest study focussed on NME approvals in 2000s and 2010s. Subsequently, not many companies have enough resources to develop such expensive drugs by themselves, nor do they have the required marketing skills to promote and introduce these newly developed drugs into the everyday medical use (Comanor and Scherer, 2013). Therefore, firms tend to look for collaboration opportunities with other firms to finance and operate testing procedures prior to approval by regulatory authorities. These collaboration opportunities are usually in the form of licensing agreements, joint ventures or R&D alliances with smaller firms, usually small “biotech” companies or universities with their own research centres. If the partnership is seen as being successful, the larger pharmaceutical firm tends to acquire the smaller company. Consistent with literature, this increasing cost of R&D is reflected by a change in the industry environment and its trends, due to growing alliances between firms, enhanced power of buyers, major hubs shifting to hotspots, increased regulation, looming patent cliffs, as well as tailored pipelines (Munos, 2009; Gautam and Pan, 2016).
Patent expiration plays a crucial role in the decision of whether or not a company should engage in an M&A; when a patent expires, revenues tend to decrease drastically (Rajesh Kumar, 2012). As an example, Prozac, an anti-depressant drug discovered by Eli Lilly and Co., suffered a decrease in sales of around 22% the year after it came off patent and generics were introduced in the market. There are two main types of patent protections for pharmaceutical firms. The first type is the normal, generic patent which is granted by the United States Patent and Trademark Office (USPTO) (Higgins and Rodriguez, 2006) and the second type of protection is granted by the Food and Drug Administration (FDA) and is mostly known as exclusivity. However, the creation of the Hatch-Waxman Act of 1984 allowed generic drug manufacturers to obtain marketing approval by the FDA as long as they could prove that their drug had bioequivalence to
25
original product. Following the passage of this Act, competition from generic manufacturers thrived in such a way that, in 1984, 19% of US prescriptions were in the form of generic drugs and in 2013 these accounted for 86% of the market (Grabowski et al., 2015). It was also expected that due to losses in market exclusivity, around US$140 billion would be lost in 2013 (Rajesh Kumar, 2012).
Looking back at the trend of diminishing returns that was mentioned earlier, the various merger waves that occurred throughout the last 30 years contributed to firms becoming bloated with manufacturing facilities, R&D laboratories and bureaucratic complexities spread around various places in the world. In addition, whenever a merger or acquisition involved a company in a foreign country, an added layer of complexity regarding cultural integration had to be considered. Consequently, a trend that big pharmaceutical companies began to adopt was that of becoming lean and focussed by “divesting non-core assets and focussing on areas of strength” (Gautam and Pan, 2016, p. 380). For example, in an effort to become more streamlined and focussed, Abbott decided to split into two separate companies in 2013: AbbVie became responsible for the innovative pharma business, whilst Abbott focussed on diversified healthcare products. Similarly, an unintended, or at least unforeseen consequence of the race towards economies of scale and scope was that multiple research hubs became dispersed across the world. For example, AstraZeneca had over ten R&D laboratories in countries such as the USA, UK, Sweden and Canada. Thus, since 2005, most Big Pharma organisations shifted their strategies by consolidating their R&D sites within innovation clusters in San Francisco, London and Shanghai. The main advantages of this strategy are the increase in access to external innovation through alliances, easier collaboration with universities and scientists, as well as providing a more collaborative environment.
26
2.5 Declining R&D productivity
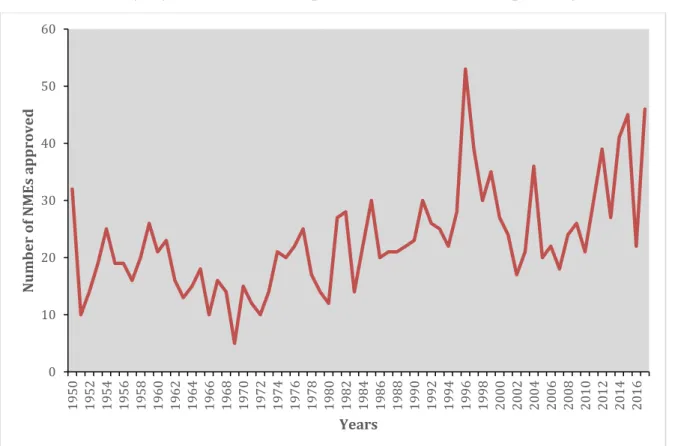
Moore’s Law – considered by many as the golden rule in the electronics industry – states that the number of transistors that can be placed onto an integrated circuit should double every two years. Over the years, this concept has been applied generally in the technology industry and has usually proved accurate due to the innovation and continuous improvement of this sector. Scannell et al. (2012) came up with a term to describe the opposite effect to that of Moore’s Law. Eroom’s Law is the name chosen to characterize the following trend. In their article, they found that the number of new FDA-approved drugs has “halved every 9 years, since 1950”, per billion USD of R&D spending.
Figure 1 - Approval timeline for new molecular entities (NMEs)
Since 1950, around 1500 NME’s have been approved by the FDA, which amounts to an average of 23 new drug approvals per year. As seen in Figure 1, the rate of approval has remained relatively constant until 1990, followed by a
0 10 20 30 40 50 60 19 50 19 52 19 54 19 56 19 58 19 60 19 62 19 64 19 66 19 68 19 70 19 72 19 74 19 76 19 78 19 80 19 82 19 84 19 86 19 88 19 90 19 92 19 94 19 96 19 98 20 00 20 02 20 04 20 06 20 08 20 10 20 12 20 14 20 16 N u mbe r of N M Es a p p ro ve d Years
27
large spike in 1996 due to the approval of the Prescription Drug User Fee Act (PDUFA). This law was created in 1992 to authorize the FDA to “collect fees from companies that produce certain human drug and biological products” (FDA, 2018, (4)). In addition, Munos (2009) postulates that the spike in 1996 was in part a consequence of this Act since user fees helped to speed up drug approval processes. From 1996 until today, the rate of drug approval has returned to its historical average.
The productivity crisis, namely, the R&D productivity crisis in the pharmaceutical industry has been a popular topic in research papers and opinion articles (Danzon et al., 2007; Munos, 2009; Pammolli et al., 2011; Scannell et al., 2012; Schuhmacher et al., 2016; Ringel and Choy, 2017). Even though the cost of developing NMEs as well as R&D expenditures have been consistently increasing, the rate of NME approval has stayed mostly constant. Thus, if the annual drug output of pharmaceutical firms has been constant for the better part of the last 50 years, and assuming they have been actively trying to improve these levels of performance, it is quite unlikely that there will be radical change (Munos, 2009). Consequently, firms have been resorting to merging with and acquiring smaller firms in hope that they can increase NME output.
When measuring R&D productivity, NMEs are usually one of the elements used because they are a good representation of the firms’ outputs. R&D productivity is usually measured as a ratio of inputs to outputs, however, quantifying what and how many inputs can produce a certain amount of outputs is very dubious, especially in the pharmaceutical industry (Pammolli et al., 2011). Moreover, there is a high degree of uncertainty between the expenditure that is undertaken today to ensure future returns (Hall and Mairesse, 2009). For example, if the production of a drug is a product of an alliance between five firms and two universities, coming up with a number that can quantify the inputs invested may turn out to be a daunting task.
28
2.6 Similar literature
When studying strategic alliances between US and Japanese firms, Hurry (1993) recognizes that the steps taken by firms in the integration process from cooperation to acquisition entails some advantages since it allows time for firms to learn about each other. The author finds a positive link for acquisitions between firms in the same therapeutic category in that they generate higher average abnormal returns (5.08%) when compared to acquisitions within different therapeutic areas (3.24%).
A study by Danzon et al. (2005) shows that smaller firms have actually helped in the development of new drugs by licensing these drugs to larger pharma companies. These large firms then carry the drugs through the various procedures until they are ultimately approved by the regulatory authorities. In addition, they find that “drugs developed in alliances are more likely to succeed in clinical trials” (2005, p. 319) and that large firms experience higher rates of success for licenced compounds when compared to compounds that are developed in-house. However, their study is faced with a key limitation, in that data is insufficient to analyse alliance formation.
Higgins and Rodriguez (2006) find that if the acquiring firm can have access to more information during the pre-acquisition period, this will lead to greater probability of success of the R&D alliance. There is vast literature supporting the idea that bidding firms tend to overpay for their target when engaging in an acquisition and that its shareholders gain little value (Dodd, 1980; Asquith, 1983; Andrade et al., 2001). This becomes more evident for firms that possess many intangible assets, as they can be tough to value. Thus, Higgins and Rodriguez (2006) posit that forming pre-acquisition alliances may help in reducing this information asymmetry since firms will have more time to gather information before eventually merging or acquiring. In fact, for the cases in which the
29
acquiring company had engaged in an alliance before the acquisition, average abnormal returns amounted to 4.30%, whereas in the cases where an acquisition took place without previous cooperation between the two firms, the returns were of 3.36%. A possible reason for this effect has to do with the importance of the pre-acquisition phase in the overall M&A process. This phase is crucial due to the information that can be learnt and shared between the two companies and its staff, namely, information from relevant departments such as, human resources, financial, IT, tax and legal. In addition, strategic alliances may be used as a tool to evaluate the environment where the firms are conducting business in (Hagedoorn et al., 1999). The authors of this study found little evidence to support their hypothesis about strategic technology alliances acting as an originator to the formation of M&As; in fact, only 2.60% of the strategic technology alliances studied could be linked to a merger or acquisition.
Arora et al. (2007) use a sample of around 3000 drug-related R&D projects in the US between the years of 1980 and 1994 to “compare the innovation performance of pharmaceutical and biotech companies” and look at the role that licencing and alliances play in these projects. Arora et al. (2007) and Danzon et al. (2005) have complementary views regarding alliances as both studies find positive effects associated with alliances.
Siebert et al. (2017) found that the number of R&D projects as well as the number of drugs that are launched onto the product market increase if R&D partnerships are established in the beginning of the drug development process, and they attribute this to the effect of economies of scale. Conversely, in the cases where these collaboration partnerships are established in later drug development stages, the number of drugs that are launched on the market is significantly reduced. These results show that when firms collaborate in advance and without time constraints, they are able to rethink their drug pipeline portfolio to avoid overlap of similar R&D efforts and thus avoid destroying future sales.
30
A similar study to this one is performed by Meschi, Metais and Shimizu (2017) on the acquisition by French firms in the US, where the duration of the pre-acquisition alliance is investigated as to whether having a beneficial ou harmful impact on the performance of an ensuing acquisiton. In addition, the authors study how alliance duration affects different types of alliances, including joint ventures, minority investments and non-equity collaborations. The argument put forth by these authors is that decisions that are taken to merge or acquire a firm during an early-stage of an alliance are biased by “honeymoon effects” and possible red flags are often overlooked. Their findings show that when joint ventures and minority investments have a duration between seven and eight years, they demonstrate a high probability of acquisition failure. Another interesting finding is that this probability of acquisition failure increases with alliance duration as it surpasses seven years.
31
Chapter 3
3. Data and Methodology
3.1 Data
3.1.1 Data processing
To obtain the necessary information for this investigation, data about both mergers and acquisitions and alliance activity between firms in the pharmaceutical sector was required. However, most databases (the ones that were accessible) either include information about M&As or about R&D alliances; no database was able to provide information about both. Therefore, a merger of the two databases would be needed to come up with a complete database that enables comparison and cross-referencing between them to run empirical testing and obtain results.
This study relies solely on secondary data which was obtained from two different databases. To obtain the M&A deals data, Thomson Reuters database was used via the Deal Screener productivity tool. This tool allows for the customization of search queries to select the most relevant data needed where some filters/criteria may be selected. Firstly, only deals under the completed category were selected, indicating the deals for which the transaction has closed. Secondly, the deal forms selected were the following: acquisition, merger, and acquisition of majority interest. This last category was chosen because it represents the situations in which the acquirer held less than 50% of the target company’s stock before the deal and is seeking to acquire 50% or more (but less than 100%). No restrictions were placed on deal value since the sample should capture all deals regardless of size. In addition, to ensure that only firms
32
operating in the pharmaceutical sector were represented in the data, companies were selected based on their Standard Industrial Classification (SIC) codes. Following Danzon et al. (2007) and Higgins & Rodriguez (2006) search method, this range of SIC codes cover the pharmaceutical industry: 2833-2836. Thus, the transactions between companies with the aforementioned SIC codes were selected for the M&A database. Moreover, to maximise the probability of finding financial company information online, deals were selected if the target and acquiring firm were both public. Finally, the sample was restricted to transactions that occurred between 01/01/1981 and 01/07/2018 to match with the R&D database which shall be explained below. In all, the M&A sample was left with a universe of 635 deals.
Regarding the R&D alliance information, OVID’s IMS Health (R&D Focus) database was used to obtain all data. This database contains (n = 7064) observations, each representing a specific molecule for which an R&D collaboration alliance occurred. Anatomical Therapeutic Chemical (ATC) codes are used to indicate which therapeutic area(s) each molecule targets. Using ATC codes as a classification method proves useful because besides being the standard classification method, it is tightly controlled by the World Health Organization (WHO), and it is usually how competition authorities define the market. In addition, for each observation there is an indication of the beginning and end dates of the R&D alliances, their duration, and which firms participated in the collaboration. The number of collaborating firms ranges from 2 to 23. In this database, information on R&D processes is available from 01/01/1981 up until 01/01/2011. However, the synergies gained throughout the alliance process may not lead to a merger or an acquisition by one of the collaborating firms immediately after the process is terminated, therefore all M&As occurring post-2011 were also selected to take part in the database.
33
Once the two databases were ready, they had to be merged to see whether any firms that have had a history of collaboration engaged in a subsequent merger or acquisition. To carry out this process, firms from the alliance database had to be divided into pairs to ‘match’ with the pairs of firms in the M&A database during the merger procedure. For example, if companies A, B, C, D collaborated to produce drug X, the possible collaboration pairs would have to be: AB, AC, AD, BC, BD, CD. This ‘pairing’ process was carried out using VBA in Microsoft Excel until all R&D processes were represented by pairs of companies. Unfortunately, firm names in each database were not the same - some firm names were abbreviated -, most likely because they originated from different sources, which made the merging process slightly more complex. Nevertheless, the Fuzzy Lookup Tool1, a Microsoft Excel add-in, was used to find similar matches
between firm names of both databases and produce an output table with a similarity probability index. Even though this tool did not provide a perfect merger between names, it definitely sped up the process and eliminated the need to go through each name individually hoping to find a match. Thus, only an overview check was required to see whether the matches were in fact correct. Unfortunately, a margin of human error throughout this process is inevitable since it is an individual and manual procedure.
1https://www.microsoft.com/en-us/download/details.aspx?id=15011 (Fuzzy Lookup Excel Add-in; Accessed on
34
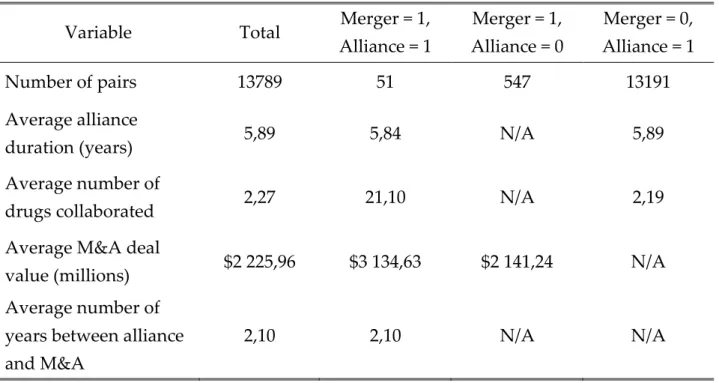
3.1.1 Preliminary data
Variable Total Merger = 1,
Alliance = 1 Merger = 1, Alliance = 0 Merger = 0, Alliance = 1 Number of pairs 13789 51 547 13191 Average alliance
duration (years) 5,89 5,84 N/A 5,89
Average number of
drugs collaborated 2,27 21,10 N/A 2,19
Average M&A deal
value (millions) $2 225,96 $3 134,63 $2 141,24 N/A
Average number of years between alliance and M&A
2,10 2,10 N/A N/A
Table 1 - Summary statistics
The data in Table 1 shows some early preliminary statistics gathered from the merged database prior to performing any regressions. The first impression that can be noticed from this table is that the number of observations for the pairs of firms that engaged in an alliance followed by a merger is quite small (51 observations). However, a large difference is found when looking at the average number of drugs that firms collaborated on. In a regular alliance, more specifically in the situations where an alliance does not lead to a future merger between firms, the number of drugs that firms collaborate on is on average 2. Conversely, in alliances that led to a future merger, the number of drugs collaborated increases to 21! This is an extremely interesting result because it may suggest that a ‘stronger’ alliance, where more collaboration ensues and where firms get to work more with each other may lead to a future merger or acquisition by one of the parts. In addition, the deal value of an M&A is on average US$1 million higher for firms that have engaged in an alliance with each other before the merger. Whilst this tendency may be explained by the idea that alliances can
35
help reduce information asymmetry that is usually present in M&A processes, supporting Higgins and Rodriguez’s (2006) theory, without further control variables this statement becomes quite inconclusive.
A clear trend can be seen throughout the years regarding the value of M&A deals when looking at Figure 2. Even though M&A activity was already prevalent during the 1980s and 1990s, it was not until 1998 that deal values exponentially increased to amounts that were higher than ever before. To better illustrate this point, until 1997 an M&A transaction had on average a value of US$6 billion; whereas from 1998 until 2017 (latest data), this value increased to around US$62 billion. This massive increase in deal value can be attributed to large pharmaceutical firms experiencing expiring patents which allows for an influx of competition. In turn, these firms may decide to overhaul their research and development pipelines by acquiring potential targets. Thus, it comes as no surprise that 2018 has been the year in which the pharmaceutical sector has experienced its strongest start in M&A in more than a decade (The Financial Times, 2018). By observing Figure 2, the major merger waves of the
0 20 40 60 80 100 120 140 160 19 81 19 82 19 83 19 85 19 86 19 87 19 88 19 89 19 90 19 91 19 92 19 93 19 94 19 95 19 96 19 97 19 98 19 99 20 00 20 01 20 02 20 03 20 04 20 05 20 06 20 07 20 08 20 09 20 10 20 11 20 12 20 13 20 14 20 15 20 16 20 17 M& A d ea l va lu e (bil lio n $) Years Figure 2 - Volume of M&A deals (1981-2017)
36
pharmaceutical industry can easily be spotted, and coincidentally, each wave is characterized by a higher average deal value than the previous one. The first wave can be seen around 1999, where deal values surpassed US$100 billion for the first time and was mainly amplified by Pfizer’s acquisition of Warner-Lambert Co. by US$90 billion along with the merger of Glaxo Wellcome and SmithKline Beecham for US$76 billion. Subsequently, the second wave took place around 2009 with M&A deal volumes reaching US$120 billion, with deals such as Pfizer’s acquisition of Wyeth for US$68 billion. Finally, the third merger wave occurred around 2014 with deal volumes surpassing US$150 billion, with Actavis’ acquisition of Allergan being the most expensive one during this wave with a value of US$68 billion.
The information present in Figure 3 is particularly useful since it provides a comparison between the value of the M&A deals that occurred after two firms collaborated on the development of a drug and of those firms who had no history
0 20 40 60 80 100 120 140 160 0 10 20 30 40 50 60 19 81 19 82 19 83 19 85 19 86 19 87 19 88 19 89 19 90 19 91 19 92 19 93 19 94 19 95 19 96 19 97 19 98 19 99 20 00 20 01 20 02 20 03 20 04 20 05 20 06 20 07 20 08 20 09 20 10 20 11 20 12 20 13 20 14 20 15 20 16 20 17 M& A d ea l va lu e wi th no p revio u s al lia nce (bil lio n $) M& A d ea l va lu e wi th p revio u s al lia nce (bil lio n $) Years
M&A deal volume in pharmaceutical sector (1981-2017)
M&A with previous alliance M&A with no previous alliance
37
of collaboration with each other. However, it also allows to see if these two types of M&As occur during identical time periods. If they do, then we can say that mergers are simply linked to the merger waves previously explained; but if not, then it is possible that the merger or acquisition is connected to the alliance and not solely to the merger wave. From the information present in Figure 3 there seems to be a somewhat negative correlation between deal values of M&As with and without previous alliances throughout the years. Namely, between 2007 to 2010 this pattern is evident because 2008 and 2010 are the years with the highest deal values of M&As with a previous alliance and, simultaneously, deal values for M&A with no previous alliance are found to be remarkably low. The opposite however, can be seen in 2009, with a high deal value for M&As with no previous alliance and very low deal values for M&As with previous collaboration. Consequently, a quick examination of this trend supports the idea that these M&As are increasingly linked to the previous alliance established between the firms rather than the merger wave itself.
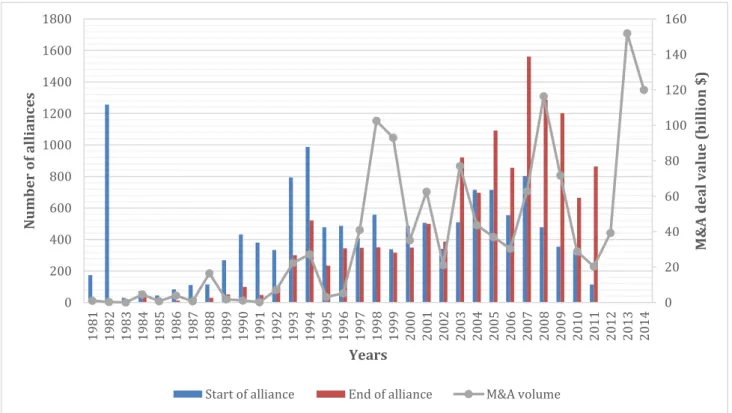
0 20 40 60 80 100 120 140 160 0 200 400 600 800 1000 1200 1400 1600 1800 19 81 19 82 19 83 19 84 19 85 19 86 19 87 19 88 19 89 19 90 19 91 19 92 19 93 19 94 19 95 19 96 19 97 19 98 19 99 20 00 20 01 20 02 20 03 20 04 20 05 20 06 20 07 20 08 20 09 20 10 20 11 20 12 20 13 20 14 M& A d ea l va lu e (bil lio n $) N u mber of a ll ia nces Years
Start of alliance End of alliance M&A volume
38
Figure 4 graphs a comparison between number of alliances established, number of alliances terminated and M&A activity per year between 1981 and 2014. Even though alliance data is only available until 2011, M&A data until 2014 was included since the decision to acquire or merge with another firm may not be done immediately after the alliance is ended. The main patterns that can be perceived in Figure 4 somewhat corroborate the idea that alliances act as a precursor for a future merger or acquisition. Firstly, when looking at the data from 2003 it is clear that a large number (~900) of alliances were ended that year, and at the same time M&A activity intensified. A similar trend happens between 2007-2009, where a record number of alliances are ended during those years and M&A activity is also quite prevalent. However, according to the data in Erro! A
origem da referência não foi encontrada., the average time period between the
end of an alliance and a future M&A is of around 2 years. By taking this into consideration and looking at Figure 4 once again, the large peak in M&A activity in 2013 may be a (somewhat delayed) result of the large number of alliances that ended during the previous years. Moreover, around 1998 (the first big merger wave of the pharmaceutical industry) M&A activity was becoming quite intense, which, following the same line of thought as above may indicate that this could have been the outcome of all collaborative alliances that were ended throughout the preceding years.
39
Chapter 4
3.2 Methodology
3.2.1 Dependent variable
Research and development productivity
The dependent variable for this study must be one which measures the performance of a company but also captures the particularities of operating in the pharmaceutical sector. Measuring R&D productivity is seen by many researchers as a tricky matter to quantify (Pappas and Remer, 1985; Hannon et
al., 2015) because it is usually calculated using a ratio of inputs to outputs.
Looking at the pharma industry, inputs can easily be measured by seeing how much each company spends in R&D each year, however, the outputs are usually intangible and tough to quantify as a number. For this reason, a simplistic approach towards a productivity ratio based on R&D was selected. This ratio is calculated by dividing the net sales of the acquirer in the acquisition year and the R&D expenditure of the acquirer four years before the acquisition takes place. Since these values represent a function of the historical contribution of pharmaceutical companies towards R&D, the ratio was calculated with a time lag of four years (Schulze et al., 2014). A time period of four years was selected because most recent studies have pointed out that overall development time for a new drug (Phase I-III) to be on average eight years (Mc Namara and Baden-Fuller, 2007; Mestre-Ferrandiz et al., 2012; Schulze et al., 2014; PHRMA, 2015). In addition, the future benefits that may arise from current R&D investments are subject to time lags and therefore become hard to accurately measure. Having
40
said this, an alternative measure of R&D productivity is also used to understand to what extent the end results are influenced by the way this variable is calculated. The two simple measures of R&D productivity are shown below:
𝑹𝑫𝑷𝒓𝒐𝒅𝒕,𝒊𝑺 = 𝑆𝑡,𝑖
𝑅𝐷𝑒𝑥𝑝𝑡−4,𝑖 (1.1)
𝑹𝑫𝑷𝒓𝒐𝒅𝒕,𝒊𝑹 = 𝑅𝑡,𝑖
𝑅𝐷𝑒𝑥𝑝𝑡,𝑖 (1.2)
𝑹𝑫𝑷𝒓𝒐𝒅𝒕,𝒊 represents R&D productivity in year t for firm i
𝑺𝒕,𝒊 represents net sales in year t for firm i
𝑹𝑫𝒆𝒙𝒑𝒕−𝟒,𝒊 represents R&D expenditure in year t-4 for firm i
𝑹𝒕,𝒊 represents returns to shareholders in year t for firm i
3.2.2 Independent variable
Previous alliance
The chosen independent variable for this study is a dummy variable that takes the value of 1 if there has been a previous alliance between the acquirer and target firm. If more than one alliance has been established between the two firms, the dummy variable takes on the value of 1. To control for these cases where the number of alliances is higher than 1, some control variables have been selected and will be explained in greater detail below. Data regarding alliances comes solely from the R&D alliance database.
41
3.2.3 Control variables
Change in debt to equity
The change in debt to equity is measured as the difference between the debt to shareholder’s equity (D/E) ratio of the acquirer two years after the acquisition (t+2) and the D/E ratio of the acquirer one year before the acquisition takes place (t-1), and is divided by the D/E ratio one year before the acquisition (t-1). Porrini (2004) states that firms engaging in acquisitions (acquirers) tend to see their levels of debt increase after acquisitions take place. Since an increased amount of debt may influence how much a firm spends in R&D, I decided to control for this.
𝐷 / 𝐸 =𝐷𝑒𝑏𝑡 𝑡𝑜 𝑠ℎ𝑎𝑟𝑒ℎ𝑜𝑙𝑑𝑒𝑟 𝑒𝑞𝑢𝑖𝑡𝑦𝑡+2
𝐴𝑄 − 𝐷𝑒𝑏𝑡 𝑡𝑜 𝑠ℎ𝑎𝑟𝑒ℎ𝑜𝑙𝑑𝑒𝑟 𝑒𝑞𝑢𝑖𝑡𝑦 𝑡−1𝐴𝑄
𝐷𝑒𝑏𝑡 𝑡𝑜 𝑠ℎ𝑎𝑟𝑒ℎ𝑜𝑙𝑑𝑒𝑟 𝑒𝑞𝑢𝑖𝑡𝑦𝑡−1𝐴𝑄 (1.3)
ROA
This variable was selected to capture the change in ROA of the acquiring and target firm one year prior to the acquisition and two years after it occurred. It is measured as the difference between the ROA of the acquirer two years after the acquisition (t+2) and the weighted ROA of the acquirer and target one year before the acquisition takes place (t-1), divided by the weighted ROA of the acquirer and target one year prior to acquisition (t-1). Several researchers have used ROA as a measure of M&A performance (Meeks and Meeks, 1981; Harrison et al., 1991; Hitt et al., 1998; Papadakis and Thanos, 2010). Meeks and Meeks (1981) find that selecting return on assets as an indicator of pre and post-merger indicator is recommended because other indicators are more subject to potential biases.
𝑅𝑒𝑡𝑢𝑟𝑛 𝑜𝑛 𝑎𝑠𝑠𝑒𝑡𝑠 =𝑅𝑂𝐴𝑡+2
𝐴𝑄 − 𝑅𝑂𝐴 𝑡−1 𝐴𝑄/𝑇
42
Cross border
This is a variable that takes the value of 1 if the target firm is located in a different geographic region (i.e. country) than the acquiring firm and 0 if both companies operate within the same country.
Alliance duration
This variable (measured in years) measures the duration of the alliance established between two companies. It is calculated from the formation date until its date of termination, and for the companies that engaged in more than one alliance, an average duration of the alliances is computed.
Number of drugs collaborated
Similar to the previous variable, this variable measures the number of drugs that pairs of firms have collaborated on.
Finally, in a paper by Hou, Xue and Zhang (2015), the authors find that using a q-factor model which includes “a market factor, a size factor, an investment factor, and a profitability factor” is superior in capturing significant anomalies than using the Fama-French model. Thus, following (Lee, 2016), the following variables which represent important financial factors were selected to control for M&A activity: market capitalization, net income and return on invested capital.
43
3.2.4 Regressions
Having mentioned the independent, dependent and control variables that shall be used, the chosen regressions will be divided into two groups with four regressions each, yielding a total of eight regressions. The first group will feature the dummy variable “Previous alliance” as independent variable, whereas the second group will lose this variable in exchange for “Alliance duration” and “Number of drugs collaborated”. The reasoning behind this decision shall be explained below.
Equations 1.5 and 1.6 aim to show the effect of a previous alliance between two firms on the R&D productivity of the merged firm. Whereas equation 1.5 measures R&D productivity based on sales, equation 1.6 uses returns to shareholders. 𝑹𝑫𝑷𝒓𝒐𝒅𝒕,𝒊𝑺 = 𝜷 𝟎+ 𝜷𝟏𝑨𝑳𝑳𝒕,𝒊+ 𝜷𝟐𝑫𝑬𝒕,𝒊+ 𝜷𝟑𝑹𝑶𝑨𝒕,𝒊+ 𝜷𝟒𝑪𝑩𝒊+ 𝜷𝟓𝑵𝑰𝒕,𝒊 + 𝜷𝟔𝑴𝑪𝒕,𝒊+ 𝜷𝟕𝑹𝑶𝑰𝑪𝒕,𝒊+ 𝜺𝒊,𝒕 (1.5) 𝑹𝑫𝑷𝒓𝒐𝒅𝒕,𝒊𝑹 = 𝜷 𝟎+ 𝜷𝟏𝑨𝑳𝑳𝒕,𝒊+ 𝜷𝟐𝑫𝑬𝒕,𝒊+ 𝜷𝟑𝑹𝑶𝑨𝒕,𝒊+ 𝜷𝟒𝑪𝑩𝒊+ 𝜷𝟓𝑵𝑰𝒕,𝒊 + 𝜷𝟔𝑴𝑪𝒕,𝒊+ 𝜷𝟕𝑹𝑶𝑰𝑪𝒕,𝒊+ 𝜺𝒊,𝒕 (1.6)
𝑨𝑳𝑳𝒕,𝒊 represents a dummy variable that takes the value 1 if there has been a
previous alliance between the acquirer and target firm
𝑫𝑬𝒕,𝒊 represents the change in debt to equity for firm i in year t
𝑹𝑶𝑨𝒕,𝒊 represents the change in ROA for firm i in year t
𝑪𝑩𝒕,𝒊 represents a dummy variable that takes the value of 1 if the target firm is
located in a different geographic region (i.e. country) than the acquiring firm 𝑵𝑰𝒕,𝒊 represents the year end net income for firm i in year t
𝑴𝑪𝒕,𝒊 represents the year end market capitalization for firm i in year t
44
Equations 1.7 and 1.8 are identical to the ones above but these include year-fixed effects. Year-year-fixed effects were added as separate regressions to control for possible variations in the outcome that could happen over the years and that cannot be explained by any of the other explanatory variables.
𝑹𝑫𝑷𝒓𝒐𝒅𝒕,𝒊𝑺 = 𝜷
𝟎+ 𝜷𝟏𝑨𝑳𝑳𝒕,𝒊+ 𝜷𝟐𝑫𝑬𝒕,𝒊+ 𝜷𝟑𝑹𝑶𝑨𝒕,𝒊+ 𝜷𝟒𝑪𝑩𝒊+ 𝜷𝟓𝑵𝑰𝒕,𝒊
+ 𝜷𝟔𝑴𝑪𝒕,𝒊+ 𝜷𝟕𝑹𝑶𝑰𝑪𝒕,𝒊+ 𝜷𝟖𝑭𝑬𝒕+ 𝜺𝒊,𝒕 (1.7) 𝑹𝑫𝑷𝒓𝒐𝒅𝒕,𝒊𝑹 = 𝜷𝟎+ 𝜷𝟏𝑨𝑳𝑳𝒕,𝒊+ 𝜷𝟐𝑫𝑬𝒕,𝒊+ 𝜷𝟑𝑹𝑶𝑨𝒕,𝒊+ 𝜷𝟒𝑪𝑩𝒊+ 𝜷𝟓𝑵𝑰𝒕,𝒊
+ 𝜷𝟔𝑴𝑪𝒕,𝒊+ 𝜷𝟕𝑹𝑶𝑰𝑪𝒕,𝒊+ 𝜷𝟖𝑭𝑬𝒕+ 𝜺𝒊,𝒕 (1.8) 𝑭𝑬𝒕 represent the year fixed effects for year t
The following four equations are part of the second group of regressions where the independent variable becomes “Alliance duration” (ALLYRS) and “Number of drugs collaborated” (DRUGS). Since these two variables reflect particular characteristics of alliances, the inclusion of these variables in the regression may make it possible to narrow down what are the main factors within an alliance that affect R&D productivity. More specifically, this will help understand if the effect (whether it be positive or negative) of a previous alliance on R&D productivity is related to the number of years that the alliance lasted for or to the number of individual drugs that firms collaborated on. Therefore, Equations 1.9 and 1.10 aim to show the effect of these two variables on R&D productivity. 𝑹𝑫𝑷𝒓𝒐𝒅𝒕,𝒊𝑺 = 𝜷𝟎+ 𝜷𝟏𝑨𝑳𝑳𝒀𝑹𝑺𝒊+ 𝜷𝟐𝑫𝑹𝑼𝑮𝑺𝒊+ 𝜷𝟑𝑫𝑬𝒕,𝒊+ 𝜷𝟒𝑹𝑶𝑨𝒕,𝒊 + 𝜷𝟓𝑪𝑩𝒊+ 𝜷𝟔𝑵𝑰𝒕,𝒊+ 𝜷𝟕𝑴𝑪𝒕,𝒊+ 𝜷𝟖𝑹𝑶𝑰𝑪𝒕,𝒊+ 𝜺𝒊,𝒕 (1.9) 𝑹𝑫𝑷𝒓𝒐𝒅𝒕,𝒊𝑹 = 𝜷 𝟎+ 𝜷𝟏𝑨𝑳𝑳𝒀𝑹𝑺𝒊+ 𝜷𝟐𝑫𝑹𝑼𝑮𝑺𝒊+ 𝜷𝟑𝑫𝑬𝒕,𝒊+ 𝜷𝟒𝑹𝑶𝑨𝒕,𝒊 + 𝜷𝟓𝑪𝑩𝒊+ 𝜷𝟔𝑵𝑰𝒕,𝒊+ 𝜷𝟕𝑴𝑪𝒕,𝒊+ 𝜷𝟖𝑹𝑶𝑰𝑪𝒕,𝒊+ 𝜺𝒊,𝒕 (1.10) 𝑨𝑳𝑳𝒀𝑹𝑺𝒊 represents the duration of the alliance between a pair of firms i
45
Finally, equations 1.11 and 1.12 are identical to the ones above but with the inclusion of year-fixed effects.
𝑹𝑫𝑷𝒓𝒐𝒅𝒕,𝒊𝑺 = 𝜷 𝟎+ 𝜷𝟏𝑨𝑳𝑳𝒀𝑹𝑺𝒊+ 𝜷𝟐𝑫𝑹𝑼𝑮𝑺𝒊+ 𝜷𝟑𝑫𝑬𝒕,𝒊+ 𝜷𝟒𝑹𝑶𝑨𝒕,𝒊 + 𝜷𝟓𝑪𝑩𝒊+ 𝜷𝟔𝑵𝑰𝒕,𝒊+ 𝜷𝟕𝑴𝑪𝒕,𝒊+ 𝜷𝟖𝑹𝑶𝑰𝑪𝒕,𝒊+ 𝜷𝟗𝑭𝑬𝒕+ 𝜺𝒊,𝒕 (1.11) 𝑹𝑫𝑷𝒓𝒐𝒅𝒕,𝒊𝑹 = 𝜷𝟎+ 𝜷𝟏𝑨𝑳𝑳𝒀𝑹𝑺𝒊+ 𝜷𝟐𝑫𝑹𝑼𝑮𝑺𝒊+ 𝜷𝟑𝑫𝑬𝒕,𝒊+ 𝜷𝟒𝑹𝑶𝑨𝒕,𝒊 + 𝜷𝟓𝑪𝑩𝒊+ 𝜷𝟔𝑵𝑰𝒕,𝒊+ 𝜷𝟕𝑴𝑪𝒕,𝒊+ 𝜷𝟖𝑹𝑶𝑰𝑪𝒕,𝒊+ 𝜷𝟗𝑭𝑬𝒕+ 𝜺𝒊,𝒕 (1.12)
3.2.5 Summary Statistics
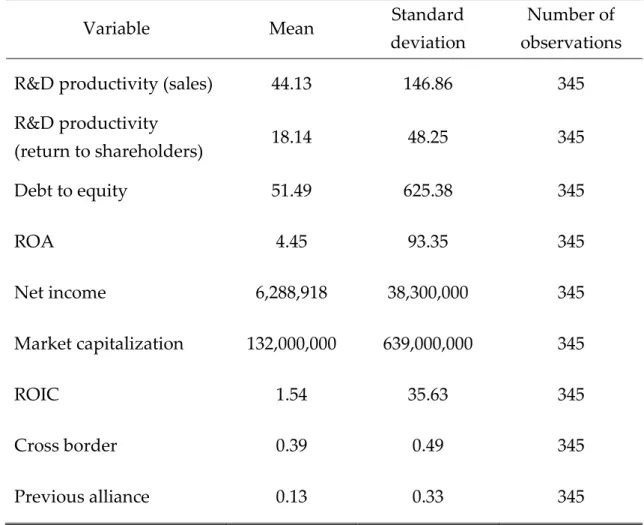
Variable Mean Standard
deviation
Number of observations R&D productivity (sales) 44.13 146.86 345 R&D productivity (return to shareholders) 18.14 48.25 345 Debt to equity 51.49 625.38 345 ROA 4.45 93.35 345 Net income 6,288,918 38,300,000 345 Market capitalization 132,000,000 639,000,000 345 ROIC 1.54 35.63 345 Cross border 0.39 0.49 345 Previous alliance 0.13 0.33 345
46
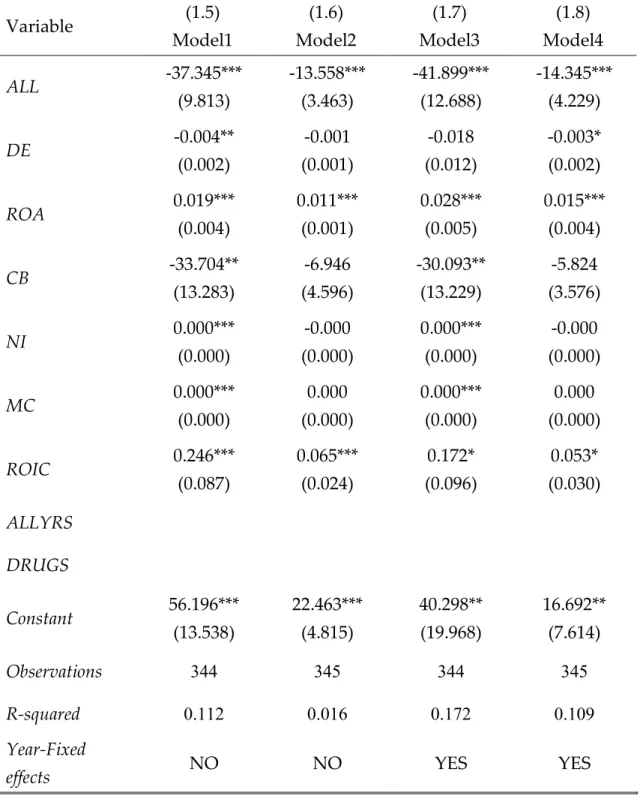
4. Results
Overall, eight regressions were performed to investigate the effect of a previous alliance between two organisations on the future R&D productivity of the merged company. The results from first set of regressions (equations 1.5 – 1.8) can be seen in Table 3 and the results from the second group of regressions (equations 1.9 – 1.12) are presented in Table 4. The first set of equations is investigating the effect of the existence of a previous alliance on the future R&D productivity of the firm, whereas the final group of equations introduces some more specific alliance characteristics to try to isolate where the effects are coming from. Regarding year-fixed effects (dummies), the results in Tables 3 and 4 include regressions both without year-fixed effects (equations 1.5 – 1.6; 1.9 – 1.10) and with year-fixed effects (1.7 – 1.8; 1.11 – 1.12). The inclusion of year dummies in the regressions was done to control for possible temporal effects that could happen over the years and that, at the same time, cannot be explained by any other variable. Even though they are included, year-fixed effects are not presented in the tables of results. Likewise, firm-fixed effects were initially included in the regressions, however, this led to the model becoming overfit and producing an R-squared value that was too high to be considered significant. In other words, too many terms were added in proportion to the number of observations available per firm, which led to the fixed effect ‘pulling’ towards itself all the explanation of the model instead of reflecting the data of the overall population. Therefore, firm-fixed effects were excluded from the regressions.
Before going into more detail about the values in the various models that were regressed, it may be compelling to look at Figure 5 and 6 which graphically demonstrate the relationship between R&D productivity and the number of years spent in an alliance. Figure 5 shows this relationship using R&D
47
productivity calculated using sales whilst Figure 6 uses R&D based on shareholder returns. In general, there appears to be a very slightly positive relationship in both situations between R&D productivity and alliance duration. In both cases data is mostly concentrated in the left half of the graph, indicating that the majority of alliances has a duration of less than ten years. However, the data present in Figure 6 follows the linear fit trendline much more closely than in Figure 5, which indicates that R&D Productivity based on shareholder returns is more correlated with alliance duration. Also, Figure 6 shows evidence that the added benefit of engaging in a longer-term alliance (+10 years) is poorly reflected on increased R&D productivity. This tendency is even more clear in Figure 5 where some alliances lasting 6 years lead to a higher R&D productivity than 20-year-old alliances. Whilst this may be an indication that there are other (more relevant) factors that can explain this relationship, there is also a possibility that there is an optimum amount of time that an alliance should last for that can benefit firms in reducing information asymmetry (Meschi et al., 2017), such as valuing intangible assets (i.e. workforce knowledge and skills) backing up the literature by Higgins and Rodriguez (2006).
Table 3 presents the regression results for each variable in the first four models presented (equations 1.5 – 1.8). In these four models, the dependent variable, previous alliance, presents a negative coefficient and is statistically significant (p < .01). Even though the coefficients are all negative, the two equations using R&D productivity based on sales (1.5 and 1.7) exhibit much higher values. Nevertheless, they are consistent with each other, thus, when all other variables are held constant, a previous alliance between two firms can have a negative impact on future R&D productivity. When looking at the control variables, only ROA and ROIC have positive coefficients through all four models, however, whereas ROA is statistically significant (p < .01) in the four models, for ROIC this is only the case in the models without year-fixed effects; when year-fixed effects