Association of FTO and PPARG polymorphisms
with obesity in Portuguese women
Fábio Ferreira Carlos1,2
José Silva-Nunes3,4
Orfeu Flores1
Miguel Brito3
Gonçalo Doria1
Luísa Veiga3
Pedro Viana Baptista1 1Centro de Investigação em Genética
Molecular Humana, Universidade Nova de Lisboa, Caparica, Portugal;
2Investigação e Serviços em Ciências
Biológicas, Stab Vida, Caparica, Portugal; 3Escola Superior de
Tecnologia da Saúde de Lisboa, Lisbon, Portugal; 4Endocrinology Department,
Curry Cabral Hospital, Lisbon, Portugal
Correspondence: Pedro Viana Baptista Centro de Investigação em Genética Molecular Humana, Faculdade de Ciências e Tecnologia, Universidade Nova de Lisboa, Campus de Caparica, Caparica 2829-516, Portugal
Tel/Fax +351 21 294 8530 Email [email protected]
Purpose: We evaluated the association between risk of obesity in the Portuguese population
and two related single-nucleotide gene polymorphisms: fat-mass and associated (FTO) rs9939609 and peroxisome proliferator-activated receptor gamma (PPARG) rs1801282.
Patients and methods: A total of 194 Portuguese premenopausal female Caucasians
aged between 18 and 50 years (95 with body mass index [BMI] $30 g/m2, 99 controls with BMI 18.5–24.9 kg/m2) participated in this study. The association of the single-nucleotide polymorphisms with obesity was determined by odds ratio calculation with 95% confidence intervals.
Results: Significant differences in allelic expression of FTO rs9939609 (P,0.05) were found
between control and case groups, indicating a 2.5-higher risk for obesity in the presence of both risk alleles when comparing the control group with the entire obese group. A fourfold-higher risk was found for subjects with class III obesity compared to those with classes I and II. No significant differences in BMI were found between the control and case groups for PPARG rs1801282 (P.0.05).
Conclusion: For the first time, a study involving an adult Portuguese population shows that
individuals harboring both risk alleles in the FTO gene locus are at higher risk for obesity, which is in agreement to what has been reported for other European populations.
Keywords: rs9939609, rs1801282, BMI, SNP, odds ratio
Introduction
Obesity prevalence has grown dramatically in recent decades and shows no signs of decline. According to the World Health Organization (WHO), it is estimated that 1.5 billion people are overweight, of which 500 million are obese.1 Obesity and
over-weight result from a combination of genetic background, environmental, and lifestyle factors, and are intrinsically associated with increased risk of associated disease, such as hypertension, dyslipidemia, and type 2 diabetes.2 Several gene-association
stud-ies have led to the identification of different loci (single nucleotide polymorphisms [SNPs]) that contribute to obesity and overweight.3 One of these SNPs, rs9939609, in
the fat-mass and obesity-associated (FTO) gene, has been described as a risk factor to obesity, and strongly associated with body mass index (BMI) increments in European adults.4 Frayling and colleagues4 demonstrated that the presence of the risk allele A is
cumulative and represent a 20% higher risk for the development of obesity and 13% for the development of overweight. This association was later confirmed by several other studies in different populations.5–7 Another gene playing an important role in
R A P I D C O M M U N I C AT I O N
open access to scientific and medical research Open Access Full Text Article
Number of times this article has been viewed
This article was published in the following Dove Press journal: Diabetes, Metabolic Syndrome and Obesity: Targets and Therapy 10 July 2013
obesity is peroxisome proliferator-activated receptor gamma (PPARG), which regulates the adipocyte differentiation, thus influencing BMI, as well as glucose metabolism.8 In
particular, SNP rs1801282 has been associated with obesity in different populations, with a clear identification of the risk allele G.9–11
To date, there are no data on the involvement of either of these SNPs in obesity in the adult Portuguese population, and whether the same pattern of risk alleles is present. Here, we report on the first association study between these SNPs and obesity for the adult Portuguese population, which can provide useful data for the clinical management and risk assessment of obesity.
Materials and methods
Subjects
All 194 subjects participating in the study were premeno-pausal Caucasian Portuguese females between 18 and 50 years old, duly informed about the study and having signed an informed consent.
As a control group were 99 healthy subjects showing a BMI ranging between 18.5 and 24.9 kg/m2 with body-weight
variation inferior to 10% in the last year. These subjects were either selected during a routine health check or belonged to the staff of Curry Cabral Hospital (Lisbon, Portugal).
The case group was composed of 95 subjects showing a BMI $30 kg/m2 with body-weight variation inferior to 10%
in the last year. These subjects were all attending the Endo-crinology Department of Curry Cabral Hospital.
Sample collection
Samples were collected from peripheral total blood and pre-served at −80°C. For analysis, 2 mL of blood was transferred to individual FTA (Whatman, Maidstone, UK) microcards, and DNA was purified according to the manufacturer’s protocol.
Polymorphism analysis
Polymerase chain reaction (PCR) amplifications were performed on a Biometra TGradient Thermocycler (Göt-tingen, Germany) in 25 µL final volume with Master Mix and DNA Surf Hot Taq Polymerase (10 U/µL) (Stab Vida, Lisbon, Portugal) with the following thermal cycling condi-tions: initial 15-minute denaturation at 96°C, followed by 30 amplification cycles of denaturation at 94°C for 1 minute, annealing at 59°C for 1 minute, elongation at 70°C for 1 min-ute, and a final elongation at 70°C for 5 minutes. Primers for PPARG locus (GenBank accession no NC_000003.11):
PPARG-F 5′-CAATTCAAGCCCAGTCCTTT-3′ and PPARG-R 5′-TTATCTCTGTGCATGGCTCC-3′. Primers for FTO locus (GenBank accession no NC_000016.9): FTO-F 5′-GCAAAATGGCAACACACACT-3′ and FTO-R 5′-AACACCATCCTTGGGCTG-3′.
SNP identification was performed via direct sequencing. Sequencing reactions were carried out with 100 ng/100 bp of the previously PCR-amplified product using Big Dye version 3.1 technology (Life Technologies, Carlsbad, CA, USA) in an Applied Biosystems 3730XL DNA analyzer.
Statistical analysis
To determine the normality of the continuous variables (age), Student’s t-test was used. To determine the differ-ences between genotype groups of each SNP and anthro-pometric traits, one-way analyses of variance and a post hoc Bonferroni test were used. All odds ratio (OR) analysis was performed using binary logistic regression with 95% confidence interval (CI) to determine the risk of each loci to obesity and the respective P-value. All statistical analyses were carried out using SPSS software version 20 (IBM, Armonk, NY, USA).
Results
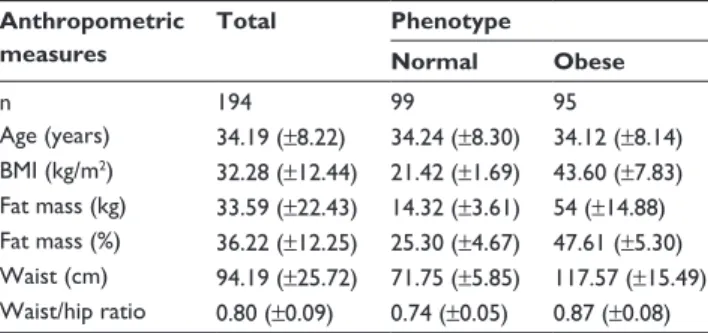
Table 1 presents the descriptive analyses of the subjects subdivided by their phenotype group. Figure 1 shows the population characterization by allele and genotype frequen-cies for FTO and PPARG SNPs. Significant differences (P,0.05) were found only among the different genotypes of
FTO rs9939609 for BMI, fat mass, and waist circumference.
No other anthropometric traits were statistically different for
FTO rs9939609 or PPARG rs1801282. Genotype
frequen-cies for FTO rs9939609 were 24.74% T/T, 56.70% A/T, and 18.56% A/A. When comparing case and control groups, no significant deviation from the Hardy–Weinberg equilibrium of allele frequencies was observed for this locus (P=0.053), with a majority of individuals being heterozygous (A/T). Data showed that the T allele is more frequent in subjects with BMI values between 18.5 and 24.9 kg/m2, whereas the A allele is
preeminent in subjects with BMI $30 kg/m2.
For PPARG rs1801282, the allele frequencies were 80.93% for homozygous C/C, 1.03% for homozygous G/G, and 18.04% for heterozygous C/G. Again, no significant deviation from the Hardy–Weinberg equilibrium of allele frequencies was observed for PPARG rs1801282 (P=0.97).
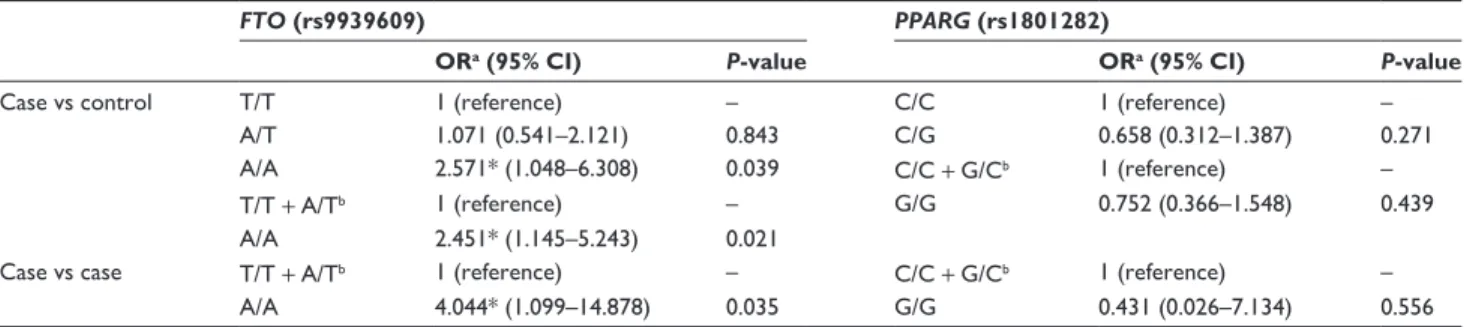
The presence of the A allele in FTO rs9939609 does not per se confer risk for obesity in the studied population. However, significant differences in allele frequencies between
the control and case groups were found for FTO rs9939609 (P,0.05), indicating a 2.5-fold higher risk for obesity for homozygous A/A individuals (OR=2.571, CI 1.048–6.308;
P=0.039). Comparison of homozygous A/A individuals with T allele carriers (either homozygous T/T or heterozygous A/T) clearly shows a significant association of homozygous A/A with obesity (OR=2.451, CI 1.145–5.243; P=0.021) (Table 2A).
What is more striking is the allelic expression of A/A homozygosity in subjects with a BMI $40 kg/m2, ie, class
III obesity. Considering this subgroup of obese women com-pared to those with class I and class II obesity, an OR=4.044 (CI 1.099–14.878; P=0.035) was found (Table 2B).
Analysis of PPARG rs1801282 showed no association with obesity (P.0.05) within the studied population.
Discussion
The worldwide prevalence of obesity has been increasing dramat-ically in the last few decades, and Portugal is no exception, where a 13.8% prevalence of obesity has been recorded.12 Association
studies have highlighted the influence of SNPs in obesity, with particular focus on FTO rs9939609.13,14 Thus far, no data on the
possible association of this SNP to obesity in the adult Portuguese population has been reported. Here, for the first time, we demon-strate an association between the FTO rs9939609 homozygous AA genotype and increased BMI when compared to homozygous TT. Significant differences were found between control and case group confirming the increased risk for obesity of homozygous AA at this locus. Also, with the post hoc Bonferroni test, it was
Anthropometric measures Age (years) BMI (kg/m2) Fat mass (kg) Fat mass (%) Waist (cm) Waist/hip ratio N TT 33.40 (±8.12) 31.42 (±13.99) 31.55 (±23.98) 34.68 (±11.88) 92.04 (±26.42) 0.79 (±0.08) 48 P-value 0.728 0.024* 0.021* 0.053 0.030* 0.112 – P-value 0.307 0.487 0.432 0.283 0.406 0.641 – AA 34.75 (±8.79) 37.66 (±12.12) 43.55 (±23.55) 41.04 (±13.27) 104.92 (±26.59) 0.84 (±0.11) 36 AT FTO rs9939609 Genotype frequencies Allele frequencies PPARG rs1801282 34.35 (±8.13) 30.99 (±11.49) 31.21 (±20.60) 35.33 (±11.78) 91.61 (±24.43) 0.79 (±0.09) 110 GG 46 (±5.67) 38.2 (±9.33) 42.48 (±13.7) 45.7 (±8.63) 107 (±18.38) 0.89 (±0.06) 2 CG 32.89 (±7.15) 29.97 (±12) 28.74 (±21.71) 32.74 (±13.08) 90.51 (±24.86) 0.79 (±0.09) 35 CC 34.32 (±8.37) 32.72 (±12.56) 34.55 (±22.61) 36.87 (±11.98) 94.84 (±26) 0.80 (±0.09) 157 0.00 0.10 0.20 0.30 0.25 0.27 0.22 0.40 0.50 0.60 0.57 0.61 0.53 0.19 0.12 0.25
All subjects Control Case
T/T Frequency A/T A/A FTO (rs9939609) genotypes 0.00 0.20 0.40 0.81 0.79 0.83 0.60 0.80 1.00 0.18 0.21 0.15 0.01 0.00 0.02 All subjects Control Case
C/C Frequency C/G G/G PPARG (rs1801282) genotypes 0.00 0.20 0.53 0.58 0.48 0.40 0.60 0.47 0.42 0.52 All subjects Control Case
T Frequency A FTO (rs9939609) alleles 0.00 0.20 0.90 0.89 0.91 0.40 0.60 0.80 1.00 0.10 0.11 0.09 All subjects Control Case
C Frequency G PPARG (rs1801282) alleles A B C D
Figure 1 Population characteristics, in function of the respective genotype (upper). Genotype and allele frequencies (bottom) obtained for each single-nucleotide polymorphism.
White bars – all subjects, grey bars – controls and black bars – case. (A) Genotype frequencies for fat-mass and obesity-associated (FTO) rs9939609; (B) allele frequencies for FTO
rs9939609; (C) genotype frequencies for peroxisome proliferator-activated receptor gamma (PPARG) rs1801282; (D) allele frequencies for PPARG rs1801282. Note: *Significant differences between groups were found for these cases.
Table 1 Anthropometric data of all subjects subdivided by
phenotype Anthropometric measures Total Phenotype Normal Obese n 194 99 95 Age (years) 34.19 (±8.22) 34.24 (±8.30) 34.12 (±8.14) BMI (kg/m2) 32.28 (±12.44) 21.42 (±1.69) 43.60 (±7.83) Fat mass (kg) 33.59 (±22.43) 14.32 (±3.61) 54 (±14.88) Fat mass (%) 36.22 (±12.25) 25.30 (±4.67) 47.61 (±5.30) Waist (cm) 94.19 (±25.72) 71.75 (±5.85) 117.57 (±15.49) Waist/hip ratio 0.80 (±0.09) 0.74 (±0.05) 0.87 (±0.08)
Notes: Obesity status: normal (BMI between 18.5 and 24.9 kg/m2), obese
(BMI $ 30 kg/m2); all data presented as means ± standard deviation.
possible to determine that individuals with both A alleles in FTO rs9939609 show 6.37±2.35 (P=0.022) higher BMI, 11.99±4.86 kg (P=0.043) higher body-fat mass and 13.31±4.87 cm (P=0.020) higher waist circumference compared to T-allele carriers. These data are in clear agreement with what has been reported for other populations of European origin.5–7,15,16 Our data show that
in the adult Portuguese population, this polymorphism confers an even higher risk for class III obesity (BMI .40 kg/m2). This
may allow identification of those individuals at increased risk and target them for an earlier clinical and lifestyle intervention. This idea has been recently reinforced by the report of Albuquerque and colleagues showing a strong association of FTO rs9939609 with obesity in Portuguese children.17 Together, these data may
prove useful for a structured public health strategy within the European Union.
Conversely, PPARG rs1801282 showed no association with obesity within the studied population, as no significant differ-ence was found between control and case subjects (P.0.05). In European populations, PPARG rs1801282 has shown associa-tion with obesity and higher BMI for homozygous carriers of the G allele (P,0.05).10 Nevertheless, no association was found
in other studies,18–20 indicating that this SNP may differ between
populations and probably should not be considered as a strong genetic marker to evaluate risk for obesity as FTO rs9939609 is. Despite reports on a relation between PPARG rs1801282 and diabetes type 2,21 we observed no relation in our study
(P.0.05). The relevance of PPARG rs1801282 as a genetic marker to assess risk for obesity and high insulin levels in pre-menopausal Portuguese women is, therefore, negligible.
Conclusion
Thus far, this is the first association study involving obesity-related genetic polymorphisms in the adult Portuguese population. Data show that FTO rs9939609 could be useful for the clinical management of obese women. Nevertheless, additional data are
required, namely inclusion of males and youth subjects, to fully characterize the involvement of these loci in the development of obesity within the Portuguese population.
Acknowledgments
This work was supported by Stab Vida, Lda; FCT/MEC (PEst-OE/SAU/UI0009/2011 – CIGMH) and SFRH/ BDE/51103/2010 for FFC.
Disclosure
The authors report no conflicts of interest in this work.
References
1. [No authors listed]. Obesity: preventing and managing the global epidemic. Report of a WHO Consultation. World Health Organ Tech
Rep Ser. 2000;894:i–xii, 1–253.
2. Mokdad AH, Ford ES, Bowman BA, et al. Prevalence of obesity, diabetes, and obesity-related health risk factors. JAMA. 2003;289:76–79. 3. Rankinen T, Zuberi A, Chagnon Y, et al. The human obesity gene map:
the 2005 update. Obesity. 2006;14:529–644.
4. Frayling TM, Timpson NJ, Weedon MN, et al. A common variant in the FTO gene is associated with body mass index and predisposes to childhood and adult obesity. Science. 2007;316:889–894.
5. González-Sánchez JL, Zabena C, Mar tínez-Lar rad MT, Martínez-Calatrava MJ, Pérez-Barba M, Serrano-Ríos M. Variant rs9939609 in the FTO gene is associated with obesity in an adult population from Spain. Clin Endocrinol (Oxf). 2009;70(3):390–393. 6. Zimmermann E, Skogstrand K, Hougaard DM, et al. Influences of the
common FTO rs9939609 variant on inflammatory markers throughout a broad range of body mass index. PLoS One. 2011;6:e15958. 7. Sentinelli F, Incani M, Coccia F, et al. Association of FTO
polymorphisms with early age of obesity in obese Italian subjects. Exp
Diabetes Res. 2012;2012:872176.
8. Tontonoz P, Hu E, Devine J, Beale EG, Spiegelman BM. PPARgamma 2 regulates adipose expression of the phosphoenolpyruvate carboxykinase gene. Mol Cell Biol. 1995;15:351–357.
9. Yen CJ, Beamer BA, Negri C, et al. Molecular scanning of the human peroxisome proliferator activated receptor gamma (hPPAR-gamma) gene in diabetic Caucasians: identification of a pro12ala gamma-2 missense mutation. Biochem Biophys Res Commun. 1997;241: 270–274.
10. Masud S, Ye S. Effect of the peroxisome proliferator activated receptor-gamma gene pro12ala variant on body mass index: a meta-analysis.
J Med Genet. 2003;40:773–780.
Table 2 Odds ratio (OR) values between case and control groups for risk to obesity for allele A in fat-mass and obesity-associated
(FTO) rs9939609 and G in peroxisome proliferator-activated receptor gamma (PPARG) rs1801282, and between BMI $30–,40 kg/m2 and BMI $40 kg/m2 for risk for obesity for allele A in FTO rs9939609 and allele G in PPARG rs1801282 only in the case group
FTO (rs9939609) PPARG (rs1801282)
ORa (95% CI) P-value ORa (95% CI) P-value
Case vs control T/T 1 (reference) – C/C 1 (reference) –
A/T 1.071 (0.541–2.121) 0.843 C/G 0.658 (0.312–1.387) 0.271
A/A 2.571* (1.048–6.308) 0.039 C/C + G/Cb 1 (reference) –
T/T + A/Tb 1 (reference) – G/G 0.752 (0.366–1.548) 0.439
A/A 2.451* (1.145–5.243) 0.021
Case vs case T/T + A/Tb 1 (reference) – C/C + G/Cb 1 (reference) –
A/A 4.044* (1.099–14.878) 0.035 G/G 0.431 (0.026–7.134) 0.556
Diabetes, Metabolic Syndrome and Obesity: Targets and Therapy
Publish your work in this journal
Submit your manuscript here: http://www.dovepress.com/diabetes-metabolic-syndrome-and-obesity-targets-and-therapy-journal
Diabetes, Metabolic Syndrome and Obesity: Targets and Therapy is an international, peer-reviewed open-access journal committed to the rapid publication of the latest laboratory and clinical findings in the fields of diabetes, metabolic syndrome and obesity research. Original research, review, case reports, hypothesis formation, expert
opinion and commentaries are all considered for publication. The manuscript management system is completely online and includes a very quick and fair peer-review system, which is all easy to use. Visit http://www.dovepress.com/testimonials.php to read real quotes from published authors.
11. Dedoussis GV, Vidra N, Butler J, et al. Peroxisome proliferator- activated receptor-gamma (PPARgamma) Pro12 Ala polymorphism and risk for pediatric obesity. Clin Chem Lab Med. 2009;47:1047–1050. 12. do Carmo I, Dos Santos O, Camolas J, et al. Overweight and obesity
in Portugal: national prevalence in 2003–2005. Obes Rev. 2008;9: 11–19.
13. Scuteri A, Sanna S, Chen WM, et al. Genome-wide association scan shows genetic variants in the FTO gene are associated with obesity-related traits. PLoS Genet. 2007;3:1200–1210.
14. Li H, Kilpeläinen TO, Liu C, et al. Association of genetic variation in FTO with risk of obesity and type 2 diabetes with data from 96,551 East and South Asians. Diabetologia. 2012;4:981–995.
15. Zavattari P, Loche A, Pilia S, et al. rs9939609 in the FTO gene is associated with obesity but not with several biochemical parameters in Sardinian obese children. Ann Hum Genet. 2011;75:648–654. 16. Liu G, Zhu H, Lagou V, et al. FTO variant rs9939609 is associated with
body mass index and waist circumference, but not with energy intake or physical activity in European- and African-American youth. BMC
Med Genet. 2010;11:57.
17. Albuquerque D, Nóbrega C, Manco L. Association of FTO polymorphisms with obesity and obesity-related outcomes in Portuguese children. PLoS One. 2013;8:e54370.
18. Ghoussaini M, Meyre D, Lobbens S, et al. Implication of the Pro12 Ala polymorphism of the PPAR-gamma 2 gene in type 2 diabetes and obesity in the French population. BMC Med Genet. 2005;6:11. 19. Milewicz A, Tworowska-Bardziñska U, Dunajska K, Jêdrzejuk D,
Lwow F. Relationship of PPARgamma2 polymorphism with obesity and metabolic syndrome in postmenopausal Polish women. Exp Clin
Endocrinol Diabetes. 2009;117:628–632.
20. Passaro A, Dalla Nora E, Marcello C, et al. PPARγ Pro12Ala and ACE ID polymorphisms are associated with BMI and fat distribution, but not metabolic syndrome. Cardiovasc Diabetol. 2011;10:112. 21. Scott LJ, Mohlke KL, Bonnycastle LL, et al. A genome-wide association
study of type 2 diabetes in Finns detects multiple susceptibility variants.
Science. 2007;316:1341–1345.