PORT WINE DYNAMICS: PRODUCTION, TRADE AND MARKET STRUCTURE
REBELO, João*
CORREIA, Leonida
Abstract
In the last decades the world has seen some acceleration in the process of internationalization, affecting virtually all industries. The wine sector is no exception, witnessing increased exports and imports and a movement of mergers and acquisitions. Among European wines, Port Wine can be seen as a representative case of integration in international markets, with about 90% of its production to be exported. After the World War II, although the Port Wine activity has been subjected to cycles there has been a trend towards a continued increase in production and exports, stabilization of real market prices and a slight increase in the real prices paid to grape growers, leading to positive economic effects for Port Wine firms and grape growers.
Keywords: wine, Douro, dynamics, market, concentration JEL Classification: O180; C220; L110
1 Introduction
In December 2005 the Portuguese media announced that the Portuguese Ministry of Agriculture had protested against the agreement between the European Union (EU) and the United States of America (USA), which allows the commercialization of American wine with the categories vintage, tawny and ruby traditionally
*
João Rebelo and Leonida Correia, Centro de Estudos Transdiciplinares para o Desenvolvimento (CETRAD), Departamento de Economia, Sociologia e Gestão (DESG), Universidade de Trás-os-Montes e Alto Douro (UTAD), Av. Almeida Lucena, 1, 5.000 – 660 Vila Real, Portugal, [email protected], [email protected]
associated with Port wine1. The representatives of the sector admitted that there were threats as well as opportunities, whereas the European commissioner responsible for agriculture justified the agreement because of the importance of the American market for the community producers of spiritual wines, since the EU exports 2 thousand million euros of wine annually to the American market, this being the main external market of European wines. The same source further emphasized the position of the Douro and Port Wine Institute
(Instituto do Vinho do Douro e do Porto - IVDP)2 and the
Association of Port Wine Companies (Associação de Empresas de Vinho do Porto - AEVP). For the former, the advantages of a closed agreement are due to the fact that the American market is a large consumer of high quality fortified wines, because Port Wine has a quota of 25% in volume and 40% in value in the American imports of the so-called desert wines. For the AEVP it reduces the threat that the USA can create entrance taxes and highlights the fact that the agreement does not worsen the already existing situation but rather clarifies it.
The situation described above could be understood as an international integration process, although not being a new phenomenon in the world wine market, it has new contours which may become more and more accentuated and the various sector
stakeholders should internalize3 it considering it in the strategic
making decision process.
Considering what is currently happening in terms of the wine market, especially in the Port Wine one, is not different to what happened in the recent past, the main objective of this paper is to analyze the
1
Other English-speaking countries (e.g., South Africa) can adopt the same categories in its wines.
2 It is the entity (inter-professional public institute) that regulates the chain of the wines produced in the Douro Demarcated Region (DDR).
3
For example the press at the time announced that the Port Wine, Champagne and Jerez wine sectors were ahead of the EU commercial agreement with the USA and were already working on the valorization of the product and the concept of the denomination of origin on the American market, involving financial aid of 3 million euros provided by the EU.
commercial behavior (quantity and price) of Port Wine in the post World War II (WWII) period. In order to do this, besides this introduction, the article includes a brief appreciation of the wine industry in the internationalization context (section 2), the productive structure of the DDR (section 3), an analysis of the dynamics of the trend and cyclical components of the time series of the production, the trade and the prices of Port Wine (section 4) and the market quotas in terms of the concentration indexes per firm and per holding (section 5). Section 6 closes with some conclusions.
2 Internationalization and wine industry
There is a vast body of literature on determinants of national and regional wealth. One part of this literature considers trade as a central factor based on a concept of David Ricard and uses the theory of comparative advantages. He demonstrated how the wealth of two nations, the United Kingdom (UK) and Portugal, would have an economic increase if they specialized their economies in products in which they had comparative advantages, using as examples the textiles for the UK and wine (Port Wine) for Portugal. Globalization, as we currently identify it, is an extension of the comparative advantages principle and is not a new phenomenon, being part of a 200-year burst in economic growth, but it has rapidly accelerated since the last decades of the 20th century.
Virtually all industries and consumers have been affected by globalization, regardless of the way it is understood or defined by different economic approaches. For the more liberal economists it is a positive thing, representing a way to reduce costs associated with geographic locations, thus adding to productivity by conserving resources. From this perspective, internationalization is a very important component of globalization, in which we include the growth of international trade of goods, services and various forms of capital (physical, human and intellectual property). Inversely, the anti-globalization groups consider this to be a bad thing, relating it, for example, to the homogenization of products for sale, the growing dominance of multinational companies and the disappearance of small companies with individualized products and services.
In economic terms and on a world scale, wine represents about 0.4% of household expenditure, where vineyards occupy only 0.5% of the cultivated area. Globally, the wine industry is at a maturation phase with a slight decline in the last two decades. In spite of this, we are, however at an intriguing case of globalization in movement, especially in terms of international trade, which has been a subject of several studies (e.g., Uniwin, 1991; Sphani, 2000; Heijbroek, 2003; Anderson et al, 2004).
Although the production of wine is spread around the world, it is in the EU that the wine industry has a global dimension and is a leader
in the world market (European Commission, 20064). The vineyards
account for approximately 45% of the world’s vine growing area5
and almost 60% of the world wine production and consumption. The present per-capita consumption in the EU-25 is almost 30 liters/year, after a sharp fall during the last twenty years, especially in the producer countries, where it has dropped by one half.
The EU is also the world’s leading exporter and importer of wine, exporting an average of 12.5 million hl (€ 4.5 billion) and importing an annual average of 9 million hl. The main exporting members are Italy (35% of the total volume and 30% of the total value), France (30% of the volume and 30% of the value) and Spain (21% of volume and 10% of the value).
France, Italy and Spain form the leading trio6 of wine exporting
countries accounting for almost 60% of world quantity exports
4
This paper provides a good overview of the structure of the EU wine chain.
5
However, since the prohibition of new plantations and the introduction of a premium for grubbing up in 1975/76 has decreased, falling from 1975 to 1996 from 4.5 to 3.4 million ha, an annual rate of decrease of 1.4%, equivalent to 56.000 ha/year. More recently the rate of decrease has slowed. Presently, the area of vineyards EU-15 is almost 4.8 million ha (60% of the world area).
6
This trio is followed by Australia, USA, Chile, Germany, Portugal and South Africa, in terms of quantity. Taking the value of exports the order is France, Italy, Spain, Australia, Chile USA, Portugal, Germany and South Africa (European Commission, 2006).
(including intra-Community trade). In the last decade their exports increased significantly, i.e. France by 34%, Spain 31% and Italy 21%. By contrast, they fell in Greece (-30%), Hungary (-19%) and Germany (-10%). But were the New World countries which have seen a spectacular growth in their exports (European Commission, 2006): South Africa (+770%), Australia (+500%), Chile (+270%) and USA (+160%), provoking a fall of the market share of the Old World. In relation to imports, the main quantity countries are Germany, the UK, the USA and France, whereas by value the main importer is the UK, followed by the USA, Germany and Japan. Outside of its members, the main sources of EU imports are Australia, Chile and the USA.
That dramatic entry on to the international stage by New World producers has presented and will continue to present serious challenges to producers in the Old World in both Western and Eastern Europe. Moreover, following a dramatic expansion in their vineyard planting in the later 1990s, New World regions too face challenges, as the production from those recent plantings adds significantly to the stock of wine available for sale on the world market. As expressed by Remaud and Couderc (2006: 406): “Old wine companies have been taking more than a decade to start reacting to the rising competition from the New World. Moreover, due to the recent trend of global grape and wine oversupply, markets are beginning to experience deep discounting as wineries look to clear out excess inventory in order to make room for new vintages. To sustain their growth wine producers will have two alternatives; either go along with the supermarket chains and become global by investing in some of the main wine producing countries, or develop a niche strategy (through a specific product, and or a specific service) to differentiate themselves”.
Inherent to the world wine competition there has been a growing industrial concentration (Anderson, 2004), especially in the New World countries. The lower concentration in the Old World results from the fact that the traditional viticulture structure in the EU is one of small properties and transformation/commercialization depends on producer cooperatives, most of which were founded in the fifties and
sixties of the past century when the main objectives were to solve problems of wine processing and stocking of the production of a large number of very small wine growers. Now we are in the presence of small-scale units with insufficient organizational ability to develop goods, services and skills demanded by an increasingly competitive international market.
It is in an environment of increasing international competition, essentially after the WWII, that Port Wine is produced and commercialized, beginning its pathway in the region where it is produced, the Douro region.
3 The productive structure of the Douro Demarcated Region
Port Wine is a fortified wine named after Porto, Portugal’s second largest city, from where it has traditionally been shipped. However, it begins life in the Douro Demarcated Region (DDR) starting 100 km east of Porto and extending to the Spanish border on the steep hills of the Douro Valley and its tributaries. In 1756 the region was demarcated to protect Port Wine, more precisely the quality of Douro wines against the competition of other Portuguese wines. This was a pioneering decision at a world level in the concepts and regulating principles of controlled denominations of origin, accepted worldwide (especially in Europe). Despite the geographical, institutional and administrative changes, the DDR constitutes a region with a collective memory, with a strong tradition of grape farming and socio-economic specific characteristics, classified as a world heritage site by UNESCO in 2001.
In geographical terms, the DDR has an area of 250,000 hectares, with the vineyard occupying only 17% of all the land. There are 257,100 inhabitants, with a population density of 46.62 inhabitants/km2. In the last 40 years the region has lost 40% of the population and there is evidence of significant aging of the population. The negative demography is also associated with high asymmetries in the distribution of wealth. Walking hand-in-hand with this fact is a vineyard mosaic characterized by a great variety of
situations, a high number of small-scale grape farmers7 relating to a
reduced number of average and large-scale farmers8. A large number
(about 16,000) of the small-scale producers are integrated in the present twenty wine cooperatives, most of which were set up in the 1950s and 1960s. The wine cooperatives produce about 60% of table wines and 40% of Port Wine corresponding to about 55% of the total production in the DDR.
The greater part of the grapes in the DDR is for the production of Port Wine. The regulating institution of the sector (presently IVDP) indicates the quantity of Port Wine to be produced. This is done after the main stakeholders have been heard (production and trade) taking into account the recent evolution and the short-term perspectives of the sales and the stock available. Then in agreement with the property records (namely, the location, the nature of the soil, the varieties and age of the vines) the allowed quantity of grapes for the production of Port Wine is distributed among the parcels that have that property right. This is the benefício system, a typical quota policy.
4. Production, trade and prices of Port Wine
The production and trade of Port Wine are closely linked to the history of the DDR, whose economy is characterized by historical cycles (Martins, 1990). To analyze the evolution of the trend and cycle components of a set of variables related to production, trade
(exportation and domestic consumption) and prices9of Port Wine in
the post WWII we use a time-series approach. Descriptive statistics of these variables are included in Table 1. As expected, the
7
In the DDR the approximate 40,000 hectares of vineyard divided into 85,000 parcels are owned by about 33,000 grape farmers, that is, 1.20 hectares per farmer.
8
Some of these have in the last two decades become individually integrated through the statute of producer-bottler. An associative integration is rare.
9
With regards to prices, we use the average price per hectoliter observed in production, export and domestic market in real terms, or rather at constant 2002 prices. Until 1967 the domestic value of sales was unknown, therefore there is no annual price.
variability (shown by the coefficient of variation – CV) of the prices is smaller than the variables that represent volumes.
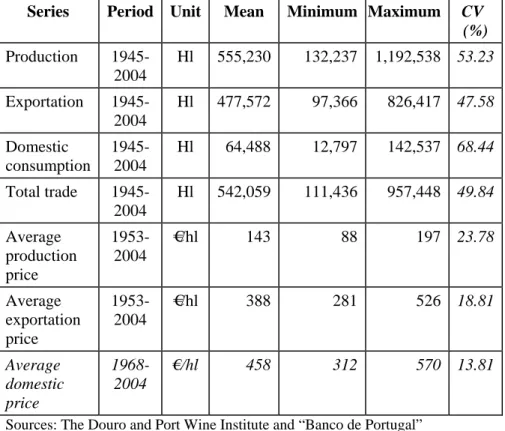
Table 1 – Descriptive statistics of the original series
Series Period Unit Mean Minimum Maximum CV
(%) Production 1945-2004 Hl 555,230 132,237 1,192,538 53.23 Exportation 1945-2004 Hl 477,572 97,366 826,417 47.58 Domestic consumption 1945-2004 Hl 64,488 12,797 142,537 68.44 Total trade 1945-2004 Hl 542,059 111,436 957,448 49.84 Average production price 1953-2004 €/hl 143 88 197 23.78 Average exportation price 1953-2004 €/hl 388 281 526 18.81 Average domestic price 1968-2004 €/hl 458 312 570 13.81
Sources: The Douro and Port Wine Institute and “Banco de Portugal” (2001, 2005).
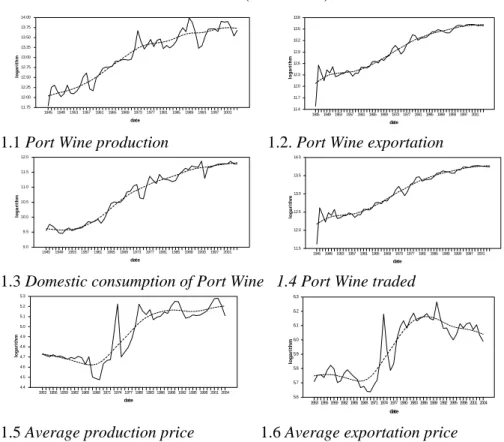
In relation to the means to isolate the trend from the cyclical component of the time series, the Hodrick-Prescott filter (Hodrick and Prescott, 1997) is applied to annual data of the logarithm of the production, trade and prices of Port Wine. The results (λ=100) are illustrated in Figure 1, showing the charts the evolution of the observed series and their trends.
Actual and trend (dashed line) date lo g a ri th m 194519491953195719611965196919731977198119851989199319972001 11.75 12.00 12.25 12.50 12.75 13.00 13.25 13.50 13.75 14.00 date lo g a ri th m 1945 1949 1953 1957 1961 1965 1969 1973 1977 1981 1985 1989 1993 1997 2001 11.4 11.7 12.0 12.3 12.6 12.9 13.2 13.5 13.8
1.1 Port Wine production 1.2. Port Wine exportation
date loga ri th m 194519491953195719611965196919731977198119851989199319972001 9.0 9.5 10.0 10.5 11.0 11.5 12.0 date lo g a ri th m 194519491953195719611965196919731977198119851989199319972001 11.5 12.0 12.5 13.0 13.5 14.0
1.3 Domestic consumption of Port Wine 1.4 Port Wine traded
date lo g a ri th m 1953 1956 1959 1962 1965 1968 1971 1974 1977 1980 1983 1986 1989 1992 1995 1998 2001 2004 4.4 4.5 4.6 4.7 4.8 4.9 5.0 5.1 5.2 5.3 date lo g a ri th m 1953 1956 1959 1962 1965 1968 1971 1974 1977 1980 1983 1986 1989 1992 1995 1998 2001 2004 5.6 5.7 5.8 5.9 6.0 6.1 6.2 6.3
1.5 Average production price 1.6 Average exportation price
date loga ri th m 1968 1970 1972 1974 1976 1978 1980 1982 1984 1986 1988 1990 1992 1994 1996 1998 2000 2002 2004 5.7 5.8 5.9 6.0 6.1 6.2 6.3 6.4
1.7 Average domestic price
In terms of volume, Figure 1 clearly shows the increasing systematic trend of Port Wine production and trade over the last 60 years. After an initial weaker phase which lasted till the end of the 1950s, a stronger phase of vitality followed, where the production and trade grew at a quicker rate until the end of the 1970s, started to decelerate during the 1980s and moved on to a relatively stable phase from the 1990s onwards.
In terms of the cyclic variation, production, export and trade show a very similar cyclic pattern, even though there are more considerable cyclic fluctuations in production. Given the importance of export in the total sales of Port Wine (an average of 88.5% over the whole period) it is not surprising to see an almost perfect overlapping of the cycles of these two variables.
The charts also show that there is an increase in fluctuations after the 1970s where there appears to be a bigger sensitivity to the behavior of the Portuguese economy. In general the recessions of aggregate economic activity correspond to the lower phase of the cycle of Port Wine production in 1975, 1983/84, 1992/93 and 2003. The same happened with the peaks of the expansion phase in 1973, 1989/90 and 1999. Here we highlight the fact that the domestic consumption cycle behaves in accordance with that of production with about a year’s delay. That is, the peak years and the contraction phase of the consumption cycle years happen about a year after being seen in the Port Wine production.
The trend of the production and export prices of Port Wine appears slightly lower between 1953 and 1967/68, after which there is a rapid increase until the middle of the 1980s. After, in the case of the production price there is a decrease until 1995 and then a slow rate of increasing and, in the case of the exportation price, a decrease until the present. The trend behavior of the average price in the domestic market, for which we only have data from 1968 to 2004, is differentiated: there is a negative evolution until the beginning of the 1980s, starting to increase gradually until the beginning of the 1990s at a slow rate until 1999 and from then onwards it stays relatively stable.
By complementing the information in Figure 1 with that obtained from bibliographical sources, we can affirm that at the end of the WWII the scenario for the wine sector in the Douro region was quite grim. In 1945 the amount of wine exported was one of the lowest since the demarcation in 1756, explained by the worldwide decrease in the consumption of Port Wine (Moreira, 1998) resulting from the economic crisis in the main export destination countries, i.e., England, France, Belgium and Luxembourg.
After the WWII, due to the economic progress of the eastern countries and the elimination of trade barriers, commerce expanded quickly at a world level. This was also true for Port Wine, although less in the 1950s where there was some stagnation due to changes in the British lifestyle and consumption trends as a consequence of the war, which brought American soldiers to Europe along with their lifestyle and led to the increased consumption of non-alcoholic drinks such as Coca-Cola and other drinks such as whisky, sherry, rum and vermouth. In addition to the decrease in the British market, Port Wine also faced stiff competition from other alcoholic drinks that were launched with persuasive publicity campaigns to influence consumer preferences.
Despite the marketing campaigns by some Port Wine companies to establish themselves in various markets, they were not as successful as those of other alcoholic drink producers. Nevertheless these publicity campaigns had a positive effect and from the mid 1950s onwards there was an increase in sales to France, which to a certain extent offset the decrease in exports to the British market. During this period other markets started to consume more Port Wine, such as those of Belgium, Germany and Italy. The home market also recovered as the Portuguese standard of living improved. In other words, the Port Wine business has both felt and influenced the effects of international integration market, with some Port Wine firms carrying out mergers and acquisitions to benefit from economies of scope and scale. Following a normal pathway, Port Wine has consolidated its position in the European markets since 1974, having expanded its production and trade as well as increasing its sales and production prices.
5 Firm concentration within the Port Wine industry
The movement of concentration firms in the Port Wine industry started in an accentuated way after the WWII, which is linked to the history of the main players. Since the seventeenth century the export of Port Wine has been done by firms whose owners are mainly English. The exporters tended to be organized in family networks primarily based in London, with export operations in Porto and wholly owned marketing and distribution channels established in the
country where the wine is sold. Until 199610, a large share of Port
Wine was exported in bulk to the consumption market where it was labeled with the brand names of their wholesalers or retailers, having the shippers little or no control over the marketing of their brand. With the changes in the economic environment, as has occurred in the alcoholic beverage sector of other countries in the last five decades, we have observed a number of mergers and acquisitions (M&A) in Port Wine firms (Table 2), with a relevant intervention of foreign companies.
During the 1960s, multinational UK firms invested in Port Wine, believing that it was possible to blend Port to obtain a beverage with homogeneous characteristics which could be more easily branded. Allied Domecq, for example, acquired Cockburn and Martinez Gassiot in 1961 with this in mind. In the following decades it was French and Spanish firms that invested in the sector, buying a number of Port Wine companies.
The intervention of multinationals in the Port Wine business changed and refined the way this beverage was sold, namely through the
segmentation of the market and creation of product line extensions11.
10
In this year the exportation in bulk was suspended, being the Port Wine bottled Porto or in the DDR. However, the shippers continued to commercialize their wines through warehouses or retailers.
11
For example, in 1983, Allied Domecq created the line extension Cockburn Special Reserve, which, in the short run, became a premium wine with high acceptation in the world market (Lopes, 2005).
Table 2 – Major M&A in the Port Wine industry Year Acquired firm Acquiring firm Country of
acquiring firm 1960s
1961 Cockburn Harvey´s (Allied
Domecq)
United Kingdom 1961 Martinez Gassiot Harvey´s (Allied
Domecq)
United Kingdom 1962 Offley Forrester Sandeman United Kingdom 1970s
1972 Croft Delaforce Grand Metropolitan United Kingdom 1975 Gran Cruz La Martiniquaise France
1978 Rozès Moet Chandon (60%),
Taylor (40%)
France 1980s
1980 Sandeman Seagram Canada
1983 Offley Forrester Bacardi-Martini Bermuda
1987 A. A. Ferreira Sogrape Portugal
1987 Rozès Luois-Vouiton/Moet Henessey France 1990s 1990 Adriano Ramos Pinto Roeder France
1990 Quinta do Noval Axa France
1996 Offley/Forrester Sogrape Portugal
1999 Burmester Amorim Portugal
1999 Rozès Vranken France
1999 Calém Caixa Nova Spain
1999 Quinta do
Ventozelo
Proinsa Spain
2000s
2002 Sandeman Sogrape Portugal
2002 Croft Delaforce Taylor and Fonseca Portugal
2005 Burmester Caixa Nova Spain
However, the difficulty in controlling the quality due to the natural
and biological origins of the wine12 and in creating and sustaining
brands in the international market, associated with the low level of return on capital when compared to that obtained from sales of spirits, such as vodka, tequila or cognac and other processed wine, led most of the leading multinationals to divest the Port Wine business in the beginning of 2000s. However, since the 1990s Portuguese firms have become involved in the M&A, and their goal
is to consolidate domestic leadership13.
As a consequence of the M&A in the Port Wine there is an increasing on the firm concentration. The concentration indexes (per firm and group) presented in Table 3 indicates that we have a “model of strategic groups” where a reduced number of firms have a high market share and the rest weaken the market power of the formers. Table 3. Market concentration (CR4 and CR8) by firm and holding (%)
1991 1998 2004 CR4 - Firm - Holding 35.0 48.9 34.7 44.4 49.2 59.1 CR8 - Firm - Holding 54.6 73.0 52.5 64.2 69.1 77.2
Source: Rebelo (1998) provides 1991 and The Douro and Port Wine Institute 1998 and 2004.
Taking into account he concentration ratios (CR), i.e., the accumulated market share of the 4 (CR4) or 8 (CR8) bigger firms or holdings, in 2004, the 4 and 8 biggest firms traded 49.2% and 69.1% of Port Wine, values which increase to 59.1% and 77. 2% if the data is seen in the light of a holding. In comparison to what happens in the world wine industry, where the concentration of the top three firms in industry is only 7% (Heijbroek, 2003), the concentration in
12
Difficulties that are reinforced because of the different microclimates coexisting in the DDR and the structure of the property is of a small dimension, when compared with patterns of the New World or even of the UE.
13
A typical example is Sogrape. Until the 1990s the sales of this firm depended about 95% on one brand (the table wine Mateus Rosé). However, the decline of this brand forces the company to diversify into other types of wines, essentially Port (Lopes, 2005).
Port Wine is particularly higher and very similar to the New World producers (Anderson et al., 2004).
6 Conclusions
The wine market, in general, and the Port Wine, in particular, is a good illustration of the movement of international trade in recent decades. Consumption has decreased and the market has expanded and international competition has become more intense. Europe is the continent where globalization has been most felt, suffering an accentuated reduction in consumption, a large drop in the vineyard area and an increasing in international trade.
On account of its history, Port Wine can be considered as a benchmark case of integration in international markets. During the last five decades, despite the influence of cycles, there has been a trend towards a continued increase in Port Wine production and exports. In addition to the increase in production, there has been a trend to maintain real prices in the market and a slight increase in the real price paid to the grape growers. Relating the evolution of production to that of prices we can conclude that in terms of the added value chain, a larger quantity of Port Wine results in positive effects for Port Wine companies and for grape growers. Also, the quota policy has allowed small-scale grape producers to benefit from part of this additional prosperity.
As has happened in the world wine market, increasing industrial concentration has also been seen in the Port Wine sector, following a model of “strategic groups” type. This situation may be positive from the final product market point of view but the same cannot be said in relation to the up-stream situation, since oligopsonist behavior can have serious consequences for grape growers. The inter-professional organization, as a forum for discussion and agreements of the sector, should be attentive to this situation.
To sum up, there is no doubt about the fact that the Port Wine sector’s adopted entrepreneurial and commercial strategies have been able to respond to new challenges of international trade. Along this evolving process the Douro region has always felt the need and benefits from the public intervention in the external and domestic defense of Porto Wine, the quota system playing an important role.
References
Anderson, K., Norma D., Wittwer G. (2004). The global picture. The World´s Wine Market, Globalization at Work. Anderson, K. (Ed.), Edward Elgar Publishing Limited, UK, pp. 14-55.
Banco de Portugal (2001). Séries Longas para a Economia Portuguesa: Pós II Guerra Mundial (versão revista e prolongada para 1994 e 1995). Banco de Portugal, Lisboa.
Banco de Portugal (2005). Relatório e Contas da Gerência de 2004. Banco de Portugal, Lisboa.
European Commission (2006). “Wine, Economy of the sector”. Working paper, Directorate General for Agriculture and Rural Development, February 2006.
Heijbroek, A. (2003). Wine is business. Rabobank International, Utrech, The Neterhlands.
Hodrick, R.J., Prescott, E.C. (1997). “Postwar U.S. business cycles: an empirical investigation”. Journal of Money, Credit and Banking,29(1),1-16. Lopes, T. S. (1997). Internacionalização e Concentração no Vinho do Porto, 1945-1995: uma abordagem pelos custos de transacção. Master thesis, FCEE-UCP, Lisboa.
Lopes, T. S. (2005). “Competing with Multinationals: Strategies of the Portuguese Alcohol Industry”. Business History Review, 79: 559-585. Martins, C. A. (1990). Memória do Vinho do Porto. Instituto de Ciências Sociais da Universidade de Lisboa, Portugal.
Moreira, Vital (1998). O Governo de Baco. Edições Afrontamento, Porto, Portugal.
Rebelo, J. (1998). Evolução económica recente do sector vitivinícola português: o caso da RDD/vinho do Porto. Os Vinhos Licorosos e a História. Centro de Estudos de História do Atlântico, Funchal, Portugal: 323-345.
Remaud, H. and J. Couderc (2006). "Wine Business Practices: A New Versus Old Wine Perspective”. Agribusiness, Vol. 22 (3): 405-416.
Spahni, Pierre (2000). The International Wine Trade. Woodhead Publising, 2nd Edition.
Unwin, Tim (1991). Wine and the Vine –An Historical Geography of Viticulture and Wine Trade. Routledge, London.