TWO METHODS FOR TREE VOLUME ESTIMATION OF Acacia
melanoxylon IN PORTUGAL
Andreia Rucha1, Antonio Santos2, José Campos2, Ofelia Anjos3, Mario Tavares4
1Forest Engineer, Instituto Politécnico de Castelo Branco/Escola Superior Agrária, Castelo Branco, Portugal 2Forest Engineer, INRB – Instituto Nacional de Recursos Biológicos, Oeiras, Portugal
3Ph.D., Instituto Politécnico de Castelo Branco/Escola Superior Agrária, Castelo Branco, Portugal - [email protected] 4Forest Senior Researcher, INRB – Instituto Nacional de Recursos Biológicos, Oeiras, Portugal - [email protected]
Recebido para publicação: 05/04/2010 – Aceito para publicação: 06/06/2010
Abstract
Two models were developed to evaluate total volume under and over-bark of Blackwood (Acacia
melanoxylon R. Br.) stand trees. By variance analysis regarding volume with and without bark it was
confirmed that trees age is responsible for 48 to 50% of its volumetric behaviour. Considered the averages of those variables and regarding the three homogeneous groups of the studied sites, a single model type was used (v=β1dβ2hβ3) for estimating volumes. The critical errors are between 72 and 195
dm3 under-bark, and 82 and 212dm3 over-bark. The model that uses sites as dummy variables to the estimation of stand tree volumes is the same, and this method performs maximum expected errors with values of 155 dm3 (under-bark) and 169dm3 (over-bark), to mean maximum volumes of 1362 and 1459 dm3 respectively. The use of dummy variables is a more expedite and rapid modelling method, and its maximum expected errors perform lower values.
Keywords: Blackwood; tree volume; modelling; ANOVA; dummy variables.
Resumo
Dois métodos para estimar o volume em pé de árvores de Acacia melanoxylon em Portugal. Foram
construídos dois modelos para estimar o volume sobre e sob casca de árvores em pé da acácia austrália (Acacia melanoxylon R. Br.). Por análise de variância do volume com e sem casca, foi confirmado que a idade das árvores é responsável por 48 a 50% do seu comportamento volumétrico. Consideradas as médias dessas variáveis e tendo em conta os três grupos homogêneos das “estações” estudadas, foi usado um único modelo tipo (v = β1dβ2hβ3) para estimar volumes. Os erros críticos
situam-se entre 72 e 195 dm3 sobre casca, e 82 e 212 dm3 sob casca. O modelo que usa as “estações” como variáveis dummy para estimar volumes de árvores em pé é o mesmo e gera erros máximos esperados com valores de 155 dm3 (sob casca) e de 169 dm3 (sobre casca), para volumes máximos médios de 1362 e 1459 dm3, respectivamente. A utilização de variáveis dummy é um método de modelação rápido e mais expedito, e os seus valores de erros máximos esperados são inferiores.
Palavras-chave: Austrália; volume de árvore; modelação; ANOVA; variáveis dummy.
INTRODUCTION
While Blackwood will be an alien species in Portugal and it is not a preferable plant to be used in forest plantations actions, it cannot be forgotten by its capability to re-establish rapidly the soil canopy and to restore the carbon sequestration plafond after the frequent forest fires. Its biomass generation tax and fertility input to soil profile are also very relevant (TAVARES et al. 1999a, TAVARES et al. 1999b). Its rather capability to fixate the soil, reduced inflammability, shorten invasive acting, considerable growth rate and appetizing wood quality for writing and printing papers or sawing, makes this species a very interesting alternative to maritime pine and blue-gum eucalyptus (GOES 1991, TAVARES et al. 1999a, NICHOLAS et al. 2002, SANTOS et al. 2006, RUCHA et al. 2007).
The most common procedure to timber volume estimate is to use volume equations based on the relationships between, for instance, volume and diameter. In Portugal, some work has been carried out regarding more common species plantation, namely Pinus pinaster and Eucalyptus globulus but, so far,
very few studies have been done for Acacia species.The use of this species requires total volume of stand trees evaluating models; so much as it appears frequently in natural regeneration pure stands or mixed with softwood and/or other hardwood species. It’s in the north third of the country that can be founded the most interesting wood growths and the biggest diameters (FREIRE et al. 2003b, SANTOS et al. 2007).
Some bibliography of modelling the volumetric evaluation of other Acácia, uses dummy variables to label sites growth and to attain errors minimizing (SOUSA, 1974, VEIGA et al. 2000). In this paper, this method is compared with another that uses ANOVA for selection of sites groups.
MATERIAL AND METHODS
From five sample trees of A. melanoxylon were cut several sample disks at the base, diameter breast height (dbh), 50% of total height and at each 2m until the upper commercial level (d class=10 cm). Those disks were collected in the third north of Continental Portugal, at the National Camarido Forest (MNC), the Forest Perimeter of Ovar Dunes – Drain of Maceda (PFDOVM), the Forest Perimeter of Rebordões de Stª Maria (PFRSM) and the Forest Perimeter of Crasto (PFC). In those sites Blackwood grows in pure or mixed stands and get to considerable dimensions.
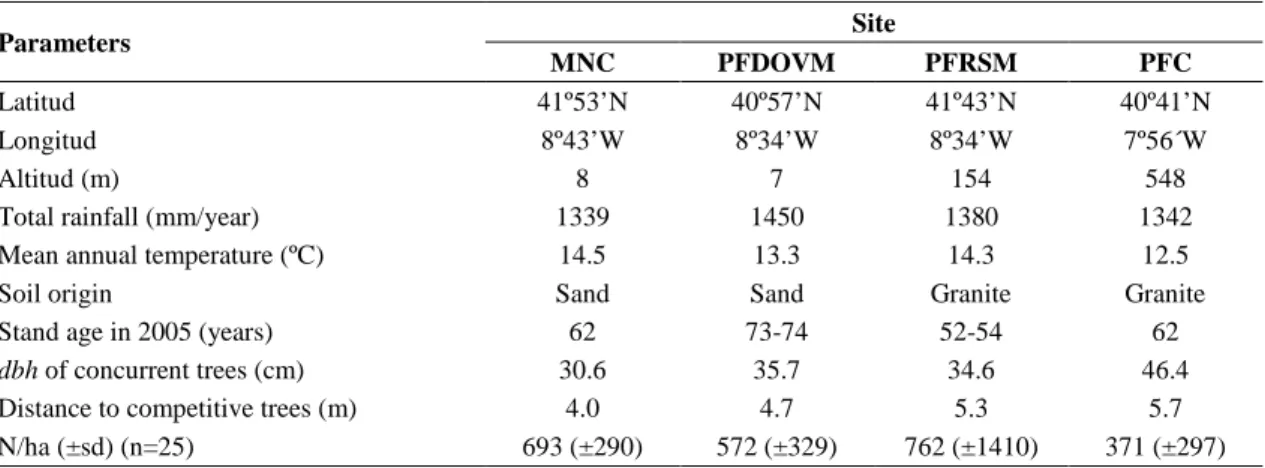
These sites are mixed production and recreation areas. Table 1 shows each region general characteristics: latitude between 40/42º N and longitude around 8º W; two sandy soils at sea level by the littoral, and two granite soils at 150 and 550 m of altitude; totals rainfall of more then 1300mm/year and mean temperatures between 12 and 14 ºC; stand ages in 2005 are between 50 and 75 years old. Mean dbh of the trees in concurrence with sample trees round 30 to 46 cm to the distance of around 4-5 m in littoral and 5-6 m far from the coast. The stand densities are low, quite diverse and variable.
Table 1. Localization, characteristics of the 4 forest sites, trees diameter and competition mean values. Tabela 1. Localização, características de 4 sítios florestais, diâmetro das árvores e distância de competição.
Five trees of 40 cm dbh class per site were sampled. The evaluation of early and latewood widths on the annual growth rings was semi-automatically carried out on 261 digital cross images of those 20 sample trees. Using a Kodak Megaplus Camera Model ES 1.0 and an objective COSMICAR/PENTAX TV 200m LENS 12,5–75 mm (1:1,8) those images were acquire. The measurements of growth rings were done by Wood Ring Analysis 1.0®.
Bark was also measured on disks N and S disks generatrixes. Radial annual increments and annual volumes were estimated using WinSTEMTM 2005ª® program.
Radial wood growth was studied from those data and modelled the total volume (v(dm3)) over-bark (vob) and under-over-bark (vub), using dbh(cm) over-over-bark and total height (h(m)) as independent variables. MNC, PFRSM, PFC and PFDOVM sites were the dummy variables.
Height linear and nine non-linear models were tested (Table 2). The regressions of non-linear models used Levenberg-Marquardt (EYNG, 2006) estimation method. For all statistical evaluation was used the SPSS 14® and STATISTICA 6.0®, software.
Parameters Site
MNC PFDOVM PFRSM PFC Latitud 41º53’N 40º57’N 41º43’N 40º41’N Longitud 8º43’W 8º34’W 8º34’W 7º56´W
Altitud (m) 8 7 154 548
Total rainfall (mm/year) 1339 1450 1380 1342 Mean annual temperature (ºC) 14.5 13.3 14.3 12.5 Soil origin Sand Sand Granite Granite Stand age in 2005 (years) 62 73-74 52-54 62
dbh of concurrent trees (cm) 30.6 35.7 34.6 46.4
Distance to competitive trees (m) 4.0 4.7 5.3 5.7 N/ha (±sd) (n=25) 693 (±290) 572 (±329) 762 (±1410) 371 (±297)
Table 2. Tested models. Tabela 2. Modelos testados.
Comparison of the estimates for the two fitted models was based on numerical and graphical analyses of the residuals. Two statistics were examined: the root mean square error (RMSE) and the coefficient of determination for nonlinear regression (R2). The expressions of these statistics were adjusted coefficient of determination, mean square, model critical error, mean square error, mean absolute residuals and mean of the residues.
Other important steps of models evaluation were the graphical analysis of the residuals and the examination of the fitted curves appearance overlaid on the trajectory of the dependent variables for each plot. Visual or graphical assessments are essential tools in selecting the most appropriate model because curve profiles may differ drastically, even if fit statistics and residuals are similar (HUANG et al., 2003; Dieguez-Aranda et al., 2006a; Barrio-Anta et al., 2006a).
RESULTS AND DISCUSSION Variation of the latewood volume
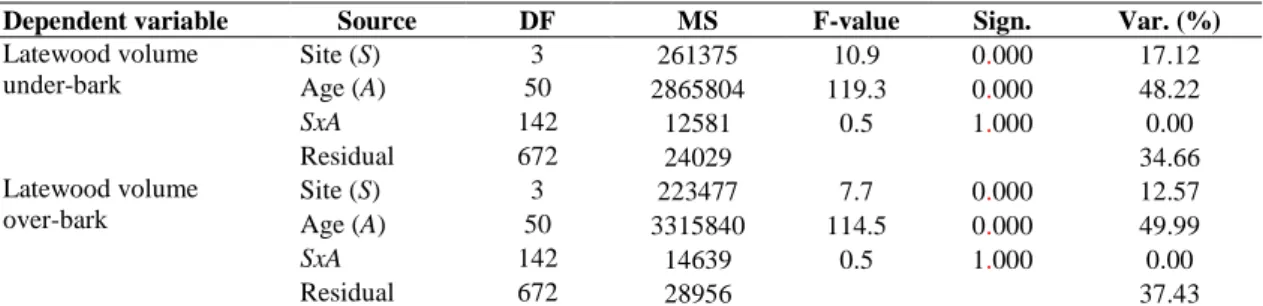
The ANOVA and the mean difference test Fisher LSD were performed to assess significant differences in the latewood volume, for site (S) and age of the trees (A) variation sources. The wood volumes under and over-bark were considered the dependent variable; these analyses are presented in table 3.
Table 3. Variance analysis of the different parameters, for site and age. Tabela 3. Análise de variância dos diferentes parâmetros por sítio e idade.
The tree age is a very significant factor of the latewood volume variation and explains 48 and 50% of the total volume variation respectively. Nevertheless, 35 and 37% of the total variation, which is referred to the natural sample variability, the experimental error and other factors not evaluated, integrates the residue. These values agree with those observed by Margarido et al. (2005) and Lousada (1999).
While the interaction does not show any significant influence on the volumes variation, sites effect is highly statistically significant and explains 17 and 13% of the total variation of the volumes
Nr Model Reference Nr Model Reference 1 v=β0+β1d 2 h Used and refered by Freire et al. (2003)a 9 v=e(β0+β1*(ln(h))^2+β2*ln(d)) Used and refered by Freire et al. (2003)a 2 v=β0+βdh2+β2d2 10 v=e(β0+β1*h+β2*ln(d)) 3 v=β0+β1d2h+β21/2√ d 11 v=e(β0+β1*(ln(h))^2+β2*(ln(d))^2) 4 v=β0+β1*(2√ d)*h+β2*1/2√ d+β3*d2 12 v=e(β0+β1*h+β2*(ln(d))^2) 5 v=β0+β1*h 2 +β2*d 2 +β3*1/ 2√ d 13 v=β1*d β2 *hβ3 6 v=β0+β1*d2+β2*h+β3*d2*h Veiga et al. (2000) 14 v=d2/(β0+β1/h) 7 v=β0+β1*d+β2*d2+β3*d*h+β4*d2*h 15 v=d2*(β0+β1*h) 8 v=β0+β1*d2+β2*d2*h+β3*d*h2+β4*h2 16 v=d2*h/(β0+β1*d) 17 v=β1*d β2
v: total volume (dm3); d: diameter at breast height over-bark (cm); h: total height (m); b0, b1, b2 and b3: model parameters
Dependent variable Source DF MS F-value Sign. Var. (%) Latewood volume under-bark Site (S) 3 261375 10.9 0.000 17.12 Age (A) 50 2865804 119.3 0.000 48.22 SxA 142 12581 0.5 1.000 0.00 Residual 672 24029 34.66 Latewood volume over-bark Site (S) 3 223477 7.7 0.000 12.57 Age (A) 50 3315840 114.5 0.000 49.99 SxA 142 14639 0.5 1.000 0.00 Residual 672 28956 37.43
under and over-bark. Then, can be concluded that the standard of variation for the additions of volume for each year and in the trees of the same site, is similar for all the sites.
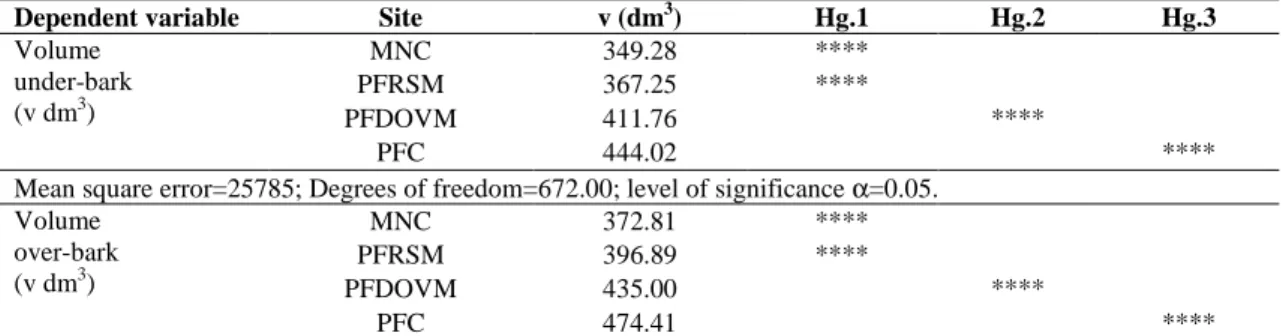
Fisher LSD test (Table 4) identifies one homogeneous group (Hg.1) composed by MNC and PFRSM. Those sites are statistically similar as confirms the average of its volumes. These sites are situated on the north of the Country and present higher averages of the number of trees per hectare and lower average of the dbh. The other two sites (PFDOVM and PFC) are statistically different and integrate Hg.2 and Hg.3 respectively; both are situated on central north of the country. The first one is the rainiest site and PFC shows the lowest values of stand density and highest of dbh, what fits well with its average of latewood production.
Table 4. Least significant difference for three site groups by Fisher LSD test to under-bark and over-bark total volumes.
Tabela 4. Diferença significante mínima para os grupos de sitios pelo teste de Fisher LSD para volume total com ou sem casca e de casca.
Modelling tree volume using ANOVA for variables group (sites) selection
After identifying the Hg, for each one were fitted the 17 models of table 2 and calculated the respective statistic parameters in order to find out the best to assess the tree volumes under and over-bark. The successive criteria used to perform that selection were:
• Pre-selection of the models that show the higher adjusted coefficient of determination (R2aj.); it happened to the equations numbers 2, 9, 11, 13, 14 and 16 for Hg.1 volume under-bark, and 2, 9, 11, 13 and 16 for Hg.1 volume over-bark;
• On that selection the next step was to find the models that presented minors values of the mean square (MS), critical error of the model (CEM), mean square error (MSE) and mean absolute residuals (MAR), so an acceptable appreciation of the residues plot; the method choose models numbers 2, 9 and 13 in both the volumes for Hg.1;
• The last criterion was to select by the minor value ofmean of the residues (MR); at first choice the model 2 performed a null value of this parameter for both volumes of Hg.1, but while the values of volume estimated for the mean fraction and the superior extremity of the data amplitude were good, the inferior one esteem negative values for h until about 11m in the class diameter of 5 cm dbh class. So it was rejected and the model number 13 (v=β 1*dβ2*hβ3), that it does not present this inconvenience, was selected.
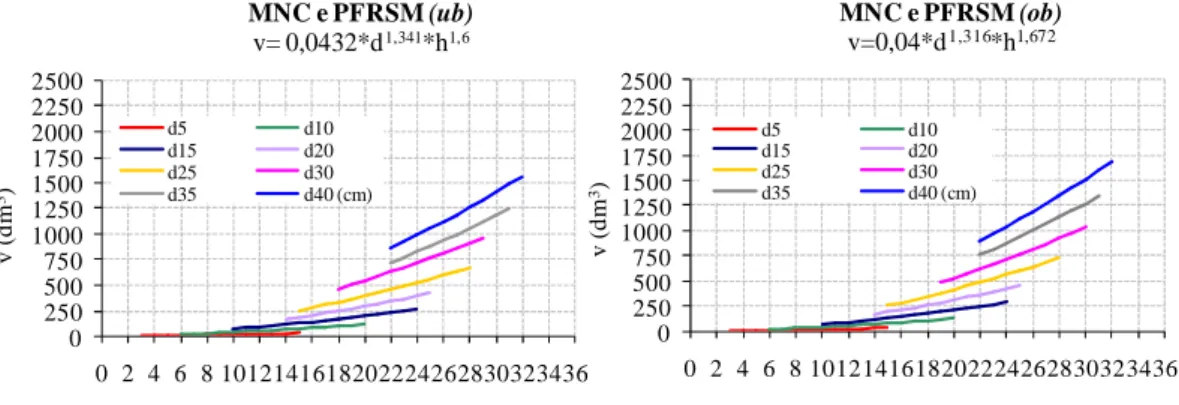
Figure 1 show the analytic and graphical predict values by model 13 for MNC and PFRSM, accorded with the classes of dbh and h.
Using the same criteria for Hg.2 the pre-selection (higher R2adj.) showed seven models (from number 9 to number 15) for under and over-bark.All these models presented reduced values and of the same magnitude for the statistics MS, CEM, MSE and MAR, but model 13 had better results.
The robustness of these models, evaluated by the MR, relapsed to models 9 and 2; however a superior value of F and the insignificant difference between the residues plots, made the model 13 the best choice.
Dependent variable Site v (dm3) Hg.1 Hg.2 Hg.3 Volume under-bark (v dm3) MNC 349.28 **** PFRSM 367.25 **** PFDOVM 411.76 **** PFC 444.02 ****
Mean square error=25785; Degrees of freedom=672.00; level of significance α=0.05. Volume over-bark (v dm3) MNC 372.81 **** PFRSM 396.89 **** PFDOVM 435.00 **** PFC 474.41 ****
The values assed using these models presented for Hg.2 reasonable values in the inferior extremity and good in the superior and mean fraction of data universe. Figure 2 show the analytic and graphical of predicting model 13 representations for PFDOVM, accorded with the classes of dbh and h.
Figure 1. Analytic expression and graphics predictions of the model 13 for tree volumes (v(dm3)) estimation (Hg.1), under-bark (ub) and over-bark (ob), in function of total height (h(m)) and per dbh class - d5(graph bottom), d10, d15, d20, d25, d30, d35, d40, d45(cm)(graph top) Figura 1. Expressão analítica e predição gráfica do modelo de 13 para estimativa de volumes das árvores
(Hg.1) (v (dm3)) sem (ub) com casca (ob), em função da altura total (h (m)) e por classe de diâmetro.
Figure 2. Analytic expression and graphics predictions of the model 13 for tree volumes (v(dm3)) estimation (Hg.2), under-bark (ub) and over-bark (ob), in function of total height (h(m)) and per dbh class - d5(graph bottom), d10, d15, d20, d25, d30, d35, d40, d45(cm)(graph top). Figura 2. Expressão analítica e predição gráfica modelo de 13 para estimativa de volumes (Hg.2) (v
(dm3)) (Hg.2), sem (ub) e com casca (ob), em função da altura total (h (m)) e por classe de DAP - D5.
The selection for Hg.3 group followed a similar processing as for the other two: the models 2, 9, 13, 16 and 17 were pointed out in the pre-selection for volumes under-bark. For over-bark the 9 and 17 models were excluded from that group. The models numbers 16 and 17 presented high CEM, and 9, 11 and 12 high CEM and MAR. So, all of them were excluded in this process phase.
From the remaining models – numbers 2, 9, 10 and 13 -, the model 2 presented more suitable value of MR. Although the values of volumes acceded using these model perform well the mean fraction and the superior extremity of data range, but in the inferior one (under and over-bark) esteem negative values for h until about the 6m, and in the dbh=5 cm class. This led to choose the model 13 as the best, because it does not present this inconvenience.
0 250 500 750 1000 1250 1500 1750 2000 2250 2500 0 2 4 6 8 1012141618202224262830323436 v ( d m 3) h (m) MNC e PFRSM (ub) v= 0,0432*d1,341*h1,6 d5 d10 d15 d20 d25 d30 d35 d40 (cm) 0 250 500 750 1000 1250 1500 1750 2000 2250 2500 0 2 4 6 8 1012141618202224262830323436 v ( d m 3) h (m) MNC e PFRSM (ob) v=0,04*d1,316*h1,672 d5 d10 d15 d20 d25 d30 d35 d40 (cm) 0 250 500 750 1000 1250 1500 1750 2000 2250 2500 0 2 4 6 8 1012141618202224262830323436 v ( d m 3) h (m) PFDOVM (ob) v=0,018*d1,904*h1,277 d5 d10 d15 d20 d25 d30 d35 d40 d45 (cm) 0 250 500 750 1000 1250 1500 1750 2000 2250 2500 0 2 4 6 8 1012141618202224262830323436 v ( d m 3) h (m) PFDOVM (ub) v=0,0166*d1,915*h1,273 d5 d10 d15 d20 d25 d30 d35 d40 d45 (cm)
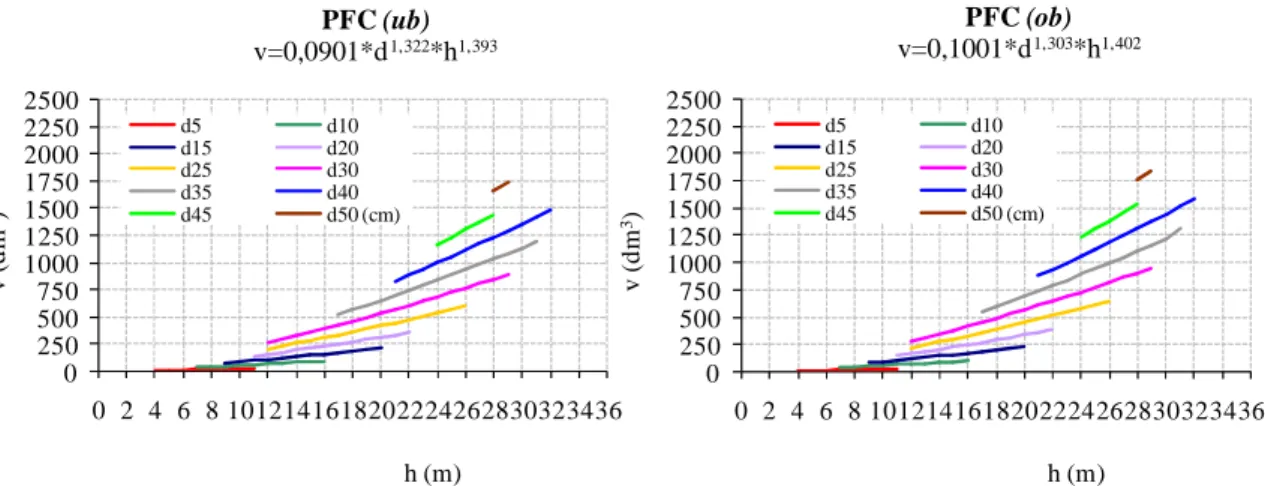
Figure 3 show the predicted values using model 13, in analytical and graphical expressions, for under and over-bark tree volumes of PFC, in function of diverse classes of dbh and h of the trees studied sample.
P-value always assumed identical and null values for all the pre-selected models, reason why it did never constituted factor of final selection.
This pack of volume models become possible to estimate the volume of given alive tree sample, with or without bark and considering the reference of the geographic region in the north of Portugal, and use it to evaluate the volumes for the stand. It can be a quite useful tool for A. melanoxylon stands management.
Figure 3. Analytic expression and graphics predictions of the model 13 for tree volumes (v(dm3)) estimation (Hg.3), under-bark (ub) and over-bark (ob), in function of total height (h(m)) and per dbh class - d5(graph bottom), d10, d15, d20, d25, d30, d35, d40, d45(cm)(graph top). Figura 3. Expressão analítica e predição gráfica modelo de 13 para estimativa de volumes (Hg.3) (v
(dm3)), sem (ub) e com casca (ob), em função da altura total (h (m)) e por classe de DAP - D5.
Tree volume models using sites as dummy variables
Tables 5 and 6 show the results of fittings to all models of table 2 for under and over-bark of trunk total volumes. The process used to select the best models was the following:
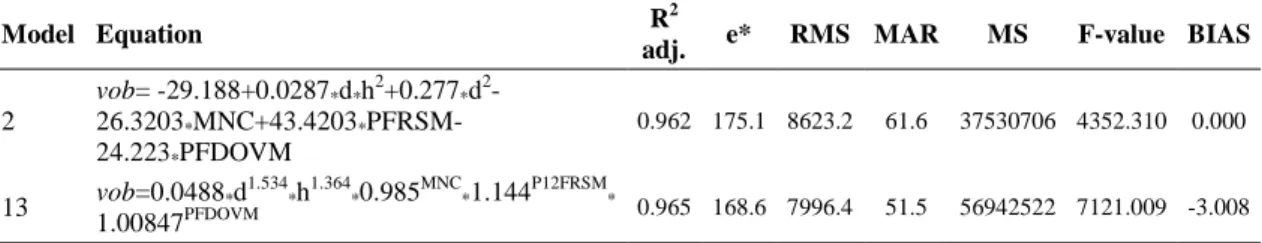
1- To the volume under-bark the models 13 and 14 were pre-selected because they reveal the highest values of R2adj so as the significative coefficients of the independent variables; the models 2 and 13 were selected for over-bark.
2- The smaller values maximum expected errors (e*), residual mean square (RMS) and MAR, higher of MS and significant test F, mean residual errors (BIAS) near zero and acceptable residuals plot were the statistical reasons to elect the best fitted model.
Table 5. Statistical fittings of models for volumes (dm3) under-bark (vub); dbh is d(cm) and total height is h(m).
Tabela 5. Estatísticas de ajuste de modelos de volumes (dm3) sem casca (vub), DAP é d (cm) e altura total é de h (m).
Model Equation R2adj. e* RMS MAR MS F-value BIAS
13 vub=0.0466*d 1.543 *h 1.348 *0.988 MNC *1.126 PFRSM * 1.023PFDOVM 0.966 155.2 6775.5 47.5 49914726 7366.980 -2.588 14 vub=d 2 /(0.3+29.157/h-0.116* MNC-0.276*PFRSM-0.2102*PFDOVM) 0.956 176.3 8744.0 52.2 59556545 6811.123 8.117
R2 adj: adjusted determination coefficient; e*: maximum expected errors ; RMS: residual mean square ; MAR: mean absolute
residual; MS: mean square error; BIAS: mean residual errors
0 250 500 750 1000 1250 1500 1750 2000 2250 2500 0 2 4 6 8 1012141618202224262830323436 v ( d m 3) h (m) PFC (ub) v=0,0901*d1,322*h1,393 d5 d10 d15 d20 d25 d30 d35 d40 d45 d50 (cm) 0 250 500 750 1000 1250 1500 1750 2000 2250 2500 0 2 4 6 8 1012141618202224262830323436 v ( d m 3) h (m) PFC (ob) v=0,1001*d1,303*h1,402 d5 d10 d15 d20 d25 d30 d35 d40 d45 d50 (cm)
That process point out the model number 13 as the better to satisfy those criteria. So, that non-linear model was selected for both, under and over-bark estimation volumes.
Trees age is responsible for around 49% of latewood volume entirely variation, considered under and over-bark. Site explains around 15% and the interaction effect is not significant.
About tree volume averages sampled to the four sites, the homogeneity statistics of the respective data considered three homogeneous groups - separately the central northern sites (PFDOVM close to littoral and PFC more interior) and the northern group, composed by MNC/PFRSM. This grouping determined the three separated models used in the first method.
For the processing of those models only one model type was chosen (v=β 1*dβ2*hβ3), both for under-bark and for over-bark estimations. As it was expected, the determined coefficients are rather similar considering the existence or not of bark. The expressive differences are noted from one to another homogeneous site group.
The higher estimations tend to be found in the central sites. The volumes are superior for PFC and inferiors for PFDOVM until the dbh=20 cm class. In the diameter classes of 25 and 30 cm, the volumes calculated for site PFC and group MNC/PFRSM are very similar and superior to the ones of the PFDOVM. However, it is for raised class of diameter more than to site that PFDOVM reaches the superior volumes and the PFC the inferiors.
Table 6. Statistical fittings of models for volumes (dm3) over-bark (vob); dbh is d(cm) and total height is h(m).
Tabela 6. Estatísticas de ajuste de modelos de volumes (dm3) com casca (vub), DAP é d (cm) e altura total é de h (m).
In all the homogeneous groups, coefficient values and the power degrees of the variables are reduced but positive. They vary between 0.0432 and 1.915; therefore they softly portray the waited variation of volume for unitary variation of diameter and/or total height.
The volumes esteemed over-bark generate, of course, slightly superior values to the ones under-bark. This divergence represents about 6% of the volume with over-bark in PFDOVM, 8% in PFC and 10% in MNC/PFRSM group.
Dummy variables method, that chose the same type of model (v=β 1*d β2
*hβ3), disclose the advantage of being needless to adopt preliminary decisions about grouping sites. Under or over-bark, the estimated volumes for PFC, MNC and PFDOVM sites are quite similar; however 13 or 14% lower to the values for PFRSM. These models expecterrors of about 155 dm3 for vub and 169dm3 for vob. This fact indicate that the estimated maximum errors represent 11.4 and 11.6% respectively, corresponding, in average,to maximum tree volumes of 1362(±312)dm3 and 1459(±329)dm3.
CONCLUSIONS
• Two statistical ways were used to construct whole tree volume estimation models. The first one utilizes ANOVA to establish the eventual differences between samples sites, and the second employ the sites as dummy variables.
• With this models it was possible conclude that trees age is responsible for around 49% of latewood volume entirely variation, considered under and over-bark. The variation between sites explains around 15% of the total variation.
Model Equation R
2
adj. e* RMS MAR MS F-value BIAS
2 vob= -29.188+0.0287*d*h2+0.277*d2 -26.3203*MNC+43.4203* PFRSM-24.223*PFDOVM 0.962 175.1 8623.2 61.6 37530706 4352.310 0.000 13 vob=0.0488*d 1.534 *h 1.364 *0.985 MNC *1.144 P12FRSM * 1.00847PFDOVM 0.965 168.6 7996.4 51.5 56942522 7121.009 -3.008
R2 adj: adjusted determination coefficient; e*: maximum expected errors ; RMS: residual mean square ; MAR: mean absolute
• The different studied sites have different growth behaviour. The central northern sites (PFDOVM close to littoral and PFC more interior) present a different growth behaviour from the northern group (MNC/PFRSM).
• The best model to estimate under-bark and over-bark wood volumes was v=β 1*d β2
*hβ3, that disclose critical errors between 72 and 195 dm3 under-bark and 82 and 212dm3 over-bark.
• This stand tree volumes estimation model uses sites as dummy variables and performs maximum expected errors of 155 dm3 and 169dm3, corresponding to mean maximum volumes of 1362dm3 (11.3%) under-bark and 1459 dm3 (11.6%) over-bark.
REFERENCES
BARRIO-ANTA, M.; BALBOA-MURIAS, M.; CASTEDO-DORADO, F.; DIÉGUEZ-ARANDA, U.; ÁLVAREZ-GONZÁLEZ, J. An ecoregional model for estimating volume, biomass and carbon pools in maritime pine stands in Galicia (northwestern Spain). Forest Ecology and Management, v. 223, Issues 1-3, p. 24-34, 2006.
DIÉGUEZ-ARANDA, U.; CASTEDO-DORADO, F.; ÁLVAREZ-GONZÁLEZ, J.; ROJO-ALBORECA, A. Dynamic growth model for Scots pine (Pinus sylvestris L.) plantations in Galicia (north-western Spain). Ecological Modelling, v. 191, n. 2, p. 225-242, 2006.
EYNG, E. Controle feedforward baseado em redes neurais aplicado a coluna de absorção do
processo de produção de etanol. Dissertação (Mestrado em Engenharia Química) – Universidade de
Campinas, 2006.
FREIRE, J.; TOMÉ, M.; TAVARES, M. Equação de volume local para a Pinus pinaster Aiton na Serra da Lousã. Silva Lusitana, v. 11, n. 2, p. 207-215, 2003a.
FREIRE, J.; TAVARES, M.; CAMPOS, J. Ritmos de Crescimento das Espécies Pinus pinaster, Acacia melanoxylon e Acacia dealbata nas Dunas do Litoral Norte e Centro. Silva Lusitana, v. 11, n. 1, p. 67-76, 2003b.
GOES, H. A Floresta Portuguesa: sua importância e descrição das espécies de maior interesse. Portucel. p. 259, 1991.
HUANG, W.; POHJONEN V.; JOHANSSON S.; NASHANDA M.; KATIGULA M.; LUUKKANEN, O. Species diversity, forest structure and species composition in Tanzanian tropical forests. Forest
Ecology and Management, v. 173, n. 1-3, p. 11-24, 2003.
LOUSADA, J. Variação fenotípica e genética em características estruturais na madeira de Pinus pinaster Ait. Dissertação (Doutorado em Engenharia Florestal) – Universidade de Trás-os-Montes e Alto Douro, 1999. MARGARIDO, M.; PINTO, I.; PEREIRA, H.; USENIUS, A.; ANJOS, O. Caracterização da variação
da espessura dos anéis de crescimento em pinheiro-bravo. Actas do 5º Congresso Florestal Nacional,
R. Silva & F. Páscoa Eds., 2005.
NICHOLAS, I.; BROWN, I. Blackwood: A handbook for growers and users. Forest Research Bulletin. Rotorua, New Zealand. n. 225, p. 100, 2002.
P-Clima. Software Provedor de Dados Climatológicos para Portugal. Versão 1.2. Projecto ALTENER XVII/4.1013/Z/96-092. (Ed.) R. Aguiar, INETI/DER, Lisboa, 1999.
RUCHA, A.; SANTOS, A.; CAMPOS, J.; ANJOS, O.; TAVARES, M. (2007). Annual growth rings thickness and tree total volume estimate of Acacia melanoxylon in Portugal. In Proceeding of Wood Science and Engineering in the Third Millennium, ICWSE 2007. Brasov, June 20-22, Roménia, p. 100-107.
SANTOS, A.; ANJOS, O.; SIMÕES, R. Papermaking potential of Acacia dealbata and Acacia melanoxylon. Appita Journal, v. 59, n. 1, 2006.
SANTOS, A.; TEIXEIRA, A.; ANJOS, O.; SIMÕES, R.; NUNES, L.; MACHADO, J.; TAVARES, M. Utilização potencial do lenho de Acacia melanoxylon a crescer em povoamentos puros ou mistos com Pinus pinaster pela Indústria Florestal Portuguesa. Silva Lusitana, v. 15, n. 1, p. 57-77, 2007.
SOUSA, A. Tabelas de volume para Acacia melanoxylon na Ilha de S. Miguel (Açores). Circunscrição Florestal de Ponta Delgada, v. 2, 1974.
TAVARES, M.; CAMPOS, J.; SAPORITI, J.; DANIEL, C. Formas de valorização do material lenhoso
das Acacia deabata, A. melanoxylon e A. longifolia. Actas do 1º Encontro sobre Invasoras Lenhosas.
Sociedade Portuguesa de Ciências Florestais, Gerês. v. 1, p. 157. 1999a.
TAVARES, M.; CAETANO, F.; FREIRE, J.; SILVA, C.; CAMPOS, J. Dinâmica de crescimento das A. deabata, A. melanoxylon e A. longifolia em terrenos de pinhal das dunas litorais. 1º Encontro sobre Invasoras Lenhosas. Sociedade Portuguesa de Ciências Florestais, Gerês. v. 1, p. 89, 1999b.
VEIGA, R.; CARVALHO, C.; BRASIL, M. Determinação de equações de volume para árvores de Acacia mangium Willd. Revista CERNE, v. 6, n. 1, p. 103-107, 2000.