Pesq. agropec. bras., Brasília, v.48, n.8, p.1012-1020, ago. 2013 DOI: 10.1590/S0100-204X2013000800029
Lysine and arginine requirements of
Salminus brasiliensis
Jony Koji Dairiki(1), Ricardo Borghesi(2), Carlos Tadeu dos Santos Dias(3)
and José Eurico Possebon Cyrino(3)
(1)Embrapa Amazônia Ocidental, Rodovia AM‑10, Km 29, Caixa Postal 319, CEP 69011‑970 Manaus, AM, Brazil. E‑mail: jony.dairiki@embrapa.br (2)Embrapa Pantanal, Rua 21 de Setembro, Nossa Senhora de Fátima, Caixa Postal 109, CEP 79320‑900 Corumbá, MS, Brazil. E‑mail: ricardo.borghesi@embrapa.br (3)Universidade de São Paulo, Escola Superior de Agricultura Luiz de Queiroz, Avenida Pádua Dias, no 11, Caixa Postal 9, CEP 13418‑900 Piracicaba, SP, Brazil. E‑mail: ctsdias@usp.br, jepcyrino@usp.br
Abstract – The objective of this work was to determine the dietary lysine (DL) and dietary arginine (DA) requirements of dourado (Salminus brasiliensis), through dose‑response trials using the amino acid profiles of whole carcasses as a reference. Two experiments were carried out in a completely randomized design (n=4). In the first experiment, groups of 12 feed‑conditioned dourado juveniles (11.4±0.2 g) were stocked in 60 L cages placed in 300 L plastic indoor tanks in a closed circulation system. Fish were fed for 60 days on diets containing 1.0, 1.5, 2.0, 2.5, 3.0, or 3.5 % dietary lysine. In the second experiment, dourado juveniles (27.0±0.8 g) were fed for 60 days on semipurified diets containing arginine at 1.0, 1.5, 2.0, 2.5 or 3.0%, in similar conditions to those of the first experiment. Optimal DL requirements, as determined by broken‑line analysis method for final weight, weight gain and specific growth rate, were 2.15% DL or 5% lysine in dietary protein, and 1.48% DA or 3.43% arginine in dietary protein. The best feed conversion ratio is attained with 2.5% DL or 5.8% lysine in dietary protein and 1.4% DA or 3.25% arginine in dietary protein.
Index terms: amino acid, dose‑response, dourado, regression.
Exigências do
Salminus brasiliensis
em lisina e arginina
Resumo – O objetivo deste trabalho foi determinar as exigências do dourado (Salminus brasiliensis) em lisina dietética (LD) e arginina dietética (AD), por meio de ensaios dose‑resposta, com uso do perfil de aminoácidos de carcaças inteiras como referência. Dois experimentos foram feitos em delineamento interamente casualizado (n=4). No primeiro experimento, grupos de 12 juvenis de dourado (11,4±0,2 g), condicionados a aceitar ração, foram estocados em gaiolas de 60 L, colocadas em tanques de plástico de 300 L protegidos em um sistema fechado de circulação de água. Os peixes foram alimentados por 60 dias com rações que continham 1,0, 1,5, 2,0, 2,5, 3,0 ou 3,5% de lisina dietética. No segundo experimento, juvenis de dourado (27,0±0,8 g) foram alimentados por 60 dias com rações semipurificadas que continham 1,0 1,5, 2,0, 2,5 ou 3,0% de arginina, em condições semelhantes às do primeiro experimento. A exigência ótima de LD, determinada pelo método da regressão “broken‑line”, quanto ao peso final, ganho de peso e quanto à taxa de crescimento específico, foi de 2,15% de LD ou 5% de lisina, na proteína dietética, e de 1,48% de AD ou 3,43% de arginina na proteína dietética. A melhor taxa de conversão alimentar é obtida com 2,5% de LD ou 5,8% de lisina, na proteína dietética, e com 1,4% de AD ou 3,25% de arginina na proteína dietética.
Termos para indexação: aminoácido, dose‑reposta, dourado, regressão.
Introduction
Dourado [Salminus brasiliensis (Cuvier, 1816)] is one of the largest South American Characins, it
dwells in the Paraná, Paraguay, and Uruguay rivers,
the segments of the greater Prata Basin, as well, in
Brazilian São Francisco River Basin (Fracalossi et al.,
2004). Dourado is a highly valued species for sport
fishing, and prized for its excellent flesh quality and
accelerated growth rate, which triggered interest in the use of the species for farming purposes in the late 1990s.
Proteins represent 65‑75% of any given fish carcass
dry mass. The biological value of any dietary protein varies with its amino acid composition and availability. Daily requirements for a given amino acid are the sum of requirements for maintenance processes and for
tissue growth (Liebert, 2005). Dietary deficiency or
low‑essential amino acid availability hampers protein
use by fish and, consequently, reduces feed efficiency
and growth rate.
L‑lysine is the third most abundantly produced
amino acid by the feed industry, 80% by fermentation
and 20% by chemical synthesis (Coello et al., 2002).
and can be used as reference for dietary amino acid requirements because it is strictly essential and associated only to body protein deposition (Dairiki et al., 2007). Low‑dietary lysine contents, for instance, reduce collagen synthesis and deposition of rainbow trout [Oncorhynchus mykiss (Walbaum, 1792)]. Adequate dietary lysine contents improve survival and growth rate, and prevents erosion and deformities
of fish dorsal, pectoral and ventral fins. Lysine requirements of fish range between 5.0 and 6.8% of
dietary protein, and the highest values are ordinarily
related to nutritional requirements of carnivorous fish
(National Research Council, 1993).
Arginine is a basic amino acid (isoelectrical point
pH=11.1) which is essential for fish (Lall et al., 1994; Kuçukbay et al., 2008). However, in contrast to lysine,
arginine is not one of the most limiting amino acids
in ingredients for fish diets. Arginine requirements of fish vary from 1.0 to 2.8% of the diet, or 3.3 to 6.0% of
the dietary protein (National Research Council, 1993). Arginine is involved in many metabolic pathways, such as protein synthesis, urea production, glutamic acid and proline metabolism, and the synthesis of creatine, nitric oxide and polyamine (Nikolic et al., 2007). Arginine is also a key component of seminal plasma and
spermatozoa (Lahnsteiner, 2009). In freshwater fish,
the activity of the urea cycle – a pathway for arginine synthesis – is very low in comparison to that occurring
in mammals, so that arginine deficiency swiftly affects growth and protein retention in fish (Abidi & Khan,
2009). Furthermore, arginine is considered to improve the immune system (Pohlenz et al., 2012).
The analysis of dose‑response trial data of nutritional requirements through the broken‑line regression analysis method elicits the accurate determination of the minimum level of a given nutrient, which guarantees the optimized performance of a species. This is considered an important determinant of the
cost‑benefit relationship for formulation of fish feeds. Using this method through the SAS PROC
NLIN procedure is a simple, fast and precise way for determining nutritional requirements. However, results can underestimate values determined by traditionally used models, which may not be necessarily more precise (Portz et al., 2000).
Knowing the lysine and arginine requirements can help in the use of surrogate protein sources to formulate
and process commercial diets for dourado, fostering
the use of this species for freshwater fish culture.
The objective of this work was to determine the dietary lysine (DL) and dietary arginine (DA) requirements of dourado, through dose‑response trials
using the amino acid profiles of whole carcasses as a
reference.
Materials and Methods
Two trials were conducted in the Sector de
Piscicultura, Departamento de Zootecnia, Universidade de São Paulo, Escola Superior de Agricultura Luiz
de Queiroz, Piracicaba, SP, Brazil (22º42'30"S,
47º38'00"W, 546 m altitude), between September 2007 and March 2008.
In the first experiment, feed‑conditioned dourado juveniles (11.4±0.2 g; 9.4±0.9 cm) were fed to apparent satiety (at 8, 11, 14 and 17 h), for 60 days, with semipurified diets (National Research Council, 1993)
containing 1.0, 1.5, 2.0, 2.5, 3.0, and 3.5% lysine, in a totally randomized experimental design trial (n=4).
Trial was set up in 60 L plastic cages (5 mm mesh, 12 fish per cage) installed in 300 L indoor plastic tanks with closed recirculation, continuous water flow and
aeration system.
In the second experiment, feed‑conditioned dourado
juveniles (27.0±0,8 g; 12.6±0,7 cm) were fed with semipurified diets (National Research Council, 1993)
containing graded levels – 1.0, 1.5, 2.0, 2.5 and 3.0% of arginine –, in a totally randomized experimental design trial (n=4), and in the same feeding conditions. Trial was set up in 300 L indoor plastic tanks in a closed
recirculation, continuous water flow and aeration
system. Performance parameters recorded, for both
trials, were: initial weight (IW); final weight (FW); weight gain (WG = FW ‑ IW); feed consumption (FC); feed conversion ratio (FCR = FC ÷ WG); specific
growth rate [SGR = (ln FW – ln IW) ÷ number of days
x 100]; and survival rate (%).
Diets formulated to contain 43% crude protein,
4,600 kcal kg‑1 crude energy, and amino acid profiles of whole carcasses of fish of different size classes were used as reference of the dietary amino acid profile
(Table 1). Fishmeal (FM) was used as the primary
protein source; synthetic amino acids were added to
equalize amino acid contents of FM to the reference
Pesq. agropec. bras., Brasília, v.48, n.8, p.1012‑1020, ago. 2013 DOI: 10.1590/S0100‑204X2013000800029
added to the different treatments, replacing aspartic and glutamic acid in the basal diet (Table 2).
Feed ingredients were mixed, added with 10%
water, neutralized with NaOH, pelleted in an industrial
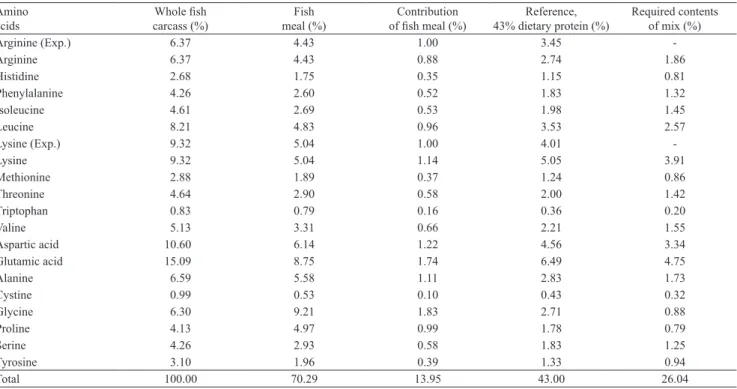
Table 1. Composition of the synthetic amino acid mix used in the experiment with dourado (Salminus brasiliensis), considering 1.0% of lysine and arginine inclusion in the basal diet.
Amino acids
Whole fish carcass (%)
Fish meal (%)
Contribution
of fish meal (%) 43% dietary protein (%)Reference,
Required contents of mix (%)
Arginine (Exp.) 6.37 4.43 1.00 3.45 ‑
Arginine 6.37 4.43 0.88 2.74 1.86
Histidine 2.68 1.75 0.35 1.15 0.81
Phenylalanine 4.26 2.60 0.52 1.83 1.32
Isoleucine 4.61 2.69 0.53 1.98 1.45
Leucine 8.21 4.83 0.96 3.53 2.57
Lysine (Exp.) 9.32 5.04 1.00 4.01 ‑
Lysine 9.32 5.04 1.14 5.05 3.91
Methionine 2.88 1.89 0.37 1.24 0.86
Threonine 4.64 2.90 0.58 2.00 1.42
Triptophan 0.83 0.79 0.16 0.36 0.20
Valine 5.13 3.31 0.66 2.21 1.55
Aspartic acid 10.60 6.14 1.22 4.56 3.34
Glutamic acid 15.09 8.75 1.74 6.49 4.75
Alanine 6.59 5.58 1.11 2.83 1.73
Cystine 0.99 0.53 0.10 0.43 0.32
Glycine 6.30 9.21 1.83 2.71 0.88
Proline 4.13 4.97 0.99 1.78 0.79
Serine 4.26 2.93 0.58 1.83 1.25
Tyrosine 3.10 1.96 0.39 1.33 0.94
Total 100.00 70.29 13.95 43.00 26.04
Arginine (Exp.), experimental testing for arginine. Lysine (Exp.), experimental testing for Lysine.
Table 2. Experimental diets for dourado (Salminus brasiliensis) (43% crude protein, 4,600 kcal kg‑1 gross energy), lysine and
arginine experiments.
Ingredient Lysine level (%) Arginine level (%)
1.0 1.5 2.0 2.5 3.0 3.5 1.0 1.5 2.0 2.5 3.0
Amino acid mix(1) 26.82 26.82 26.82 26.82 26.82 26.82 25.96 25.96 25.96 25.96 25.96
Fish meal 19.84 19.84 19.84 19.84 19.84 19.84 22.56 22.56 22.56 22.56 22.56
Mineral mix(2) 1.00 1.00 1.00 1.00 1.00 1.00 1.00 1.00 1.00 1.00 1.00
Vitamin mix(3) 2.00 2.00 2.00 2.00 2.00 2.00 2.00 2.00 2.00 2.00 2.00
Dicalcium phosphate 1.00 1.00 1.00 1.00 1.00 1.00 1.00 1.00 1.00 1.00 1.00
BHT 0.02 0.02 0.02 0.02 0.02 0.02 0.02 0.02 0.02 0.02 0.02
Carboxymethyl celulose 2.00 2.00 2.00 2.00 2.00 2.00 2.00 2.00 2.00 2.00 2.00
Dextrin 23.00 22.74 22.82 23.50 23.25 23.74 15.40 15.50 15.59 15.64 15.69
Salmon oil 13.14 12.92 12.71 12.55 12.30 12.14 15.60 15.42 15.24 15.10 14.96
Celulose 8.14 8.50 8.50 7.82 8.24 7.76 8.50 8.50 8.50 8.50 8.50
Aspartic acid(6) 1.52 1.28 1.04 0.80 0.56 0.37 0.73 0.31 0.00 0.00 0.00
Glutamic acid(6) 1.52 1.28 1.04 0.79 0.55 0.25 1.23 1.23 1.13 0.72 0.31
Lysine 0.00(4) 0.61(5) 1.21(5) 1.82(5) 2.42(5) 3.03(5) ‑ ‑ ‑ ‑ ‑
Arginine ‑ ‑ ‑ ‑ ‑ ‑ 0.00(4) 0.59(5) 1.19(5) 1.78(5) 2.38(5)
Total 100.00 100.00 100.00 100.00 100.00 100.00 100.00 100.00 100.00 100.00 100.00
(1)Correction for the synthetic amino acid active principle. (2)Mineral mix (Agroceres) per kg of product: Fe, 100,000 mg; Cu, 15,000 mg; Zn, 150,000 mg;
I, 4,500 mg; Mn, 60,000 mg; Se, 400 mg; and Co, 2,000 mg. (3)Vitamin mix (Agroceres) per kilogramme of product: vitamin A, 6,000.000 UI; vitamin D3,
2,250,000 UI; vitamin E, 75,000 mg; vitamin K, 3,000 mg; thiamine (B1), 5,000 mg; riboflavin (B2), 10,000 mg; niacin, 30,000 mg; pyridoxine, 8,000 mg;
pantothenic acid, 30,000 mg; biotin, 2,000 mg; folic acid, 3,000 mg; cobalamin, 20,000 mg; ascorbic acid (vitamin C), 192,500 mg.(4)1% of lysine or arginine
deriving from the fish meal. (5)Inclusion of the synthetic lysine (80.6% of L‑lysine HCl) and synthetic arginine (81.5% of L‑arginine). (6)Mixture of aspartic
mincer, oven‑dried (forced‑air circulation at 45°C for 24 hours), broken down to 1‑2 mm pellets which were sized, seal‑bagged, and freeze‑stored (‑20°C) before use. Procedures followed recommendations of Luo
et al. (2006) and Montes‑Girao & Fracalossi (2006).
Laboratory light conditions were 12 hours of light and 12 hours of dark. Feed for immediate use was kept in plastic containers under refrigeration. Apparent feed consumption was estimated by weighting feed containers every three days. Water temperature was taken on a daily basis, and dissolved oxygen and pH were gauged twice a week with electronic
devices (temperature, 26.7±1.6°C and 26.5±1.6°C; dissolved oxygen, 5.1±0.8 mg L‑1 and 6.1±0.5 mg L‑1; pH = 7.5±0.04 and 7.5±0.02 for lysine and arginine
trials, respectively). Tanks were screened daily for
mortality and signs of nutritional deficiencies. At the end of the feeding trial, 12 fish per treatment were randomly sampled, sacrificed by anesthetic overdose,
ground and freeze‑stored for posterior whole body chemical analysis (Horwitz, 2000).
Data obtained for lysine and arginine experiments were analyzed individually and were submitted to
Anova by the PROC GLM, SAS statistical package. Regression and broken‑line analysis (PROC NLIN,
SAS) (Portz et al., 2000) were used for decomposition of
the ANOVA results. Performance data were submitted
to exploratory analysis by outlier data test, variance homogeneity and range of the response variable. In
both experiments, data on feed conversion ratio (FCR) of a single replicate of treatment at 1.0% dietary lysine and 3.0% dietary arginine were detected as outliers and were, therefore, disregarded for analysis.
Results and Discussion
In the lysine experiment, treatment means differed
(p<0.05) for final weight (FW), weight gain (WG), feed consumption (FC), specific growth rate (SGR)
and feed conversion rate (FCR) (Table 3). Foster
& Ogata (1998) reported that juveniles of Japanese flounder [Paralichthys olivaceus (Temminck & Schlegel, 1846)] fed lysine‑deficient diets showed an abnormal colour pattern. Caudal fin erosion was also reported by Ketola (1983) for rainbow trout (1.1 g) fed lysine‑deficient diets. No external deficiency signs or
body deformities were registered for dourado juveniles in the present study, regardless of DL level.
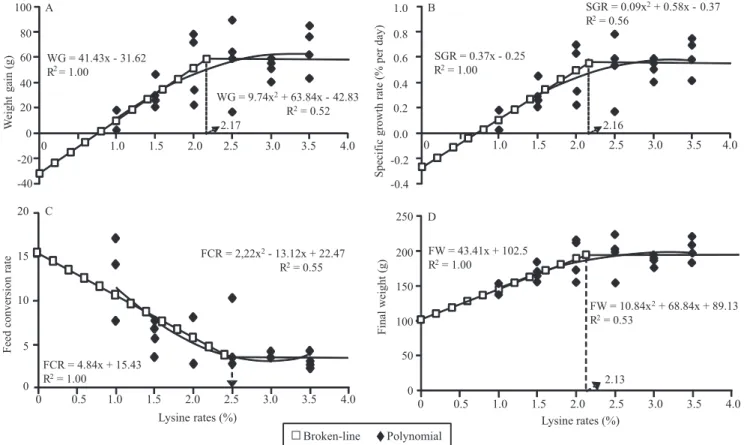
Using the broken‑line method yielded an estimated,
optimum level (break point) of lysine for maximum FW (195 g) equal to 2.13% of DL, or 4.95% of lysine in the dietary protein (LDP) (Figure 1).
Optimum, calculated DL levels for WG (58.28 g)
were 2.17% of DL (5.04% of LDP). Citations in the
literature show DL values that vary between 1.36% (4.5% LPD) for jundiá [Rhamdia quelen (Quoy & Gaimard, 1824)] (Montes‑Girao & Fracalossi, 2006) and 2.83% (5.56% LDP) for grouper [Epinephelus coioides (Bloch, 1793)] (Luo et al., 2006), as well
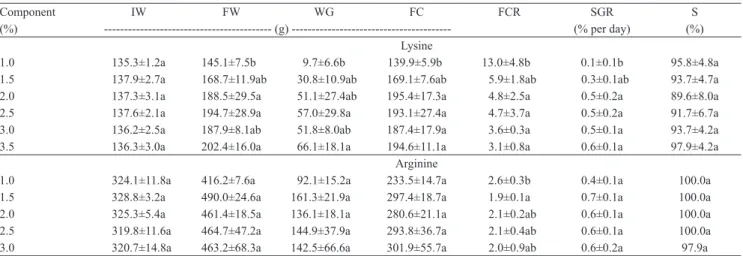
Table 3. Performance parameters of dourado (Salminus brasiliensis) juveniles fed diets with increasing levels of lysine and arginine(1).
Component IW FW WG FC FCR SGR S
(%) ‑‑‑‑‑‑‑‑‑‑‑‑‑‑‑‑‑‑‑‑‑‑‑‑‑‑‑‑‑‑‑‑‑‑‑‑‑‑‑‑‑‑ (g) ‑‑‑‑‑‑‑‑‑‑‑‑‑‑‑‑‑‑‑‑‑‑‑‑‑‑‑‑‑‑‑‑‑‑‑‑‑‑‑‑ (% per day) (%) Lysine
1.0 135.3±1.2a 145.1±7.5b 9.7±6.6b 139.9±5.9b 13.0±4.8b 0.1±0.1b 95.8±4.8a
1.5 137.9±2.7a 168.7±11.9ab 30.8±10.9ab 169.1±7.6ab 5.9±1.8ab 0.3±0.1ab 93.7±4.7a
2.0 137.3±3.1a 188.5±29.5a 51.1±27.4ab 195.4±17.3a 4.8±2.5a 0.5±0.2a 89.6±8.0a
2.5 137.6±2.1a 194.7±28.9a 57.0±29.8a 193.1±27.4a 4.7±3.7a 0.5±0.2a 91.7±6.7a
3.0 136.2±2.5a 187.9±8.1ab 51.8±8.0ab 187.4±17.9a 3.6±0.3a 0.5±0.1a 93.7±4.2a
3.5 136.3±3.0a 202.4±16.0a 66.1±18.1a 194.6±11.1a 3.1±0.8a 0.6±0.1a 97.9±4.2a
Arginine
1.0 324.1±11.8a 416.2±7.6a 92.1±15.2a 233.5±14.7a 2.6±0.3b 0.4±0.1a 100.0a
1.5 328.8±3.2a 490.0±24.6a 161.3±21.9a 297.4±18.7a 1.9±0.1a 0.7±0.1a 100.0a
2.0 325.3±5.4a 461.4±18.5a 136.1±18.1a 280.6±21.1a 2.1±0.2ab 0.6±0.1a 100.0a
2.5 319.8±11.6a 464.7±47.2a 144.9±37.9a 293.8±36.7a 2.1±0.4ab 0.6±0.1a 100.0a
3.0 320.7±14.8a 463.2±68.3a 142.5±66.6a 301.9±55.7a 2.0±0.9ab 0.6±0.2a 97.9a
IW, initial weight; FW, final weight; WG, weight gain; FC, feed consumption; FCR, feed conversion rate; SGR, specific growth rate; S, survival rate.
Pesq. agropec. bras., Brasília, v.48, n.8, p.1012‑1020, ago. 2013 DOI: 10.1590/S0100‑204X2013000800029
as several species, such as: the Pacific threadfin,
Polydactylus sexfilis (Valenciennes, 1831), 1.79% DL (Deng et al., 2010); the Japanese flounder, 2.16% DL,
and the red sea bream, Pagrus major (Temminck & Schlegel, 1843) with 2.15% DL (Foster & Ogata, 1998);
the Atlantic salmon, Salmo salar (Linnaeus, 1758), 2.25% and 2.39% DL (Rollin et al., 2003; Abboudi et al., 2006); the Japanese seabass, Lateolabrax japonicus (Cuvier, 1828), 2.49% DL and 5.80% LDP (Mai et al., 2006); the juvenile turbot, Scophthalmus maximus (Linnaeus, 1758), 2.5% DL and 5% LDP (Peres & Oliva‑Teles, 2008); the largemouth bass, Micropterus salmoides (Lacepède, 1802), 2.1% DL and 4.9% LDP (Dairiki et al., 2007); the cobia, Rachycentron canadum (Linnaeus, 1766), 2.33% DL and 5.30% LDP (Zhou et al., 2007); the silver perch, Bidyanus bidyanus (Mitchell, 1838), 2.32% DL and 5.96% LDP (Yang et al., 2011); the large yellow
croaker, Pseudosciaena crocea (Richardson, 1846), with 2.48% DL and 5.77% LDP (Zhang et al., 2008);
and the Atlantic cod, Gadus morhua (Linnaeus, 1758),
2.62% DL (Grisdale‑Helland et al., 2011). When
comparing polynomial regression to the broken‑line method, the latter was found to be more precise and reliable (Dairiki et al., 2007).
For FCR, the break point (FCR = 3.33) was
registered for 2.5% of DL (5.8% of LDP) (Figure 1).
Fracalossi et al. (2004) observed FCR average between
3.52 and 3.82 for dourado juveniles with an initial average weight of 32.60 g e 23.46 g, respectively,
associated with low‑feed intake, caused by the stress after handling, and predominance of male dourados
(the worst growth). A calculated 2.16% DL (5.0%
LDP) yielded SGR at 0.55% per day.
Losses of cultured fish to cannibalism may be high
during the larval and early juvenile stages. In this trial, sign of cannibalism was registered neither at the
beginning nor in the cages with heterogeneous fish. Dietary essential amino acid deficiency may affect the survival rate of farmed fish. Trout fed lysine‑deficient
diets – 0.45, 0.55, and 0.70 – had more than 50%
mortality, while fish fed diets containing 0.85% of
Figure 1. Relationships between the dietary lysine level to dourado (Salminus brasiliensis) and: A, weight gain (WG); B, specific growth rate (SGR); C, feed conversion ratio (FCR); and D, final weight (FW).
100
80
60
40
20
0
-20
-40 A
0 1.0 1.5 2.0 2.5 3.0 3.5 4.0
W
eight
gain
(g) WG = 41.43x - 31.62R2= 1.00
WG = 9.74x2+ 63.84x - 42.83
R2= 0.52
2.17
20
15
10
5
0
0 0.5 1.0 1.5 2.0 2.5 3.0 3.5 4.0 FCR = 4.84x + 15.43
R2= 1.00
FCR = 2,22x2- 13.12x + 22.47
R2= 0.55
C
Lysine rates (%)
Feed
conversion
rate
B
0 1.0 1.5 2.0 2.5 3.0 3.5 4.0 2.16
1.0
0.8
0.6
0.4
0.2
0.0
-0.2
-0.4
Specific
growth
rate (% per day)
SGR = 0.37x - 0.25 R2= 1.00
SGR = 0.09x2+ 0.58x - 0.37
R2= 0.56
250
200
150
100
50
0
0 0.5 1.0 1.5 2.0 2.5 3.0 3.5 4.0 Lysine rates (%)
FW = 43.41x + 102.5 R2= 1.00
FW = 10.84x2+ 68.84x + 89.13
R2= 0.53
2.13
Final
weight
(g)
D
DL or higher had improved survival, equaling 100%
for fish fed DL exceeding 1.0% (Rodehutscord et al., 1997). In the present study, survival rate (89.6 ~ 97.9
%, Table 3) did not differ among treatments (p>0.05). This can be related to the antagonism between lysine and arginine. Tibaldi et al. (1994) state that disproportionate dietary lysine and arginine contents can reduce feed consumption and trigger competition between these amino acids for intestinal absorption sites and metabolic pathways.
Increasing lysine levels between treatments did not cause differences (p>0.05) in the whole body
parameters (crude protein, ether extract and ash); however, if treatments are compared with the SE, a
small difference would appear in crude protein and ash values (which increased at the end of the experiment). The maximum protein deposition was found in 3.0% of lysine in the diet (Table 4). DL requirements for optimal growth rate and carcass traits reportedly
varied among fish species and the considered size.
For dourado juveniles, an increasing protein retention and decreasing body fat were observed at 3.0% lysine
level, although no significant differences were found between treatments. Montes‑Girao & Fracalossi (2006) determined the maximal protein deposition for the levels exceeding 1.36% DL. In the present work,
the ash levels were high (10.69 ~ 13.52%). Body composition was not significantly affected by DL levels for juvenile grouper (Luo et al., 2006). In the
present study, crude protein levels, lipid and ash were
18.7, 6.0, and 4.9%, respectively. Mai et al. (2006) determined the whole body values for Japanese seabass (20.2% crude protein, 7.8% crude lipid, and 4.9% ash).
All these data were higher than those of the present work for juvenile dourado.
For arginine, treatment means did not differ
(p>0.05) for final weight (FW), weight gain (WG), feed consumption (FC) and specific growth rate
(SGR). Treatment means differed (p<0.05) for feed
conversion rate (FCR) (Table 3). Ketola (1983) also reported that fish fed arginine‑deficient diets had low
feed consumption, reduced growth rate and impaired overall performance. The worse feed conversion
rate was registered for fish fed diet containing 1%
arginine. The inclusion of synthetic arginine resulted in an improved feed conversion rate.The same trend was registered for juvenile rainbow trout fed different levels of synthetic arginine inclusion (Kaushik et al.,
1988), with SGR values close to that registered for
dourado in the present work.
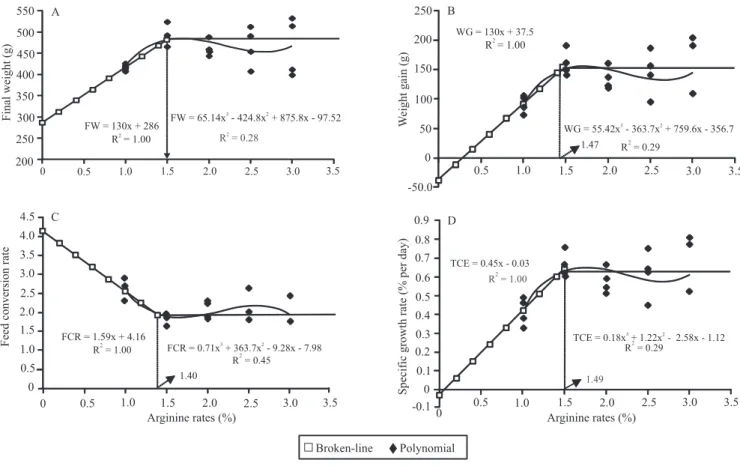
Using the broken‑line method yielded an estimated,
optimum level (break point) of arginine for maximum
FW (481 g) equal to 1.50% of DA, or 3.49% arginine in the dietary protein (ADP) (Figure 2). Optimum, calculated DA levels for WG (153.6 g) were 1.47%
of DA or 3.42% or 3.37% of ADP. Citations in the
literature show DA values that vary between 1.6 %
(ADP 4.1%) for Atlantic salmon (Lall et al., 1994) and
2.8% (ADP 6.5 %) for yellow grouper [Epinephelus awoara (Temminck & Schlegel, 1842)] (Zhou et al., 2012), as well as several species, such as the sea bass [Dicentrarchus labrax (Linnaeus, 1758)] with 1.8% AD and 3.9% ADP (Tibaldi et al., 1994), and the
Japanese flounder with 2.04% AD and 4.08% (Alam
et al., 2002).
The break point for FCR=1.93 was registered at 1.4% of DA (3.25% of ADP) (Figure 2). Recorded FCR values for dourado can be considered satisfactory,
especially considering fish size and age. An estimated 1.49% of DA (3.46% of ADP) yielded 0.64% SGR per
day (Figure 2. Comparable values were found by Kim
et al. (1992) for fingerling rainbow trout, with 1.4% DA (4.03% of ADP), and for fingerlings of Indian major Table 4. Body composition of dourado (Salminus
brasiliensis) juveniles (original matter) fed diets with increasing levels of lysine(1) and arginine(1), at the beginning
(initial) and end of the experiments.
Component Crude protein Lipids Ash
(%) ‑‑‑‑‑‑‑‑‑‑‑‑‑‑‑‑‑‑‑‑‑‑‑‑‑‑‑‑ (%) ‑‑‑‑‑‑‑‑‑‑‑‑‑‑‑‑‑‑‑‑‑‑‑‑‑‑‑‑ Lysine
Initial 17.0a 4.6a 2.9a
1.0 15.3±0.5b 3.2±1.3a 3.8±0.5a
1.5 16.6±0.6ab 3.5±2.1a 3.8±0.5a
2.0 16.6±1.3ab 4.2±0.7a 3.4±0.7a
2.5 16.9±0.7a 3.9±0.6a 3.3±0.4a
3.0 17.6±0.3a 3.4±0.4a 3.5±0.6a
3.5 17.1±0.6a 4.1±0.6a 3.4±0.4a
Arginine
Initial 17.4a 5.6a 4.5a
1.0 17.9±0.9a 4.8±0.8a 4.3±0.4ab
1.5 17.9±0.9a 5.3±0.5a 4.3±0.2ab
2.0 17.4±0.4a 5.0±0.4a 4.3±0.2ab
2.5 17.2±0.7a 4.7±0.4a 3.8±0.1b
3.0 18.3±1.4a 5.6±1.5a 3.9±0.5ab
(1)Means (n=4) ± standard deviation. Means followed by equal letters, in the
Pesq. agropec. bras., Brasília, v.48, n.8, p.1012‑1020, ago. 2013 DOI: 10.1590/S0100‑204X2013000800029
carp, Labeo rohita (Hamilton, 1822), with DA 1.25% and ADP 3.12% according to Abidi & Khan (2009).
No manifest signals of possible problems linked to lysine‑arginine antagonism were registered. According
to Furuya et al. (2006), the adjusted relations between lysine: arginine, are 0.98:1 and 0.91:1, respectively, for
the best weight gain and feed conversion rate. In the present study, the best lysine to arginine ratio yielding optimized performance was 1:0.7. Furthermore, Zhou et al. (2011) reported that juveniles (10 g) of black sea bream, Acanthopagrus schlegelii (Bleeker, 1854), fed disproportionate levels of arginine and lysine showed
significant growth reduction, due in part to lower feed
intake, reduced nutrient availability (arginine and lysine), and increased catabolism of absorbed amino acids. Supplementing additional arginine to the diet partially ameliorate the reduced growth, feed utilization
and hepatic arginase activity observed in fish fed excess
DL, suggesting the possible antagonistic relationship between these two amino acids. The authors concluded that to ensure optimal growth of black sea bream,
dietary levels of both arginine and lysine should be considered together when formulating feeds for this
commercially farmed marine fish.
Goodness of fit was described by the coefficient of
determination (R2), which describes the proportion
of the total variation around y explained by the linear regression, and the standard error of the regression (sy.x) which describes the standard
deviation of the residuals of the individual values of y from the linear regression. Because determination
coefficients registered for the broken‑line regression
curves (R2 = 1.00) were considerably higher
than those for polynomial regression curves (R2 = 0.28~0.45), the broken‑line analysis method can
be considered not only more accurate and precise, but
also it can be seen as an elicitor of economic efficiency
in the feed formulation and processing for dourado. No sign of cannibalism was registered even in tanks in which size heterogeneity developed as a result of precocious dominant behavior. Treatment means did not differ (p>0.05) for survival rate (Table 3). Very few
Figure 2. Relationships between the dietary arginine level to dourado (Salminus brasiliensis) and: A, final weight (FW); B, weight gain (WG); C, feed conversion ratio (FCR); D, specific growth rate (SGR).
550
500
450
400
350
300
250
200
FW = 65.14x - 424.8x + 875.8x - 97.523 2 FW = 130x + 286
R = 1.002
3.5 3.0 2.5 2.0 1.5 1.0 0.5 0
Final weight (g) Weight gain (g)
WG = 55.42x - 363.7x + 759.6x - 356.73 2
R = 0.292 WG = 130x + 37.5
R = 1.002
0.5 1.0 1.5 2.0 2.5 3.0 3.5
0 50 100
-50.0 150 200 250
1.47
TCE = 0.18x + 1.22x - 2.58x - 1.123 2 R = 0.292
4.5
4.0
Feed conversion rate
1.40 FCR = 1.59x + 4.16
R = 1.002 FCR = 0.71x + 363.7x - 9.28x - 7.983 2 R = 0.452
3.5
3.0
2.5
2.0 1.5
1.0 0.5
0
3.5 3.0 2.5 2.0 1.5 1.0 0.5 0
0.9
0.8 0.7
0.6
0.5
0.4
0.3 0.2
0.1
0 -0.1
Specific growth rate (% per day)
TCE = 0.45x - 0.03
3.5 3.0 2.5 2.0 1.5 1.0 0.5 0 A
C D
R = 0.282
Arginine rates (%) Arginine rates (%)
1.49 R = 1.002
B
casualties resulting from agonistic interactions were observed at the beginning of the trials. The registered high survival rate corroborates the low mortality ones
registered for fingerlings of sea bass (Tibaldi et al.,
1994), and for juvenile Atlantic salmon (Lall et al., 1994) independently of DA level.
Increasing DA levels did not affect (p>0.05) crude
protein and lipid contents (Table 4). When final results
are compared with the initial population, only a minute difference in ash content, which was lower at the end
of trials, can be detected. For fingerling rainbow trout,
Kim et al. (1992) registered increased lipid storage and
decreased protein deposition, when fish were fed on arginine‑poor diet (0.47%); however, with a higher
arginine level (0.9% of diet), this did not occur. Zhou et al. (2012) reported increased crude protein, crude lipid and ash contents in the muscle of yellow grouper
in fish fed with 2.83% DA. Tesser et al. (2005) did
not observe differences on body protein and lipid contents of juvenile pacu, Piaractus mesopotamicus (Holmberg, 1887), which fed graded levels of arginine,
but observations for ash contents are similar to those observed and reported in the present work for juvenile dourado, and explained based on differences registered in body calcium.
Conclusions
1. Synthetic lysine and arginine in the diet does not affect the growth of dourado.
2. Optimal DL requirements for final weight, weight gain and specific growth rate, are 2.15% of diet or 5%
of lysine in the dietary protein.
3. The best feed conversion ratio is attained with
2.5% of DL or 5.8% of lysine in the dietary protein. 4. Optimal dietary arginine requirements, for final weight, weight gain, feed consumption and specific growth rate is 1.48% of DA or 3.43% of ADP.
5. The best feed conversion ratio is attained with 1.4% of DA or 3.25% of ADP.
Acknowledgments
To Fundação de Amparo à Pesquisa do Estado de São Paulo (Fapesp) and to Conselho Nacional de Desenvolvimento Científico e Tecnológico (CNPq),
for partially funding the research.
References
ABBOUDI, T.; MAMBRINI, M.; OOGHE, W.; LARONDELLE, Y.; ROLLIN, X. Protein and lysine requirements for maintenance
and for tissue accretion in Atlantic salmon (Salmo salar) fry. Aquaculture, v.261, p.369‑383, 2006. DOI: 10.1016/j.
aquaculture.2006.07.041.
ABIDI, S.F.; KHAN, M.A. Dietary arginine requirement of
fingerling Indian major carp, Labeo rohita (Hamilton) based on
growth, nutrient retention efficiencies, RNA/DNA ratio and body
composition. Journal of Applied Ichthyology, v.25, p.707‑714, 2009. DOI: 10.1111/j.1439‑0426.2009.01270.x.
ALAM, M.S.; TESHIMA, S.I.; KOSHIO, S.; ISHIKAWA, M.
Arginine requirement of juvenile Japanese flounder Paralichthys
olivaceus estimated by growth and biochemical parameters.
Aquaculture, v.205, p.127‑140, 2002. DOI: 10.1016/
S0044‑8486(01)00670‑6.
COELLO, N.; MONTIEL, E.; CONCEPCION, M.; CHRISTEN, P. Optimisation of a culture medium containing fish silage
for L‑lysine production by Corynebacterium glutamicum. Bioresource Technology, v.85, p.207‑211, 2002. DOI: 10.1016/
S0960‑8524(02)00084‑6.
DAIRIKI, J.K.; DIAS, C.T. dos S.; CYRINO, J.E.P. Lysine
requirements of largemouth bass, Micropterus salmoides: a comparison of methods of analysis of dose‑response trials data.
Journal of Applied Aquaculture, v.19, p.1‑27, 2007. DOI:
10.1300/J028v19n04_01.
DENG, D.‑F.; DOMINY, W.; JU, Z.Y.; KOSHIO, S.; MURASHIGE, R.; WILSON, R.P. Dietary lysine requirement of juvenile Pacific
threadfin (Polydactylus sexfilis). Aquaculture, v.308, p.44‑48,
2010. DOI: 10.1016/j.aquaculture.2010.07.041.
FORSTER, I.; OGATA, H.Y. Lysine requirement of juvenile
Japanese flounder Paralichthys olivaceus and juvenile red sea
bream Pagrus major. Aquaculture, v.161, p.131‑142, 1998. DOI:
10.1016/S0044‑8486(97)00263‑9.
FRACALOSSI, D.M.; MEYER, G.; SANTAMARÍA, F.M.; WEINGARTNER, M.; ZANIBONI‑FILHO, E. Desempenho do
jundiá, Rhamdia quelen, e do dourado, Salminus brasiliensis,
em viveiros de terra na Região Sul do Brasil. Acta Scientiarum.
Animal Sciences, v.26, p.345‑352, 2004.
FURUYA, W.M.; SANTOS, V.G. dos; SILVA, L.C.R.; FURUYA, V.R.B.; SAKAGUTI, E.S. Exigências de lisina digestível para
juvenis de tilápia‑do‑nilo. Revista Brasileira de Zootecnia, v.35,
p.937‑942, 2006. DOI: 10.1590/S1516‑35982006000400001. GRISDALE‑HELLAND, B.; HATLEN, B.; MUNDHEIN, H.; HELLAND, S.J. Dietary lysine requirement and efficiency of
lysine utilization for growth of Atlantic cod. Aquaculture, v.315,
p.260‑268, 2011. DOI: 10.1016/j.aquaculture.2011.02.015.
HORWITZ, W. (Ed.). Official methods of analysis of AOAC
International. 17th ed. Gaithersburg: AOAC International, 2000.
1141p.
KAUSHIK, S.J.; FAUCONNEAU, B.; TERRIER, L.; GRAS, J.
Pesq. agropec. bras., Brasília, v.48, n.8, p.1012‑1020, ago. 2013 DOI: 10.1590/S0100‑204X2013000800029
indices in rainbow trout (Salmo gairdneri R.). Aquaculture,
v.70, p.75‑95, 1988. DOI: 10.1016/0044‑8486(88)90008‑7. KETOLA, H.G. Requirement for dietary lysine and arginine by
fry of rainbow trout. Journal of Animal Science, v.56, p.101‑107,
1983.
KIM, K.I.; KAYES, T.B.; AMUNDSON, C.H. Requirements
for lysine and arginine by rainbow trout (Oncorhynchus
mykiss). Aquaculture, v.106, p.333‑344, 1992. DOI:
10.1016/0044‑8486(92)90265‑M.
KUÇUKBAY, F.Z.; YAZLAK, H.; SAHIN, N.; AKDEMIR, F.; ORHAN, C.; JUTURU, V.; SAHIN, K. Effects of dietary arginine
silicate inositol complex on mineral status in rainbow trout
(Oncorhynchus mykiss). Aquaculture Nutrition, v.14, p.257‑262,
2008. DOI: 10.1111/j.1365‑2095.2007.00526.x.
LAHNSTEINER, F. The role of free amino acids in semen of
rainbow trout Oncorhynchus mykiss and carp Cyprinus carpio. Journal of Fish Biology, v.75, p.816‑833, 2009. DOI: 10.1111/j.1
095‑8649.2009.02317.x.
LALL, S.P.; KAUSHIK, S.J.; LE BAIL, P.Y.; KEITH, R.; ANDERSON, J.S.; PLISETSKAYA, E. Quantitative
arginine requirement of Atlantic salmon (Salmo salar) reared in sea water. Aquaculture, v.124, p.13‑25, 1994. DOI:
10.1016/0044‑8486(94)90350‑6.
LIEBERT, F. Amino acids requirements. An alternative model
based on feed and animal efficiency. Aqua Feeds: Formulation and
Beyond, v.2, p.20‑21, 2005.
LUO, Z.; LIU, Y.Z.; MAI, K.S.; TIAN, L.X.; TAN, X.Y.; YANG, H.J.; LIANG, G.Y.; LIU, D.H. Quantitative L‑lysine requirement
of juvenile grouper Epinephelus coioides. Aquaculture Nutrition,
v.12, p.165‑172, 2006. DOI: 10.1111/j.1365‑2095.2006.00392.x. MAI, K.; ZHANG, L.; AI, Q.; DUAN, Q.; ZHANG, C.; LI, H.; WAN, J.; LIUFU, Z. Dietary lysine requirement of juvenile
Japanese seabass, Lateolabrax japonicus. Aquaculture, v.258,
p.535‑542, 2006. DOI: 10.1016/j.aquaculture.2006.04.043. MONTES‑GIRAO, P.J.; FRACALOSSI, D.M. Dietary lysine
requirement as basis to estimate the essential dietary amino
acid profile for Jundiá, Rhamdia quelen. Journal of the World
Aquaculture Society, v.37, v.388‑396, 2006.
NATIONAL RESEARCH COUNCIL. Nutrient requirements of
fish. Washington: National Academic Press, 1993. 114p.
NIKOLIC, J.; STOJANOVIC, I.; PAVLOVIC, R.; SOKOLOVIC, D.; BJELAKOVIC, G.; BENINATI, S. The role of L‑arginine in
toxic liver failure: interrelation of arginase, polyamine catabolic enzymes and nitric oxide synthase. Amino Acids, v.32, p.127‑131, 2007. DOI: 10.1007/s00726‑006‑0309‑y.
PERES, H.; OLIVA‑TELES, A. Lysine requirement and
efficiency of lysine utilization in turbot (Scophthalmus maximus)
juveniles. Aquaculture, v.275, p.283‑290, 2008. DOI: 10.1016/j. aquaculture.2007.12.015.
POHLENZ, C.; BUENTELLO, A.; MWANGI, W.; GATLIN III,
D.M. Arginine and glutamine supplementation to culture media
improves the performance of various channel catfish immune cells. Fish and Shellfish Immunology, v.32, p.762‑768, 2012. DOI: 10.1016/j.fsi.2012.01.029.
PORTZ, L.; DIAS, C.T. dos S.; CYRINO, J.E.P. Regressão segmentada como modelo na determinação de exigências
nutricionais de peixes. Scientia Agricola, v.57, p.601‑607, 2000.
DOI: 10.1590/S0103‑90162000000400002.
RODEHUTSCORD, M.; BECKER, A.; PACK, M.; PFEFFER, E.
Response of rainbow trout (Oncorhynchus mykiss) to supplements
of individual essential amino acids in a semipurified diet, including
an estimate of the maintenance requirement for essential amino acids. Journal of Nutrition, v.127, p.1166‑1175, 1997.
ROLLIN, X.; MAMBRINI, M.; ABBOUDI, T.; LARONDELLE, Y.; KAUSHIK, S.J. The optimum dietary indispensable amino acid
pattern for growing Atlantic salmon (Salmo salar L.) fry. British Journal of Nutrition, v.90, p.865‑876, 2003. DOI: 10.1079/
BJN2003973.
TESSER, M.B.; TERJENSEN, B.F.; ZHANG, Y.; PORTELLA,
M.C.; DABROWSKI, K. Free and peptide‑based dietary arginine
supplementation for the South American fish pacu (Piaractus
mesopotamicus). Aquaculture Nutrition, v.11, p.443‑453, 2005.
DOI: 10.1111/j.1365‑2095.2005.00373.x.
TIBALDI, E.; TULLI, F.; LANARI, D. Arginine requirement and effect of different dietary arginine and lysine levels for fingerling
sea bass (Dicentrarchus labrax L.). Aquaculture, v.127, p.207‑218, 1994. DOI: 10.1016/0044‑8486(94)90427‑8.
YANG, S.‑D.; LIU, F.‑G.; LIOU, C.‑H. Assessment of dietary
lysine requirement for silver perch (Bidyanus bidyanus) juveniles. Aquaculture, v.312, p.102‑108, 2011. DOI: 10.1016/j. aquaculture.2010.12.011.
ZHANG, C.; AI, Q.; MAI, K.; TAN, B.; LI, H.; ZHANG, L.
Dietary lysine requirement of large yellow croaker, Pseudosciaena
crocea R. Aquaculture, v.283, p.123‑127, 2008. DOI: 10.1016/j.
aquaculture.2008.06.035.
ZHOU, F.; SHAO, Q.J.; XIAO, J.X.; PENG, X.; NGANDZALI, B.O.; SUN, Z.; NG, W.K. Effects of dietary arginine and lysine
levels on growth performance, nutrient utilization and tissue
biochemical profile of black sea bream Acanthopagrus schlegelii,
fingerlings. Aquaculture, v.319, p.72‑80, 2011. DOI: 10.1016/j.
aquaculture.2011.06.001.
ZHOU, Q.‑C.; WU, Z.‑H.; CHI, S.‑Y.; YANG, Q.‑H. Dietary
lysine requirement of juvenile cobia (Rachycentron canadum). Aquaculture, v.273, p.634‑640, 2007. DOI: 10.1016/j.
aquaculture.2007.08.056.
ZHOU, Q.‑C.; ZENG, W.‑P.; WANG, H.‑L.; XIE, F.‑J.; WANG, T.; ZHENG, C.‑Q. Dietary arginine requirement of juvenile yellow
grouper Epinephelus awoara. Aquaculture, v.350, p.175‑182, 2012. DOI: 10.1016/j.aquaculture.2012.03.042.