Rev. Caatinga
PHYSIOLOGICAL INDICES AND GROWTH OF ‘PALUMA’ GUAVA UNDER
SALINE WATER IRRIGATION AND NITROGEN FERTIGATION
1IDELFONSO LEANDRO BEZERRA2*, REGINALDO GOMES NOBRE3, HANS RAJ GHEYI4, GEOVANI SOARES
DE LIMA5, JOICY LIMA BARBOSA5
ABSTRACT - The cultivation of irrigated guava in semi-arid areas highlights the need for information regarding its responses to irrigation water quality and the fertilization management that enables its exploitation. Thus, this study aimed to evaluate the effect of water salinity and nitrogen (N) doses on the growth and physiology of the guava cv. ‘Paluma’. The experiments was conducted in drainage lysimeters under field
conditions in an experimental area at the Center of Sciences and Agri-Food Technology of the Federal
University of Campina Grande (CCTA/UFCG), Campus II, in Pombal, PB, Brazil. The experiment had a randomized block design, and treatments consisted of a 5 x 4 factorial arrangement corresponding to five levels of
irrigation water electrical conductivity, ECw (0.3, 1.1, 1.9, 2.7, and 3.5 dS m-1), and four N doses (70, 100, 130, and
160% of the recommended N dose). The 100% dose corresponded to 541.1 mg of N dm-3 of soil. Increments in
irrigation water salinity from 0.3 dS m-1 led to a reduction in stomatal conductance, internal CO
2 concentration, CO2
assimilation rate, transpiration, instantaneous water use efficiency, the number of leaves and branches, stem diameter,
and absolute and relative growth rates. Nitrogen doses ranging from 378.7 to 865.7 mg of N dm-3 of soil did not
affect gas exchange and plant growth. Although ‘Paluma’ guava growth was affected by increases in water salinity, these plants can be irrigated using water of up to 1.42 dS m-1 with an acceptable reduction of 10% in growth variables. The interaction between irrigation water salinity and N fertilization had no significant effect on any of the variables studied.
Keywords: Psidium guajava L.. Salinity. Nitrogen. Physiology.
ÍNDICES FISIOLÓGICOS E CRESCIMENTO DE GOIABEIRA ‘PALUMA’ IRRIGADA COM ÁGUA SALINA E ADUBAÇÃO NITROGENADA
RESUMO - O cultivo da goiabeira irrigada nas áreas semiáridas evidencia a necessidade de informações a respeito de suas respostas à qualidade da água de irrigação e ao manejo da adubação que possibilite sua
exploração. Assim, objetivou-se estudar o efeito da salinidade da água combinada com doses de nitrogênio no
crescimento e fisiologia da goiabeira cv. ‘Paluma’, em experimento conduzido em lisímetros de drenagem sob condições de campo em uma área experimental no Centro de Ciência e Tecnologia Agroalimentar da Universidade Federal de Campina Grande (CCTA/UFCG), Campus II de Pombal, PB. O delineamento experimental utilizado foi de blocos casualizados, com tratamentos arranjados em esquema fatorial 5 x 4, relativos a cinco níveis de
condutividade elétrica da água de irrigação – CEa (0,3; 1,1; 1,9; 2,7 e 3,5 dS m-1) e quatro doses de nitrogênio (70,
100, 130 e 160% de N recomendada), sendo a dose referente a 100% correspondeu a 541,1 mg de N dm-3 de
solo. O aumento da salinidade da água de irrigação a partir de 0,3 dS m-1 promoveu redução na condutância
estomática, concentração interna de CO2, taxa de assimilação de CO2, transpiração, eficiência instantânea no uso da
água, número de folhas e ramos, diâmetro de caule, taxa de crescimento absoluto e relativo. Doses de nitrogênio
variando de 378,7 a 865,7 mg de N dm-3 de solo não afetaram as trocas gasosas e o crescimento das plantas. Apesar
do crescimento da goiabeira cv. Paluma ser afetado com o aumento da salinidade, é possível irrigar com água de até 1,42 dS m-1 ocorrendo redução aceitável de 10% nas variáveis de crescimento. Não houve efeito significativo da interação entre salinidade da água de irrigação e doses de adubação nitrogenada em nenhuma variável estudada.
Palavras-chave: Psidium guajava L.. Salinidade. Nitrogênio. Fisiologia.
_______________________
*Corresponding author
1Received for publication in 06/22/2017; accepted in 01/22/2018.
Paper extracted from the doctoral thesis of the first author.
2Department of Agronomy, Fundação Universidade Federal de Rondônia, Rolim de Moura, RO, Brazil; [email protected] – ORCID: 0000-0002-1883-8093.
3Department of Science and Technology, Universidade Federal Rural do Semi-Árido, Caraúbas, RN, Brazil; [email protected] – ORCID: 0000-0002-6429-1527.
4Nucleus of Soil and Water Engineering, Universidade Federal do Recôncavo da Bahia, Cruz das Almas, BA, Brazil; [email protected] – ORCID: 0000-0002-1066-0315.
INTRODUCTION
The guava (Psidium guajava L.) belongs to
the Myrtaceae family and is native to Tropical America, possibly somewhere between Mexico and Peru, where it can be found in the wild stage. It is found nationwide in Brazil, where the fruit is much appreciated. As a result, in recent years there has been an increase in the area cultivated for commercial purposes, either for fresh consumption or industrialization (OLIVEIRA et al., 2015). The ‘Paluma’ cultivar is the most widespread in Brazil, and has the most varied consumer market (RAMOS et al., 2010).
Northeast Brazil is one of the main guava producing regions. The region is characterized by high evaporation rates, irregular rainfall, and deficient drainage in the soil. Its waters often exhibit
electrical conductivities greater than 1.5 dS m-1,
which may limit agricultural production causing morphological, physiological, and biochemical alterations in plants that compromise their development, production, and fruit quality (NEVES et al., 2009; DIAS et al., 2011; FREIRE et al., 2014). The effects of high salt concentrations in the soil manifest themselves through alterations to physical and chemical properties, which reduce the osmotic potential of the soil solution, and affect the mineral nutrition of the plants through the direct action of specific ions (CAVALCANTE et al., 2009; DIAS et al., 2011).
Nitrogen is one of the most important nutrients for plants as it has structural function, and comprises various organic compounds that are vital to plants (such as amino acids, proteins, and proline), increases the capacity for osmotic adjustment to
salinity, and increases crop resistance to water and salt stresses (PARIDA; DAS, 2005). Thus, efficient management of N fertilization can be an alternative to attenuate the effects of salinity on plants.
Growth analysis has been employed as a tool to evaluate the effects of environmental and management factors in plants, and to infer the contributions from different physiological processes involved in plant behavior, as the variables required are easily measured (BENINCASA, 2003). Using
open-flow gas exchange systems such as an IRGA
(Infrared Gas Analyzer) may enhance the evaluation, resulting in faster and more accurate individual measurement of these processes (HUNT, 2003).
In this context, this study aimed to evaluate the effects of irrigation water salinity and nitrogen (N) fertilization on leaf gas exchange and the growth of guavas, cv. ‘Paluma’.
MATERIAL AND METHODS
The study was carried out from October 2015 to August 2016 in 150 L pots that were converted into lysimeters under field conditions. The experiment was set up at the Center of Sciences and
Agri-Food Technology (CCTA) at the Federal
University of Campina Grande (UFCG), in the municipality of Pombal, PB, Brazil (6º48’16’’ S; 37º49’15’’ W; 144 m). The climate of the region, according to Köppen’s classification, is hot and
semi-arid (BSh), with a mean annual temperature of
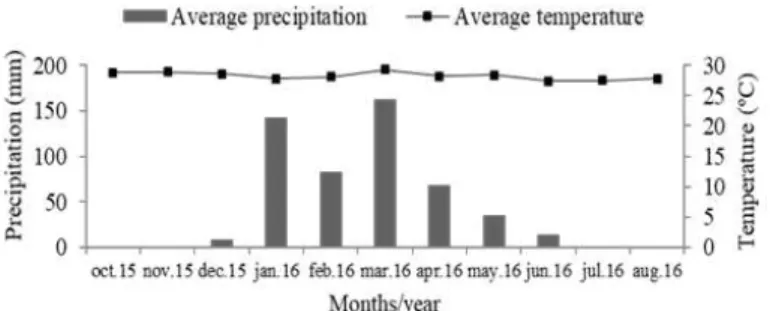
28 ºC and rainfalls around 750 mm. Mean monthly rainfall and temperatures in the municipality are shown in Figure 1.
Figure 1. Climatic data of Pombal, PB, during the experimental period.
The experiment had a randomized block design, with a 5 x 4 factorial arrangement, corresponding to five levels of irrigation water
salinity, ECw (0.3, 1.1, 1.9, 2.7, and 3.5 dS m-1), and
four N doses (70, 100, 130, and 160% of the dose recommended for greenhouse experiments (SOUZA et al., 2016)) that corresponded, respectively, to
378.7, 541.1, 703.4, and 865.7 mg of N dm-3 of soil.
Each pot had three replicates with one plant per plot. Solutions with different ECw levels were obtained by dissolving NaCl in water from the local
supply system (ECw=0.3 dS m-1), and the quantity
(C) was determined based on the empirical equation proposed by Rhoades, Kandiah and Mashali (2000):
C (mg L-1)=640 x ECw (dS m-1), where ECw
represents the pre-established ECw value minus the
EC of the water used in the preparation.
Rootstocks were grown from ‘Crioula’ guava
seeds from a commercial orchard at the Mocó
Rev. Caatinga
propagation, high tolerance to pests and diseases,
especially rust (Puccinia psidii Wint.) (MANICA et
al., 2001), and is readily available in Brazil. In addition, there is a lack of studies evaluating its tolerance to salinity and doses of N (DIAS et al., 2012).
The soil had the following characteristics: pH
(soil:water, 1:2.5)=7.41; ECse (dS m-1)=1.21;
P (mg dm-3)=17; exchangeable Ca, Mg, Na,
K (cmolc dm-3)=5.4, 4.1, 2.21, and 0.28, respectively.
Organic matter, OM (g kg-1)=32; base saturation,
V (%)=27; apparent density, Da (kg dm-3)=1.3; and
total porosity, Pt (%)=47. Cultivation practices involved weeding, ridging, scarification, pruning, training, and phytosanitary treatment (sprayings to prevent and
control fruit flies (Anastrepha spp. and Ceratitis
capitate), bugs (Monalonion annulipes, Leptoglossus gonagra, L. stigma, L. zonatus, L. fasciatus, and Holhymenia clavigera), and guava psyllids (Triozoida limbata)) were conducted according to necessities.
The lysimeters were plastic polyethylene boxes with a top diameter of 0.87 m, a height of 0.43 m, and a 150 L capacity, perforated at the bottom to allow free drainage. They were filled with a substrate composed of Fluvic Neosol (85%) and sand (15%). The soil material was irrigated to field
capacity using water with an ECw of 0.3 dS m-1. Once
the grafted seedlings of guava, cv. ‘Paluma’, had four pairs of true leaves, they were transplanted to the lysimeters.
Treatment application began at 15 days after transplantation (DAT) and irrigation with the saline solutions was performed according to each treatment. Irrigation in each treatment was based on plant water requirement that was determined by the difference between the applied volume and the volume drained in the previous irrigation, estimated by drainage lysimetry, maintaining soil moisture close to field capacity. Irrigations were carried out twice a day, in the early morning and late afternoon. The water volume applied by irrigation from 40 DAT on, was adjusted to provide the soil with a leaching fraction of 0.15 to avoid excessive accumulation of salts in the soil.
The fertilizer was applied manually at planting to each lysimeter, and contained 189.5 g of single superphosphate (a single dose at planting) and 17.28 g of potassium chloride, split as follows: 1/3 of the recommended dose applied at planting and 2/3
divided into two equal applications at 30 and 60 DAT.
Nitrogen fertilization began at 25 DAT, with 28 weekly applications. 1/5 of the dose was applied in the first 8 weeks as the root system occupied a small volume inside the lysimeter, The rest of the N was equally applied over the following 20 weeks. Urea (45% N) was used as the N source, and was
applied via fertigation using 0.3 dS m-1 water for all
treatments.
Plant growth was evaluated at 255 and 300 DAT based on the number of leaves (NL), number of branches (NB), stem diameter (SD), and
absolute (AGRSD) and relative (RGRSD) growth rates
of the stem diameter (from 255 to 300 DAT).
Number of leaves was determined by counting the leaves, considering only those with a fully expanded leaf blade, and NB was counted simultaneously. SD was measured with a digital caliper at 5 cm from the base.
AGRSD and RGRSD growth rates of SD were
calculated using the methodology proposed by Taiz and Zeiger (2013), as described in Equations 1 and 2:
(1)
where AGRSD=absolute growth rate, A2=plant
growth at time t2, A1=plant growth at time t1, and t2 –
t1=time difference between measurements.
RGRSD values were obtained using Equation
2, which allowed determination of plant growth
according to the pre-existing biomass, adapting it to
plant diameter.
(2)
where RGRSD=relative growth rate, A2=plant growth
at time t2, A1=plant growth at time t1, t2 – t1=time difference between measurements, and ln=natural logarithm.
At 255 and 300 DAT, leaf gas exchanges
(stomatal conductance (gs), internal CO2
concentration (Ci), transpiration (E), and CO2
assimilation rate (A) were measured using a portable
IRGA, model LCPro+, manufactured by ADC BioScientific. All measurements were taken in fully expanded mature leaves (the third leaf from the apex). Readings were taken between 08:00 and 10:00, using an artificial radiation source with
1200 μmol m-2 s-1 intensity, at room temperature and
CO2 concentration. Photosynthesis and transpiration data were used to calculate the instantaneous water use efficiency, WUEi (SILVA et al., 2014).
The obtained data were subjected to analysis of variance using the F test at 0.05 and 0.01 probability levels. In cases of significance, a polynomial regression analysis was carried out using the SISVAR software program (FERREIRA, 2011).
RESULTS AND DISCUSSION
According to the results of the F test (Table 1), irrigation water salinity levels (S) had a
significant effect on gs, Ci, A, E, and instantaneous
water use efficiency of the guava plants. Nitrogen doses (ND) and the interaction between water salinity and nitrogen doses (S x ND) had no significant effect on any of the variables studied.
AGR𝑆𝐷= A2−A1 t2−t1
(𝑚𝑚𝑑𝑎𝑦−1)
RGR𝑆𝐷=(lnA2−lnA1)
(t2−t1) 𝑚𝑚𝑚𝑚
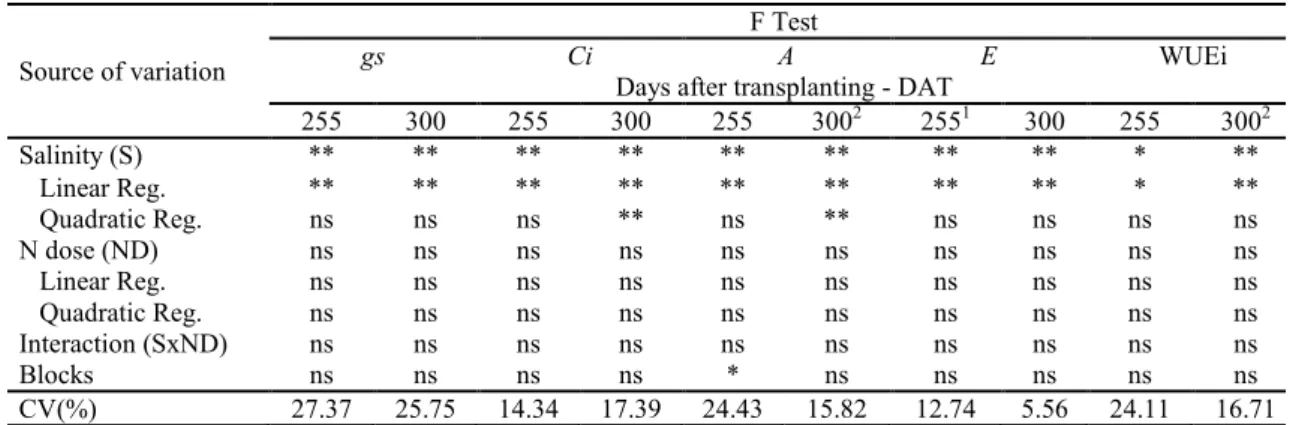
Table 1. Summary of the F test for stomatal conductance (gs), internal CO2 concentration (Ci), CO2 assimilation rate (A),
transpiration (E), and instantaneous water use efficiency (WUEi), at 255 and 300 days after transplanting (DAT), of the guava cv. ‘Paluma’ under different levels of irrigation water salinity and nitrogen doses.
Source of variation
F Test
gs Ci A E WUEi
Days after transplanting - DAT
255 300 255 300 255 3002 2551 300 255 3002
Salinity (S) ** ** ** ** ** ** ** ** * **
Linear Reg. ** ** ** ** ** ** ** ** * **
Quadratic Reg. ns ns ns ** ns ** ns ns ns ns
N dose (ND) ns ns ns ns ns ns ns ns ns ns
Linear Reg. ns ns ns ns ns ns ns ns ns ns
Quadratic Reg. ns ns ns ns ns ns ns ns ns ns
Interaction (SxND) ns ns ns ns ns ns ns ns ns ns
Blocks ns ns ns ns * ns ns ns ns ns
CV(%) 27.37 25.75 14.34 17.39 24.43 15.82 12.74 5.56 24.11 16.71
** and * indicate significance at 0.01 and 0.05 probability levels using the F test; ns indicates no significance using
the F test; and 1,2 statistical analysis performed after data were transformed to x + 1 and , respectively. x
Increasing the electrical conductivity of the
irrigation water, led to a linear reduction in the gs of
guava plants (Figure 2A), equal to a 17.43% per unit increase in ECw at 255 DAT. According to the regression equation, plants subjected to
irrigation with an ECw of 3.5 dS m-1 showed a
reduction in gs of 0.033 mol H2O m-2 s-1, compared
with those with an ECw of less than 0.3 dS m-1. At
300 DAT, a quadratic response was observed
(Figure 2A), and the maximum estimated value
(0.152 mol H2O m-2 s-1) was found at a salinity level
of 0.3 dS m-1. Silva et al. (2013) claim that plants close their stomata to reduce water loss through transpiration, resulting in a lower photosynthetic rate, which is one of the main causes of reduced growth in species subjected to saline stress.
According to the regression equations, Ci
linearly decreases with the increment in irrigation water salinity (10.76 and 13.46% per unit increases in ECw (Figure 2B), at 255 and 300 DAT, respectively). Maximum values of 240.53 mmol m-2 s-1 and 347.54 mmol m-2 s-1 were
observed in plants irrigated with 0.3 dS m-1 water. These values represent reductions of 35.60%
(255 DAT) and 44.91% (300 DAT) in the Ci of
plants irrigated with the highest levels of salinity, compared with those subjected to the lowest level of
salinity. Such relative reductions in Ci may be
attributed to the lower gs, a common response of
plants to saline stress (PRAXEDES et al., 2010; SILVA et al., 2011).
For A at 255 DAT, gradual increments in
irrigation water salinity led to a reduction of 18.35% per unit increase in ECw (Figure 2C), reaching a
reduction of 62.15% (2.70 µmol m-2 s-1) in the A of
plants irrigated with maximum water salinity
(3.5 dS m-1) compared with the minimum ECw level
(0.3 dS m-1). At 300 DAT, the data fitted best to a
quadratic equation (Figure 2C), and A reached its
highest value of 3.69 µmol m-2 s-1 at the ECw level
of 0.3 dS m-1. Amorim et al. (2010) found that
cashew plants under saline stress had lower values of
A and verified that this was caused by the reduction
in stomatal opening, which was also observed in this study. Therefore, it can be inferred that the saline treatments caused stress to the plants, and may have stimulated stomatal closure. However, prolonged exposure to salts led to alterations in plant water status, inducing stomatal closure, and consequently
limiting CO2 entry. Additionally, high concentrations
of ions such as Na+ and Cl- are the main causes of damage to the structures of enzymes and membranes,
indirectly interferring with A (SILVA et al., 2011).
Based on Figure 2D, transpiration at 255 and 300 DAT was negatively affected by the increase in irrigation water salinity, with reductions of 14.80 and 3.62% per unit increase in ECw. In other words,
plants irrigated with 3.5 dS m-1 water showed a
reduction in E of 49.57% (0.696 mol m-2 s-1) and
11.72% (0.179 mol m-2 s-1), respectively, in
comparison to plants that received 0.3 dS m-1 water.
The reduction in plant transpiration observed as water salinity increased, was due to the osmotic effect of the salts around the roots and the possible
accumulation of potentially toxic ions (Na+ and Cl-)
Rev. Caatinga
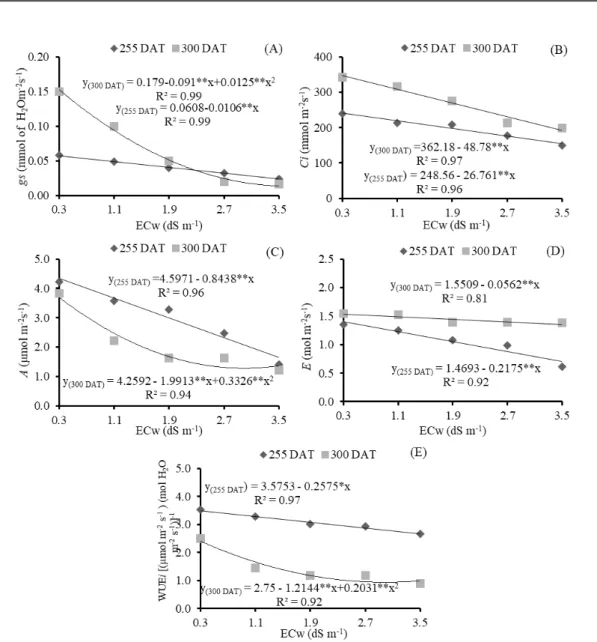
Figure 2. Stomatal conductance - gs (A), internal CO2 concentration - Ci (B), CO2 assimilation rate - A (C),
transpiration - E (D) and instantaneous water use efficiency - WUEi (E), at 255 and 300 days after transplanting (DAT), of
the guava cv. ‘Paluma’, cultivated under different levels of irrigation water electrical conductivity (ECw). Instantaneous water use efficiency (WUEi)
was also negatively and linearly affected by irrigation water salinity at 255 DAT and, according to the regression equation (Figure 2E), WUEi linearly decreased by 7.20% per unit increase in
ECw. Plants irrigated with 3.5 dS m-1 water showed a
reduction in WUEi of 23.55% [(0.824 μmol m-2 s-1)
(mol H2O m-2 s-1)-1] in comparison to those irrigated
with 0.3 dS m-1 water. In addition, at 300 DAT
(Figure 1), WUEi was also negatively affected by ECw and, according to the regression equation, the quadratic model indicated that plants subjected to
irrigation with ECw of 0.3 dS m-1 exhibited the
highest values for WUEi [(2.40 μmol m-2 s-1) (mol H2O m-2 s-1)-1], whereas plants irrigated with 3.5 dS
m-1 water showed the lowest values for WUEi
[(0.98 μmol m-2 s-1) (mol H
2O m-2 s-1)-1]. There
was a reduction in WUEi [(1.42 μmol m-2 s-1) (mol H2O m-2 s-1)-1] between the highest (3.5 dS m-1)
and lowest (0.3 dS m-1) levels of irrigation water
salinity. These results may be associated with osmotic adjustment, i.e., a reduction in cell osmotic potential caused by the accumulation of organic solutes, which contributes to maintaining water absorption and cell turgor that allows the interruption of physiological processes, such as stomatal opening, photosynthesis and cell expansion (SERRAJ; SINCLAIR, 2002).
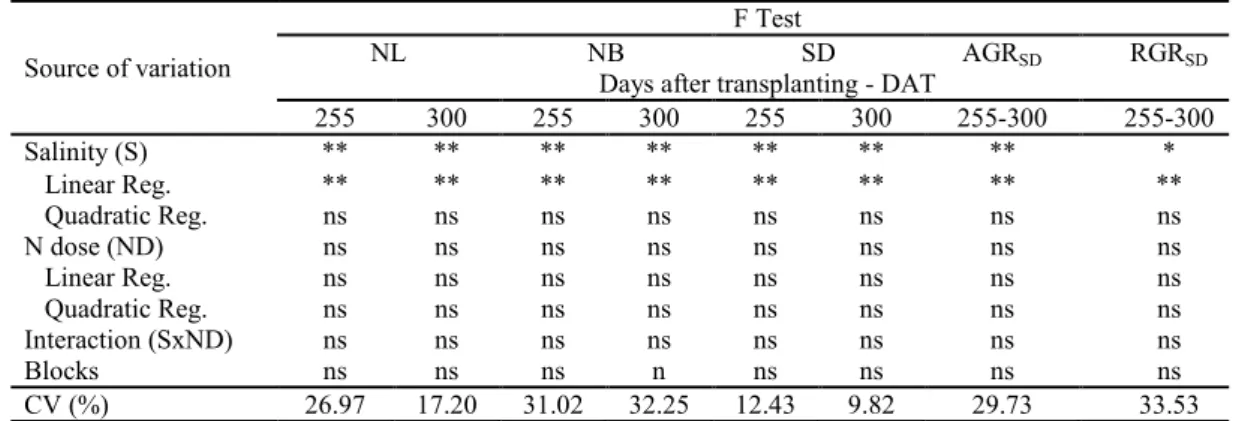
Table 2. Summary of the results of the F test for number of leaves (NL), number of branches (NB), stem diameter (SD), and absolute (AGRSD) and relative (RGRSD) growth rates of stem diameter, at 255 and 300 days after transplanting of the
guava cv. ‘Paluma’, under different levels of irrigation water salinity and nitrogen doses.
Source of variation
F Test
NL NB SD AGRSD RGRSD
Days after transplanting - DAT
255 300 255 300 255 300 255-300 255-300
Salinity (S) ** ** ** ** ** ** ** *
Linear Reg. ** ** ** ** ** ** ** **
Quadratic Reg. ns ns ns ns ns ns ns ns
N dose (ND) ns ns ns ns ns ns ns ns
Linear Reg. ns ns ns ns ns ns ns ns
Quadratic Reg. ns ns ns ns ns ns ns ns
Interaction (SxND) ns ns ns ns ns ns ns ns
Blocks ns ns ns n ns ns ns ns
CV (%) 26.97 17.20 31.02 32.25 12.43 9.82 29.73 33.53
ns, **, * denote not significant, significant at p<0.01, and significant at p<0.05, respectively.
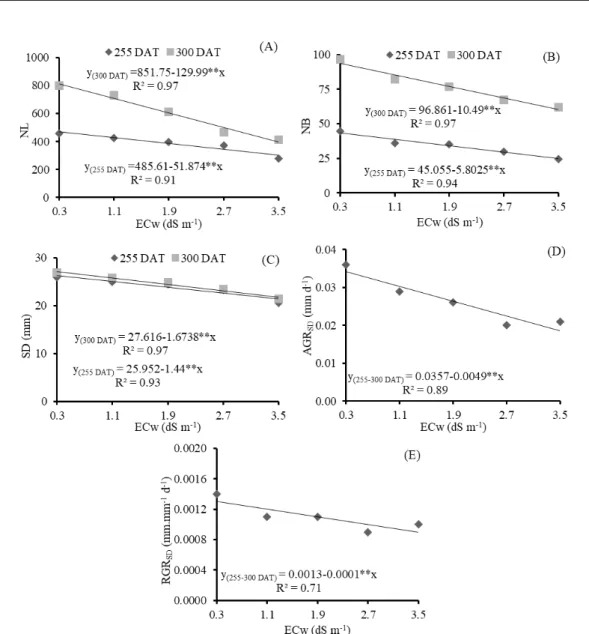
The number of leaves was linearly and negatively affected by water salinity (Figure 3A), with relative reductions of 10.68% (255 DAT) and 15.26% (300 DAT) per unit increase in ECw. Plants
irrigated with water with an ECw of 3.5 dS m-1
showed reductions of 35.31% (165.98 leaves) and 51.18% (415.96 leaves) , respectively, in comparison
to those subjected to water with an ECw of 0.3 dS m-1. When subjected to saline stress, plants
commonly exhibit morphological and anatomical alterations such as reduction in the number of leaves, which lead to reductions in transpiration to maintain the low rate of saline water absorption (OLIVEIRA et al., 2013).
Similar behavior was observed for the number of branches of the guava cv. ‘Paluma’, which decreased linearly as irrigation water salinity increased. According to the regression equations (Figure 3B), there were relative reductions in the NB of 12.87 (255 DAT) and 10.83% (300 DAT) per unit increase in ECw, leading to decreases of 42.86 and 35.82%, respectively, in plants irrigated with the
highest ECw level (3.5 dS m-1), in comparison to
those with ECw of 0.3 dS m-1. With regards to the effects of salinity on stem diameter at 255 and 300 DAT (Figure 3C), increments in water salinity led to linear reductions of 5.54 and 6.06% per unit increase in ECw, i.e., reductions of 4.60 mm (18.05%) and 5.35 mm (19.75%) in the SD of guava plants
subjected to the highest level of salinity (3.5 dS m-1)
compared with those irrigated with 0.3 dS m-1 water,
respectively.
Irrigation water salinity negatively affects
plant growth, due to the specific effects of the ions and the osmotic effect that delay cell expansion and division, leading to negative consequences for photosynthetic rate, and damaging the plants’ physiological and biochemical processes (GOMES et al., 2011; NUNES et al., 2012). Consequently, it causes a reduction in SD.
Increase in irrigation water salinity had a negative effect (Figure 3D) on the absolute growth rate of the stem diameter from 255 to 300 DAT, with a relative reduction of 13.72% per unit increase in ECw, corresponding to a reduction of 45.85%
(0.0156 mm day-1) in the AGR
SD of plants irrigated
using water with an ECw of 3.5 dS m-1, in
comparison to those subjected to water with an ECw
of 0.3 dS m-1. The reduction in AGR
SD due to saline
stress, is probably related to the use of energy substrates responsible for plant growth in the synthesis of organic solutes, to allow for osmotic adjustment (MUNNS, 2005).
Like the trend observed for AGRSD, RGRSD
was also affected by saline stress (p<0.01) from 255
to 300 DAT (Table 2). RGRSD decreased linearly by
7.69% per unit increase in ECw (Figure 3E), a
reduction of 0.00032 mm mm-1 day-1 (25.19%) in the
RGRSD of plants irrigated with 3.5 dS m-1 water in
comparison to those irrigated with 0.3 dS m-1 water.
According to Sousa, Bezerra and Farias (2011), these reductions are related to the decrease in water
availability or excessive accumulation of Na+ and Cl
Rev. Caatinga
Figure 3. Number of leaves - NL (A), number of branches - NB (B), and stem diameter - SD (C), at 255 and 300 days after
transplanting (DAT); and absolute growth rate – AGRSD (D), and relative growth rate - RGRSD (E), from 255 to 300 DAT in
the guava cv. ‘Paluma’, cultivated under different levels of irrigation water salinity.
CONCLUSIONS
Irrigation using water with an ECw above
0.3 dS m-1, negatively affects the internal CO
2
concentration, stomatal conductance, CO2
assimilation rate, transpiration, and instantaneous water use efficiency, as well as number of leaves and branches, stem diameter and absolute and relative growth rates of guava, cv. ‘Paluma’, at 255 and 300 DAT. Guava plants, cv. ‘Paluma’, can be irrigated using water with an ECw of up to 1.42 dS
m-1, with an acceptable reduction of 10% in its
growth variables. Nitrogen doses neither mitigated the effects of irrigation water salinity nor had significant effects on the studied variables. Guava plants were not significantly affected by the interaction between irrigation water salinity and nitrogen doses.
ACKNOWLEDGMENTS
The authors thank the National Council for Scientific and Technological Development (CNPq)
for the financial support to the research and the
Coordination for the Improvement of Higher Education Personnel (CAPES/FAPERO) for granting the scholarship to the first author.
REFERENCES
AMORIM, A. V. et al. Respostas fisiológicas de plantas adultas de cajueiro anão precoce à salinidade. Revista Ciência Agronômica, Fortaleza, v. 41, n. 1,
p. 113-121, 2010.
BENINCASA, M. M. P. Análise de crescimento de
CAVALCANTE, L. F. et al. Crescimento de mudas de maracujazeiro amarelo em solo salino com esterco
bovino líquido fermentado. Revista Brasileira de
Ciências Agrárias, Recife, v. 4, n. 4, p. 414-420, 2009.
DIAS, M. J. T. et al. Adubação com nitrogênio e potássio em mudas de goiabeira em viveiro
comercial. Ciências Agrárias, Londrina, v. 33, Sup.,
p. 2837-2848, 2012.
DIAS, T. J. et al. Produção do maracujazeiro e resistência mecânica do solo com biofertilizante sob
irrigação com águas salinas. Revista Ciência
Agronômica, Fortaleza, v. 42, n. 3, p. 644-651, 2011.
FERREIRA, D. F. Sisvar: um sistema computacional
de análise estatística. Ciência e Agrotecnologia,
Lavras, v. 35, n. 6, p. 1039-1042, 2011.
FREIRE, J. L. O. et al. Rendimento quântico e trocas gasosas em maracujazeiro amarelo sob salinidade
hídrica, biofertilização e cobertura morta. Revista
Ciência Agronômica, Fortaleza, v. 45, n. 1, p. 1-10, 2014.
GOMES, K. R. et al. Respostas de crescimento e fisiologia do milho submetido a estresse salino com
diferentes espaçamentos de cultivo. Revista
Brasileira de Engenharia Agrícola e Ambiental,
Campina Grande, v. 15, n. 4, p. 365-370, 2011.
HUNT, D. F. Measurements of photosynthesis and
respiration in plants. Physiologia Plantarum,
Copenhagen, v. 117, n. 3, p. 314-325, 2003.
MANICA, I. et al. Goiaba: do plantio ao
consumidor. Tecnologia de produção, pós
-colheita, comercialização. 1. ed. Porto Alegre, RS: Cinco Continentes, 2001. 119 p.
MUNNS, R. Genes and salt tolerance: Bringing them
together. New Phytologist,Cambridge, v. 167, n. 3,
p. 645-663, 2005.
NEVES, A. L. R. et al. Trocas gasosas e teores de
minerais no feijão-de-corda irrigado com água salina
em diferentes estádios. Revista Brasileira de
Engenharia Agrícola e Ambiental, Campina
Grande, v. 13, Sup., p. 873-881, 2009.
NUNES, J. C. et al. Comportamento de mudas de nim à salinidade da água em solo não salino com
biofertilizante. Revista Brasileira de Engenharia
Agrícola e Ambiental, Campina Grande, v. 16, n. 11, p. 1152-1158, 2012.
OLIVEIRA, F. A. et al. Interação entre salinidade e
bioestimulante na cultura do feijão caupi. Revista
Brasileira de Engenharia Agrícola e Ambiental,
Campina Grande, v. 17, n. 5, p. 465-471, 2013.
OLIVEIRA, F. T. et al. Respostas de porta-enxertos
de goiabeira sob diferentes fontes e proporções de
materiais orgânicos. Comunicata Scientiae, Bom
Jesus, v. 6, n. 1, p. 17-25, 2015.
PARIDA, A. K.; DAS, A. B. Salt tolerance and
salinity effects on plants: A review. Ecotoxicology
and Environmental Safety, New York, v. 60, n. 3,
p. 324-349, 2005.
PRAXEDES, S. C. et al. Salt tolerance is associated with differences in ion accumulation, biomass allocation and photosynthesis in cowpea cultivars. Journal of Agronomy and Crop Science, Madison,
v. 196, n. 3, p. 193-204, 2010.
RAMOS, D. P. et al. Produção e qualidade de frutos da goiabeira ‘Paluma’, submetida à diferentes épocas
de poda em clima subtropical. Revista Ceres,
Viçosa, v. 57, n. 5, p. 659-664, 2010.
RHOADES, J. D.; KANDIAH, A.; MASHALI, A. M. Uso de águas salinas para produção agrícola. 1. ed. Campina Grande: UFPB, 2000. 117 p. (Estudos da FAO. Irrigação e Drenagem, 48).
SERRAJ, R.; SINCLAIR, T. R. Osmolyte accumulation: Can it really help increase crop yield
under drought conditions? Plant Cell and
Environment, Oxford, v. 25, n. 2, p. 333-341. 2002.
SILVA, F. L. B. et al. Interação entre salinidade e biofertilizante bovino na cultura do feijão-de-corda. Revista Brasileira de Engenharia Agrícola e Ambiental, Campina Grande, v. 15, n. 4, p. 383– 389, 2011.
SILVA, F. L. B. et al. Irrigação com águas salinas e uso de biofertilizante bovino nas trocas gasosas e
produtividade de feijão-de-corda. Irriga, Botucatu,
v. 18, n. 2, p. 304-317, 2013.
SILVA, M. A. et al. Pigmentos fotossintéticos e índice Spad como descritores de intensidade do
estresse por deficiência hídrica em cana-de-açúcar.
Bioscience Journal, Uberlândia, v. 30, n. 1, p. 173 -181. 2014.
SOUSA, A. B. O.; BEZERRA, M. A.; FARIAS, F. C. Desenvolvimento inicial do clone BRS 275 de cajueiro sob irrigação com diferentes níveis salinos. Revista Brasileira de Agricultura Irrigada,
Fortaleza, v. 4, n. 3, p. 166-171, 2011.
SOUZA, L. P. et al. Formation of ‘Crioula’ guava rootstock under saline water irrigation and nitrogen
Rev. Caatinga
e Ambiental, Campina Grande, v. 20, n. 8, p. 739 -745, 2016.
SOUZA, R. P. et al. Fotossíntese e acúmulo de solutos em feijoeiro caupi submetido à salinidade. Pesquisa Agropecuária Brasileira, Brasília, v. 46,
n. 6, p. 587-592, 2011.
TAIZ, L.; ZEIGER, E. Fisiologia vegetal. 5. ed.
Porto Alegre, RS: Artmed. 2013. 954 p.