Original Article (short paper)
The effect of matinal active walking on cognitive, fine motor coordination
task performances and perceived difficulty in 12-13 young school boys
Elghoul Yousri1 , Fatma Bahri1 , Chaari Nesrine1 , Souissi Nizar2 , Frikha Mohamed3,4
1Sfax University, High Institute of Sport and Physical Education, Sfax, Tunisia; 2Higher Institute of Sport and
Physical Education of Ksar Said, Tunisia; 3King Faisal University, Department of Physical Education, Al Hufūf, KSA; 4University of Sfax, Research Sfax Unit (EM2S), High Institute of Sport and Physical Education, Sfax, Tunisia
Abstract –– Aim: The current study examined the relationship between cognitive performances (executive function,
selective attention and reaction time), fine motor coordination skills and perceived difficulty after active transport to
school. Method: Fifteen right-handed children’s underwent session, 15-min walking session at 30% (WS1) and 15-min walking session (WS2) at 50% of maximal aerobic speed. Subjects performed tests to evaluate executive function, reaction
time and selective attention. After each trial, a questionnaire of perceived difficulty (PD) was completed. Results: Average
time in TMT part A (F(2,22) = 4.44; p = 0.024; η2= 0.288) and TMT part B (F(2,22) = 4.54; p = 0.022; η2= 0.292), and
committed errors (F(2,22) = 7.78; p = 0.003; η2= 0.414) was improved after walking sessions in comparison by CS.
The mean scores were significantly higher after walking sessions for both long and short-distance throws (p < 0.05). Moreover, a significant negative correlation was found between committed errors (TMT part B) and both dart throwing consistency and accuracy (r = - 0.6; r = - 0.64; p < 0.05) (respectively). Post-hoc analysis showed that PD was better after
walking sessions with low intensity for both short and long throwing distance. However, it seems that walking session with sustained intensity allows speed and accuracy improvement of cognitive processing. Conclusion: Thus, active walking
to school with low intensity was sufficient to produce positives changes in psychomotor performance and decrease in perceived difficulty scores. By including individual differences in gross motor coordination as well as physical activity
level, the exact nature of the link between psychomotor skills and cognitive performance could be more addressed.
Keywords: active transport; boys; fine motor coordination; cognitive performances; perceived difficulty.
Introduction
Physical activity (PA) is important for optimal childhood growth
and development; the majority of children in developed countries
are insufficiently active1. However, recent findings of systematic
review confirm that PA is associated with numerous health benefits in school-aged children and youth. Journey between
home and school become an important, potential source of
PA for children2,3,4. Active Transportation (AT) to and/or from school (i.e., walking and biking) is one potential opportunity to be physically active, given that many children can incorporate this behavior into their daily routine1,2,5. Recently, Cooper et al.6 showed that the journey to school of children who used
AT, could contribute towards reaching daily PA requirements.
Although recently research support thesis that AT is associated with a healthier body composition and higher levels of
cardio-respiratory fitness among youth7.
Generally, the literature shows that executive functions including attention, working memory, problem solving, cognitive
flexibility, verbal fluency, decision making, and inhibitory control receive the most benefit from acute exercise8. In addition, a
previous study concluded that increasing task difficulty or
complexity may help to augment the effect of acute exercise on accuracy and speed of processing9. Moreover, moderate intensity
exercise may be more beneficial to executive function (EF);
whereas high-intensity exercise may be beneficial to information
processing8. In primary school-aged children, author’s found positive relation between total volume of light intensity physical activity and executive function (namely: planning performance)10.
Recent studies suggest specific relationships between aspects
of motor coordination and EF11. In addition, fine motor skills and EF can be considered as powerful predictors of school readiness and of subsequent academic achievement12,13. Thus, a recent hypothesis highlighted that physical activity targeted to increase
both physical fitness and motor skills may have the potential to
positively affect executive functions and academic performance14.
Furthermore, the results show a significant correlation between perceived difficulty (PD) and EF in situations which higher levels of difficulty. Higher EF performance approves the ability to manage better the level of task difficulty15. Li and Belkin16
define task difficulty as a subjective perception assessed by task
doers. It could be formed in both pre and post-task17. Recent
research shows that performance is limited by task difficulty,
often in the form of a trade-off between speed and accuracy. Learning consists of breaking through this limit18. This new
information about how to manipulate task difficulty is important
when adapting tasks for use with children of different ages19. Regarding active transport study, only one reported that active commuting to school and its duration (more than 15 min) may
positively influence cognitive performance (verbal, numeric,
and reasoning abilities and an overall score) in adolescent girls but not in boys20. Furthermore, this study uses subjective data participants; do not consider their extracurricular physical activity and walking intensity to school. The majority of walking studies to school were based on parents’ reports21.
The current study examined the relationship between (i) ognitive performances (executive function, selective
attention and reaction time) (ii) and perceived difficulty in fine
motor coordination tasks after walking to school among 12-13 young boys.
Participants
Fifteen right-handed children (age = 12.33 ± 0.9 years, body height = 157 ± 8.4, body mass = 45.4 ± 8.1 kg and
MAS = 13.8 ± 1; mean ± SD) volunteered to participate in this
study. They had no previous experience of the tasks they were asked to perform. All subjects participated in their physical activity classes 1–2 times per week and they did not have any outside-school activities. The protocol was explained in full and any questions were answered before a written informed consent was obtained from the children’s parents and the children themselves. The study design received clearance from the Institutional Research Board before the commencement of
this study procedure. The University Scientific Board approved this study with the number H2017/86. Participants visited the
laboratory on four occasions in order to complete a familiarization session and three experimental trials.
Procedure
During the familiarization session, participants threw a bloc
of ten darts in each condition and then performed the Yo-Yo intermittent recovery test (Yo-Yo) in order to determine the maximal aerobic velocity (MAV)22. The Yo-Yo protocol was
performed on a nonslip wooden floor of an indoor gym. Participants
then participated in three experimental trials in a randomized manner at the same time of day (07:00 h), separated at least by
five days. The three trials consisted of a no-walking session
(no-WS: Control session (CS)) (Subjects performed a dart-throwing test and cognitive tasks)15 and two 15-min walking sessions (WS), with each WS trial performed at a different intensity as reported by4. After each WS subjects performed a dart-throwing test in two experimental sessions and cognitive tasks.
All WS trials were performed on the same motorized
treadmill (COSMED T170, Italy). The intensity of each WS
was determined as follows:
WS 1 = intensity at 30% of maximal aerobic speed WS 2 = intensity at 50% of maximal aerobic speed After each dart throw, the score for the dart was recorded and then the dart was collected for the next throw23. An official dartboard was placed on a wall so that its center was at eye
level for each subject. Participants threw ten darts from two distances in randomized order. The first distance was 2 m (SD); the second was at the regular distance of 2.37 m (LD). The
two distances were marked by a line on the floor15. After each
session, a questionnaire to asses PD (DP-15) was completed
by the subjects. This scale is composed of 15 points numbered 1–15 and is anchored at the two extremities by verbal labels –
“Extremely easy” and “Extremely difficult” 24.
Yo-Yo intermittent recovery test
The Yo-Yo IR1 consisted of repeated 2 × 20-m of running at a progressively increased speed controlled by audio beeps from a tape recorder25. Between each running bout the participants had a 10-s
rest period. When the participant failed to reach the finishing line
in time twice, the distance covered was recorded and represented the test result. The test was performed indoor (on a 2-m-wide and 20-m-long running lane marked by cones). Six participants performed the test simultaneously with strong verbal encouragement provided to the subjects throughout the test. Total distance was reported as the performance criterion in the Yo-Yo IR126.
Score calculations
Each throw was scored according to its position on the board (0–10). A dart that missed the board or that bounced
off was given a score of ‟0”. The target consisted of a series of 10 concentric rings. Participants’ dart throwing accuracy and consistency were evaluated using three scores. The first
was the mean score of the ten throws. This score could range from 0 (all misses) to 10 (all bulls-eyes); it can be considered a measure of accuracy, a high score indicating high accuracy. The second measurement was the numbers of zeros scored (number of times the target was missed). This score could range from 0 to 10, a low number of zeros indicating high accuracy. The third
measure of performance was the coefficients of variation of the score: [SD scores] ⁄ [mean score], a lower coefficient indicating
a higher consistency15.
The barrage test (i.e. a paper-pencil test)
The barrage test is a psychometric task, which measure visual-spatial ability, attention, and recognition. It involves visual discrimination; the subject must circle all the targets (bells) that are encountered. A total of 35 targets (bells), were distributed equally in seven columns. In each column, there was the same number of targets (N = 5) and of distracters (N = 40). All drawings were black – like Chinese shadows. Subject performance was evaluated quantitatively (number of bells crossed and omitted). The duration of the test was 3 min, a higher number of correct
responses reflecting better performance27.
The choice RT (Using React’s software)
of different colored geometric forms. When the target appeared, the subject was required to press a button as soon as possible, and the computer calculated the RT. The time between presenting each form was 300 ms and each subject had 20 targets presented15.
Scores were expressed in seconds; higher scores reflect poorer
performance.
Trail making test
This is a test exploring mental flexibility EF (aptitude to
move quickly from one task to another)28. In Part A, circles were numbered 1–25 and presented randomly on a sheet of paper; subjects were required to draw lines to connect the numbers in
ascending order. In Part B, the circle included both numbers (1–15) and letters (A–L); as in Part A, the child was required
to draw lines to connect the circles in an ascending pattern, but with the added task of alternating between the numbers and letters (i.e. 1-A-2-B-3-C, etc.); the child was also instructed to connect the circles as quickly as possible without lifting the pen or pencil from the paper. The duration of the test was 3 min for each part. The trail-making test (TMT) measures visual conceptual and visuo-motor tracking. TMT part A purportedly measures attention, visual search, and motor function, whereas TMT part B is seen as a measure of EF, speed of attention, visual search, and motor function29. Outcome measures for both tasks included time to completion and number of errors29. Results for both TMT A and B are reported as the number of seconds required to complete the task30 errors committed and corrected. Higher scores reveal greater impairment.
Statistical analysis
All statistical tests were processed using STATISTICA
Software (StatSoft, Paris, France). Data were reported as mean ± SD. The Kolmogorov–Smirnov test of normality revealed the
data which were normally distributed; therefore, parametric tests were performed. To examine the associations between
cognitive performance and other variables, Pearson correlation
analyzes were used.
Performance measures and difficulty of perception were
analyzed using a two-way ANOVA with repeated measures
[2(Distance) × 3(walking session)]. ANOVA with repeated
measures used to analyze walking sessions and cognitive
performance. When appropriate, significant differences between
means were assessed using post hoc tests. Effect sizes were
calculated as partial eta-squared η2 to estimate the meaningfulness
of significant findings. Partial eta squared values of 0.01, 0.06 and
0.13 represent small, moderate, and large effect sizes, respectively.
The level of statistical significance was set at p < 0.05.
Results
Analysis of the performance throws (mean scores:
measure of accuracy) resulted in no significant interaction
effect walking session × distance of throw (F(2,22) = 0.41; p
=0.66; η2 = 0.036). There was a significant main effect for walking session (WS) (F(2,22) = 4.68; p = 0.02; η2= 0.298) and distance of throw (F(2,22) = 8.21; p = 0.01; η2 = 0.427).
Post-hoc analyses demonstrated a significant difference between
mean scores after the two walking sessions (WS1 and WS2).
The mean scores were significantly higher after WS1 and WS2 for both long- and short-distance (LD and SD) throws (p < 0.05). Furthermore, there were significant differences between mean scores after WS 2 between SD and LD (p = 0.03). Additionally, the ANOVA revealed no significant effect
of walking session (F(2,22) = 1.27; p = 0.29; η2 = 0.103) and distance of throw (F(2,22)= 0.37; p = 0.55; η2 = 0.033) for errors
(numbers of zeros). Finally, ANOVA also revealed a significant
walking session effect (F(2,22) = 5.75; p = 0.009; η2 = 0.343) for the consistency which the darts were thrown. The pos-hoc
analysis showed that the coefficient of variation (CV) of the mean of the scores was significantly different only in the CS between SD and LD. CV was better after WS1 than WS2 and
CS (respectively).
Analysis revealed a significant effect of walking session
(F(2,22) = 4.44; p = 0.024; η2 = 0.287) for EF (average time in TMT part A). The post-hoc analysis showed that completion time
(TMT part A) was significantly different after both WS1 and WS2 in comparison by CS (Table1). No significant difference
was found for committed and corrected errors in TMT part A.
Analysis revealed significant effect of walking session
(F(2,22) = 4.54; p = 0.022; η2= 0.292) for EF (average time in
TMT part B). Post-hoc analyses demonstrated a significant
difference between time in TMT part B after the two walking sessions (WS1 and WS2) in comparison by CS (Figure1).
Moreover, significant difference was found in committed errors
in TMT part B (F(2,22) = 7.78; p = 0.002; η2= 0.414) (Table1).
Post-hoc analysis shows that better performance was recorded
after WS1 in comparison by WS2 and CS (respectively).
Results showed significant positive correlations after CS
between committed errors in TMT part A and corrected errors
in TMT part B (r = 0.63; p < 0.05). Results showed also a significant positive correlation after CS in EF (TMT part B) between average time and corrected errors (r = 0.67; p < 0.05). The links between fine motor coordination skills and EF were investigated. Data’s showed no significant difference between measured variables in fine coordination task (throwing
task) and TMT (part A and B) after CS and WS1. There was
a significant positive correlation after WS2 between mean score in LD and committed errors (TMT part B) (r = 0.76; p < 0.01). Moreover, a significant negative correlation was
found between committed errors (TMT part B) and both CV
and number of zeros (r = - 0.6; p < 0.05; r = - 0.64; p < 0.05)
(respectively).
Analysis of reaction time data’s, results showed a no
significant main effect of walking session (F(2,22) = 1.97; p = 0.163;
η2 = 0.152) on average time in reaction time (Table 1). There was
a significant positive correlation between RT and average time
after WS2 (r = 0.58; p < 0.05). No significant correlation was
found between RT and measured variables in fine coordination
The ANOVA of selective attention revealed a no significant
walking session effect (F(2,22) = 1.801; p = 0.189; η2 = 0.141) for
SA (Table 1). There was no significant correlation between all
variables of our study in CS and WS1. In WS2, there was a
significant positive correlation between SA (Crossed bells) and EF (committed errors in TMT part B) (r = 0.76; p < 0.01). Results also showed significant negative correlations only after WS2
between SA (Unbarred bells) and FE (committed errors in TMT
part B) (r = - 0.76; p < 0.01). In addition, significant correlation
was found only after WS2 between SA and accuracy measures
(errors and mean scores). Results showed significant negative correlation between SA (Crossed bells) and errors in LD (r = - 0.57; p < 0.05), in contrary a positive significant correlation between SA (Unbarred bells) and errors in LD (r = 0.57; p < 0.05). Finally, there was a significant positive correlation between SA (Crossed bells) and means scores in SD (r = 0.66; p < 0.05). A significant
negative correlation was found between SA (Unbarred bells) and
means scores in SD (r = -0.66; p < 0.05).
Table 1. Mean ± SD values for cognitive performances measures: RT; barrage test; and EF (TMT parts A and B) at CS, WS1 and WS2.
CS WS1 WS2 F
(2,22) p η2
TMT Part A
Average time (s) 45,02±18,75 31,43±9,56* 31,94±12,62* 4,442 0,024 0,288
Committed errors 0,33±1,15 0±0 0,25±0,45 0,67 0,52
Corrected errors 0±0 0±0 0,17±0,39 2,2 0,13
TMT Part B
Average time (s) 115,7±46,7 79,2±41,5* 82±34,9* 4,546 0,022 0,292
Committed errors 9,25±5,24 3,42±4,54*** 6,08±3,6* 7,781 0,003 0,414
Corrected errors 0,42±0,79 1,08±2,84 0,33±0,65 0,788 0,467 0,067
Barrage test Crossed bells (CB) 32,08±1,56 33,17±1,75 33,08±1,56 1,801 0,189 0,141
Unbarred bells (CNB) 2,92±1,56 1,83±1,75 1,92±1,56 1,801 0,189 0,141
Reaction
Time Average time (s) 0,42±0,04 0,4±0,03 0,39±0,05 1,971 0,163 0,152
* Significantly different from CS at p < .05; ** p < .01; *** p < .001.
Figure 1. Average time completion and committed error in Trail Making Test (Part B) (second and number of error, respectively) at CS, WS1 and WS2. CS indicates Control session; WS30%: Walking session at 30% of the maximal aerobic velocity (MAV); WS50%: Walking session at 50% of the MAV.
*, ***: significant difference between CS, WS1 and at the level of p < 0.05 and p< 0.001 for the same condition respectively.
There was a significant main effect of walking session for perceived difficulty (PD) (F(2,22)= 11.54; p < 0.001; η
2 = 0.512).
Additionally, the ANOVA revealed significant effect of distance
of throw (F(2,22) = 50.72; p < 0.001;η2 = 0.821) (Figure 2). However, the interaction walking session × distance of throw
was not significant (F(2,22) = 0.412; p > 0.05;η
2 = 0.036). The
pos-hoc analysis showed that PD was better after WS1 for both
short and long distance compared to WS1 and CS (respectively).
Figure 2. Perceived difficulty score on SD and LD at CS, WS1 and WS2. CS indicates Control session; WS30%, Walking session at 30% of the maximal aerobic velocity (MAV); WS50%, Walking session at 50% of the MAV; SD, Short distance of throw; LD, Long distance of throw.
*, **, ***: significant difference between CS, WS1 and at the level of p < 0.05 and p< 0.001 for the same
condition respectively.
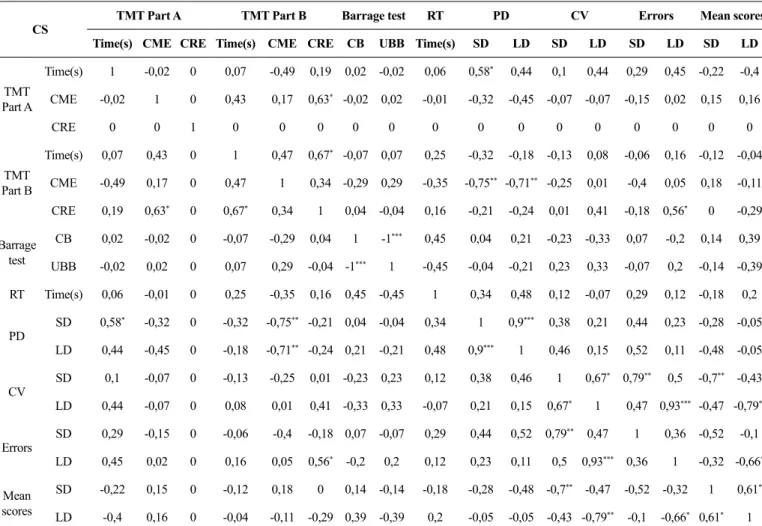
Table 2. Correlations between cognitive performances measures: reaction time (RT); barrage test; and executive function (TMT parts A and B), dart throwing scores: CV; Errors; and Mean scores) and perceived difficulty score (PD) at CS.
CS TMT Part A TMT Part B Barrage test
RT PD CV Errors Mean scores
Time(s) CME CRE Time(s) CME CRE CB UBB Time(s) SD LD SD LD SD LD SD LD
TMT
Part A
Time(s) 1 -0,02 0 0,07 -0,49 0,19 0,02 -0,02 0,06 0,58* 0,44 0,1 0,44 0,29 0,45 -0,22 -0,4
CME -0,02 1 0 0,43 0,17 0,63* -0,02 0,02 -0,01 -0,32 -0,45 -0,07 -0,07 -0,15 0,02 0,15 0,16
CRE 0 0 1 0 0 0 0 0 0 0 0 0 0 0 0 0 0
TMT
Part B
Time(s) 0,07 0,43 0 1 0,47 0,67* -0,07 0,07 0,25 -0,32 -0,18 -0,13 0,08 -0,06 0,16 -0,12 -0,04
CME -0,49 0,17 0 0,47 1 0,34 -0,29 0,29 -0,35 -0,75** -0,71** -0,25 0,01 -0,4 0,05 0,18 -0,11
CRE 0,19 0,63* 0 0,67* 0,34 1 0,04 -0,04 0,16 -0,21 -0,24 0,01 0,41 -0,18 0,56* 0 -0,29
Barrage test
CB 0,02 -0,02 0 -0,07 -0,29 0,04 1 -1*** 0,45 0,04 0,21 -0,23 -0,33 0,07 -0,2 0,14 0,39
UBB -0,02 0,02 0 0,07 0,29 -0,04 -1*** 1 -0,45 -0,04 -0,21 0,23 0,33 -0,07 0,2 -0,14 -0,39
RT Time(s) 0,06 -0,01 0 0,25 -0,35 0,16 0,45 -0,45 1 0,34 0,48 0,12 -0,07 0,29 0,12 -0,18 0,2
PD SD 0,58
* -0,32 0 -0,32 -0,75** -0,21 0,04 -0,04 0,34 1 0,9*** 0,38 0,21 0,44 0,23 -0,28 -0,05
LD 0,44 -0,45 0 -0,18 -0,71** -0,24 0,21 -0,21 0,48 0,9*** 1 0,46 0,15 0,52 0,11 -0,48 -0,05
CV
SD 0,1 -0,07 0 -0,13 -0,25 0,01 -0,23 0,23 0,12 0,38 0,46 1 0,67* 0,79** 0,5 -0,7** -0,43
LD 0,44 -0,07 0 0,08 0,01 0,41 -0,33 0,33 -0,07 0,21 0,15 0,67* 1 0,47 0,93*** -0,47 -0,79**
Errors SD
0,29 -0,15 0 -0,06 -0,4 -0,18 0,07 -0,07 0,29 0,44 0,52 0,79** 0,47 1 0,36 -0,52 -0,1
LD 0,45 0,02 0 0,16 0,05 0,56* -0,2 0,2 0,12 0,23 0,11 0,5 0,93*** 0,36 1 -0,32 -0,66*
Mean scores
SD -0,22 0,15 0 -0,12 0,18 0 0,14 -0,14 -0,18 -0,28 -0,48 -0,7** -0,47 -0,52 -0,32 1 0,61*
LD -0,4 0,16 0 -0,04 -0,11 -0,29 0,39 -0,39 0,2 -0,05 -0,05 -0,43 -0,79** -0,1 -0,66* 0,61* 1
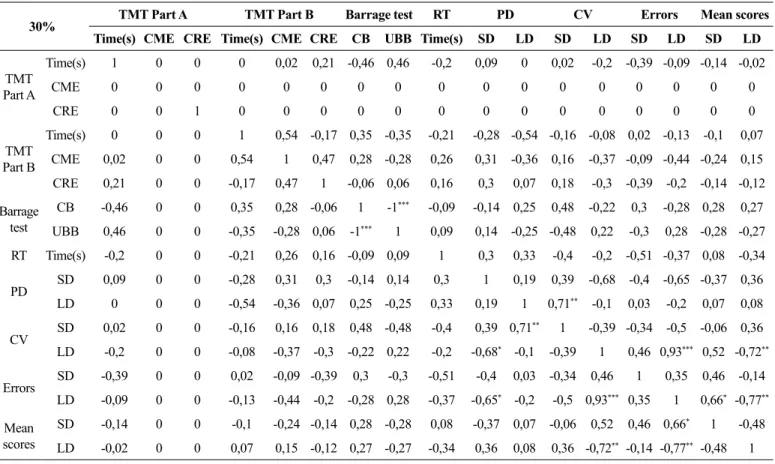
Table 3. Correlations between cognitive performances measures: reaction time (RT); barrage test; and executive function (TMT parts A and B), dart throwing scores: CV; Errors; and Mean scores) and perceived difficulty score (PD) at WS1.
30% TMT Part A TMT Part B Barrage test RT PD CV Errors Mean scores Time(s) CME CRE Time(s) CME CRE CB UBB Time(s) SD LD SD LD SD LD SD LD
TMT Part A
Time(s) 1 0 0 0 0,02 0,21 -0,46 0,46 -0,2 0,09 0 0,02 -0,2 -0,39 -0,09 -0,14 -0,02
CME 0 0 0 0 0 0 0 0 0 0 0 0 0 0 0 0 0
CRE 0 0 1 0 0 0 0 0 0 0 0 0 0 0 0 0 0
TMT Part B
Time(s) 0 0 0 1 0,54 -0,17 0,35 -0,35 -0,21 -0,28 -0,54 -0,16 -0,08 0,02 -0,13 -0,1 0,07
CME 0,02 0 0 0,54 1 0,47 0,28 -0,28 0,26 0,31 -0,36 0,16 -0,37 -0,09 -0,44 -0,24 0,15
CRE 0,21 0 0 -0,17 0,47 1 -0,06 0,06 0,16 0,3 0,07 0,18 -0,3 -0,39 -0,2 -0,14 -0,12
Barrage test
CB -0,46 0 0 0,35 0,28 -0,06 1 -1*** -0,09 -0,14 0,25 0,48 -0,22 0,3 -0,28 0,28 0,27
UBB 0,46 0 0 -0,35 -0,28 0,06 -1*** 1 0,09 0,14 -0,25 -0,48 0,22 -0,3 0,28 -0,28 -0,27
RT Time(s) -0,2 0 0 -0,21 0,26 0,16 -0,09 0,09 1 0,3 0,33 -0,4 -0,2 -0,51 -0,37 0,08 -0,34
PD SD 0,09 0 0 -0,28 0,31 0,3 -0,14 0,14 0,3 1 0,19 0,39 -0,68 -0,4 -0,65 -0,37 0,36 LD 0 0 0 -0,54 -0,36 0,07 0,25 -0,25 0,33 0,19 1 0,71** -0,1 0,03 -0,2 0,07 0,08
CV SD 0,02 0 0 -0,16 0,16 0,18 0,48 -0,48 -0,4 0,39 0,71
** 1 -0,39 -0,34 -0,5 -0,06 0,36
LD -0,2 0 0 -0,08 -0,37 -0,3 -0,22 0,22 -0,2 -0,68* -0,1 -0,39 1 0,46 0,93*** 0,52 -0,72**
Errors SD -0,39 0 0 0,02 -0,09 -0,39 0,3 -0,3 -0,51 -0,4 0,03 -0,34 0,46 1 0,35 0,46 -0,14 LD -0,09 0 0 -0,13 -0,44 -0,2 -0,28 0,28 -0,37 -0,65* -0,2 -0,5 0,93*** 0,35 1 0,66* -0,77**
Mean scores
SD -0,14 0 0 -0,1 -0,24 -0,14 0,28 -0,28 0,08 -0,37 0,07 -0,06 0,52 0,46 0,66* 1 -0,48
LD -0,02 0 0 0,07 0,15 -0,12 0,27 -0,27 -0,34 0,36 0,08 0,36 -0,72** -0,14 -0,77** -0,48 1
Table 4. Correlations between cognitive performances measures: reaction time (RT); barrage test; and executive function (TMT parts A and B), dart throwing scores: CV; Errors; and Mean scores) and perceived difficulty score (PD) at WS2.
50% Time(s)TMT Part ACME CRE Time(s)TMT Part BCME CRE Barrage testCB UBB Time(s)RT SDPDLD SDCVLD SDErrorsLD Mean scoresSD LD
TMT Part A
Time(s) 1 0,19 -0,11 0,27 0,13 0,31 0,36 -0,36 0,58* 0 -0,06 -0,12 -0,01 -0,27 -0,09 0,07 -0,17
CME 0,19 1 0,77** -0,32 -0,01 -0,31 -0,16 0,16 0,25 -0,22 -0,49 0,08 0,04 0,24 0,19 0,1 -0,23
CRE -0,11 0,77** 1 -0,41 -0,14 -0,24 -0,17 0,17 0,36 0 -0,17 -0,25 -0,13 -0,11 -0,09 0,28 -0,19
TMT Part B
Time(s) 0,27 -0,32 -0,41 1 0,48 0,22 0,46 -0,46 -0,15 0,66* 0,56* 0,09 -0,29 0,04 -0,27 0,02 0,41
CME 0,13 -0,01 -0,14 0,48 1 0,37 0,76** -0,76** -0,12 0,1 -0,16 0,07 -0,6* 0,14 -0,64* 0,46 0,76**
CRE 0,31 -0,31 -0,24 0,22 0,37 1 0,51 -0,51 0,36 0,08 0,02 -0,41 -0,32 -0,26 -0,41 0,58* 0,28
Barrage test
CB 0,36 -0,16 -0,17 0,46 0,76** 0,51 1 -1*** 0,16 0,26 0,1 -0,32 -0,39 -0,34 -0,57* 0,66* 0,45
UBB -0,36 0,16 0,17 -0,46 -0,76** -0,51 -1*** 1 -0,16 -0,26 -0,1 0,32 0,39 0,34 0,57* -0,66* -0,45
RT Time(s) 0,58* 0,25 0,36 -0,15 -0,12 0,36 0,16 -0,16 1 -0,11 -0,14 -0,28 0,08 -0,34 -0,07 0,24 -0,25
PD SD 0 -0,22 0 0,66* 0,1 0,08 0,26 -0,26 -0,11 1 0,9*** -0,25 -0,44 -0,29 -0,41 0 0,25 LD -0,06 -0,49 -0,17 0,56* -0,16 0,02 0,1 -0,1 -0,14 0,9*** 1 -0,27 -0,21 -0,41 -0,27 -0,12 0,01
CV SD -0,12 0,08 -0,25 0,09 0,07 -0,41 -0,32 0,32 -0,28 -0,25 -0,27 1 0,27 0,9
*** 0,44 -0,71** 0,07
LD -0,01 0,04 -0,13 -0,29 -0,6* -0,32 -0,39 0,39 0,08 -0,44 -0,21 0,27 1 0,22 0,91*** -0,27 -0,81***
Errors SD -0,27 0,24 -0,11 0,04 0,14 -0,26 -0,34 0,34 -0,34 -0,29 -0,41 0,9
*** 0,22 1 0,46 -0,49 0,13
LD -0,09 0,19 -0,09 -0,27 -0,64* -0,41 -0,57* 0,57* -0,07 -0,41 -0,27 0,44 0,91*** 0,46 1 -0,46 -0,69**
Mean scores
SD 0,07 0,1 0,28 0,02 0,46 0,58* 0,66* -0,66* 0,24 0 -0,12 -0,71** -0,27 -0,49 -0,46 1 0,17
LD -0,17 -0,23 -0,19 0,41 0,76** 0,28 0,45 -0,45 -0,25 0,25 0,01 0,07 -0,81*** 0,13 -0,69** 0,17 1
Discussion
The aim of this study was to explore the relationship of the cognitive performances (executive function, selective
attention and reaction time) and perceived difficulty in fine
motor coordination tasks after the portion of active transport to school. The data supported the hypothesis that achieving walking session to school with appropriate intensity enables differential improvement on the measured cognitive variables (executive
function, selective attention and reaction time). Findings confirm that only EF (cognitive flexibility) can be improved by gains in speed process and in errors committed numbers. Positives
changes in psychomotor performance were demonstrated by
accessing throwing tasks and a diminution PD scores in the same fine motor coordination tasks was observed.
Improvement in EF was demonstrated by the decrease in time completion for trail-making task (part A and B) and committed errors only in trail-making task (part B). To our knowledge, this
is the first study that shows that the improvement in cognitive
function differs between the processes and it was related to
intensities of walking session to school. Previous findings suggest
that active commuting to school was associated with better in
boys was positively associated with objectively PA assessment31 and cognitive performance (namely: verbal ability, numeric ability, reasoning ability, overall cognitive performance) in adolescent girls who spent more than 15 minutes than those who spent less time20. Other researchers have suggested that in older adults performing an executive processing task, response times decreased and response errors increased when walking at faster speed compared with walking at slower speed32. On the other hand, the young healthy subjects can increase the ability
to walk at higher speeds and a difficult cognitive task with
no drop in performance33. In addition, the majority of studies
observed positive associations between PA and number of tests
measuring EF34,35,36. Furthermore, three studies have identified
no significant positive associations37,38,39. Despite the fact that it is not yet clear the typical physical activity patterns of children involving performance at the executive level10. Studies stipulate that children are engaged in low-intensity physical that can place a demand on their executive functioning10. The variation in the level of cognitive commitment of activity and age40 may
influence the development of the executive function. Recently,
EF was included as a predictor of early academic achievement41.
In line with our main finding, the associations between physical
activity and cognition, several mechanisms have been suggested
to explain a beneficial effect of physical activity on cognition42. The effect of exercise on the brain could be the result of several
factors including increased flow of blood and oxygen to the brain43. Other explanation supports the hypothesis of levels of chemicals and increased activity-dependent synaptic plasticity44. Moreover, previous studies conducted with children have indicated increased
efficiency in neural processing and changes in brain structures45,46. In addition, the moderate arousal level has been associated with the increased performance on the Trail-making test and these
findings are discussed in light of the inverted-U hypothesis47. Concerning the performance in the throwing task registered after
the two experimental sessions, secondary findings of the present
study showed that the mean scores and the standard deviations of the mean score (CV) were better after WS1 compared to WS2 and CS (respectively). After WS1 sessions, our results showed that
means score were not significantly different in comparison with WS2. In addition, no significant difference was recorded between
WS1 and WS2 in errors (number of zeros). However, the standard
deviations of the mean score were significantly different only in LD after SW1 in comparison with WS2 conditions. It is difficult to compare our results with those in the scientific literature due
the lack of previous study. In addition, the result of the present study could be attributed to the consistency improvement. The enhancement of the subject performance is linked to its ability to reduce disparities between the thrown. Strong positive correlations between the number of zeros scored and the standard deviation
for only LD after WS2 support these findings.
Further explanation for the results considers that the improvement of psychomotor performance can be explained by the increase of the activity from the same groups of muscles essential to the test. In this context, the current results support the view that there is a trade-off between force and accuracy48,49. This compromise was found in other studies of darts and tennis and badminton serves50,51,52 but not in all studies of darts throwing task53. That is, these results appear to be in dispute with those of Elghoul et al.15, and the improved psychomotor performance is correlated with executive function for the throws long distances.
In the morning, our results showed that PD values were significantly higher after the no-walking session in comparison
with WS2 and WS1 conditions (p<0.001) respectively. However,
the PD scores were significantly higher after no-WS both for SD and LD (p<0.001). In addition, no significant correlations
between PD and performances measures were found. One of the main findings in the current study was that PD of a throwing darts task at a dartboard was better after WS1 in both SD and LD. It seems that the same task was perceived less difficult
after SW1 than SW2 and no-WS conditions (respectively).
Previous studies have shown that the concept of task difficulty
is commonly introduced into psychological models dealing with motivation and emotion54. PD reflects mainly the amount of resources, or effort, that subjects have invested in the task in order to reach a given level of performance55. PD could be considered as an indicator of the amount of effort that a subject
intends to invest and/or has invested on the task. This finding
may be supported by mean scores result which better after WS1.
Therefore, subjective goal-difficulty could have a positive effect
on performance; in addition effects intensity walking, time of day, time awake, and the distance the darts need to be thrown56. Beyond the contradiction regarding the effect of an active transport to school, gender and age of the participants31, our results
induce new findings. It seems that 15 min duration of walking
session at 50% of MAS causes fatigue to our subjects but allows better EF improvement. In addition, the active walk to school with
low intensity (30% of MAS) was sufficient to produce positives changes in psychomotor performance and diminution in PD scores
in comparison with passive transport to the school. The results
of our study show that perceived difficulty supports this finding.
which gives an accurate result and possible reflection in order to better understand what beneficial for children. Also, this study
used several measures for cognitive processes, examining the relationships between cognitive and psychomotor performances. It is worth noting that effect sizes of this study were consistent
with medium to large effect. However, this study focuses on fine
motor coordination only. By including individual differences in gross motor coordination and physical activity level, the exact nature of the link between cognitive performance and psychomotor skills could be more resolved.
Conclusions
In conclusion, our results show evidence of a positive
relationship of active walk to school with both cognitive and fine motor coordination performance. In addition, findings support decrease in the value of PD for the same psychomotor tasks.
Additional explanations are needed to adjust the intensity and the duration of walking sessions to the demands of students or educators. However, more intervention studies are warranted in order to clarify possible mechanisms that made optimal relationship. In addition, it would be interesting to investigate whether using objective measures of commuting to school with different level of physical activity and tasks may provide more information on the relationships that we have found. The mode of transport to school can be retained as a source of differentiation between students.
References:
1. Pabayo R, Maximova K, Spence JC, Vander Ploeg K, Wu B, Veugelers PJ. The importance of Active Transportation to and from school for daily physical activity among children. Prev Med. 2012; 55(3): 196-200.
2. Tudor-Locke C, Ainsworth BE, Popkin BM. Active commuting to school: an overlooked source of childrens’ physical activity? Sports Med. 2001; 31(5):309-313.
3. Heelan KA, Donnelly JE, Jacobsen DJ, Mayo MS, Washburn R, Greene L. Active commuting to and from school and BMI in elementary school children—preliminary data. Child Care Health Dev. 2005; 31(3): 341–349.
4. Dessing D, de Vries S, Graham JM, Pierik HF. Active transport between home and school assessed with GPS: a cross-sectional study among Dutch elementary school children. BMC Public Health. 2014; 14(1): 1-8.
5. Sirard JR, Riner Jr, McIver KL, Pate RR. Physical activity and active commuting to elementary school. Med. Sci. Sports Exerc. 2005; 37(12): 2062–2069.
6. Cooper AR, Page AS, Wheeler BW, Griew P, Davis L, Hillsdon M, et al. Mapping the walk to school using accelerometry combined with a global positioning system. Am J Prev Med. 2010; 38( 2):178-183. 7. Lubans DR, Boreham CA, Kelly P, Foster CE. The relationship
between active travel to school and health-related fitness in chil-dren and adolescents: a systematic review. Int J Behav Nutr Phys Ac. 2011; 26: 8-5.
8. Chang YK, Labban JD, Gapin JI, Etnier JL. The effects of acute exercise on cognitive performance: A meta-analysis. Brain Res. 2012; 1453: 87-101.
9. McMorris T, Hale BJ. Differential effects of differing intensities of acute exercise on speed and accuracy of cognition: A meta-analytical investigation. Brain Cogn. 2012; 80(3): 338-51.
10. Van der Niet AG, Smith J, Sherder EJ, Oosterlaan J, Hartman E, Visscher C. Associations between daily physical activity and executive functioning in primary school-aged children. J Sci Med Sport. 2014; 18(6): 673-677.
11. Rigoli D, Piek JP, Kane R, Oosterlaan J. An examination of the relationship between motor coordination and executive functions in adolescents. Dev Med Child Neurol. 2012; 54(11): 1025-1031. 12. Grissmer D, Grimm KJ, Aiyer SM, Murrah WM, Steele JS. Fine
motor skills and early comprehension of the world: Two new school readiness indicators. Dev Psychol. 2010; 46(5): 1008-1017. 13. Cameron CE, Brock LL, Murrah WM, Bell LH, Worzalla SL,
Grissmer D, et al. Fine motor skills and executive function both contribute to Kindergarten achievement. Child Development. 2012; 83(4): 1229–1244.
14. Aadland KN, Moe VF, Aadland E, Anderssen SA, Resaland GK, Ommundsen Y. Relationships between physical activity, seden-tary time, aerobic fitness, motor skills and executive function and academic performance in children. Ment Health Phys Act. 2017; 12: 10-18.
15. Elghoul Y, Frikha M, Masmoudi L, Chtourou H, Chaouachi A, Chamari K, et al. Diurnal variation of cognitive performance and perceived difficulty in dart-throwing performance in 9-10 year old boys. Biol Rhythm Res. 2014; 45(5): 789-801.
16. Li Y, Belkin NJ. A faceted approach to conceptualizing tasks in information seeking. NFORM PROCESS MANAG. 2008; 44(6): 1822-1837.
17. Kim J. Task difficulty as a predictor and indicator of web searching interaction. Proceedings of CHI ‘06. 2006; April: 959–964. 18. Reis J, Schambra HM, Cohen LG, Buch ER, Fritsch B, Zarahn
E, et al. Noninvasive cortical stimulation enhances motor skill acquisition over multiple days through an effect on consolidation. Proc Nat Acad Sci. 2009; 106(5): 1590-1595.
19. Lindqvist S, Thorell LB. Brief report: manipulation of task difficulty in inhibitory control tasks. Child Neuropsychol. 2009; 15(1): 1-7. 20. Martinez-Gomez D, Ruiz JR, Gomez-Martinez S, Chillon P,
Rey-Lopez JP, Diaz LE, et al. Active commuting to school and cognitive performance in adolescents: the AVENA study. Arch Pediatr Adolesc Med. 2011; 165(4): 300-305.
21. Centers for Disease Control and Prevention. Barriers to children walking and biking to school—United States, 1999. MMWR Morb Mortal Wkly Rep. 2002; 51(32): 701–704.
22. Dupont G, Defontaine M, Bosquet L, Blondel N, Moalla W, Berthoin, S. Yo-Yo intermittent recovery test versus the Université de Montréal Track Test: Relation with a high-intensity intermittent exercise. J Sci Med Sport. 2010; 13(1): 146–150.
23. Edwards B, Waterhouse J. Effects of one night of partial sleep deprivation upon diurnal rhythms of accuracy and consistency in throwing darts. Chronobiol Int, 2009; 26(4): 756–768.
25. Krustrup P, Mohr M, Amstrup T, Rysgaard T, Johansen J, Steensberg A, et al. The Yo–Yo Intermittent Recovery Test: Physiological response, reliability and validity. Med Sci Sport Exer. 2003; 35(4): 697-705. 26. Bangsbo J, Laia FM, Krustrup P. The Yo-Yo Intermittent Recovery
Test. A Useful Tool for Evaluation of Physical Performance in Intermittent Sports. Sports Med. 2008; 38(1): 37-51.
27. Gauthier L, Dehaut F, Joanette Y. The bells test: a quantitative and qualitative test for visual neglect. Int J Clin Neuropsychol. 1989; 11(2): 49-54.
28. Corrigan JD, Hinkeldey MS. Relationships between parts A and B of the trail making test. J Clin Psychol. 1987; 43(4): 402-409. 29. Strauss E, Sherman EM, Spreen O. A compendium of
neuropsy-chological tests: administration, norms, and commentary. 3rd Ed.
New York, NY: Oxford University Press, 2006.
30. Dobbs BM, Shergill SS. How effective is the trail making test (Parts A and B) in identifying cognitively impaired drivers? Age Ageing. 2013; 42(5): 577–581.
31. Chillon P, Ortega FB, Ruiz JR, Veidebaum T, Oja L, Mäestu J, et al. Active commuting to school in children and adolescents: an opportunity to increase physical activity and fitness. Scand J Public Health. 2010; 38(8): 873-879.
32. Tomporowski PD, Audiffren M. Dual-task performance in young and older adults: speed-accuracy radeoffs in choice responding while treadmill walking. Journal of aging And physical activity. 2014; 22(4): 557-63.
33. Kline JE, Poggensee K, Ferris DP. Your brain on speed: cognitive performance of a spatial working memory task is not affected by walking speed. Front Hum Neurosci. 2014; 8(8): 1-16.
34. Kamijo K, Takeda Y. Regular physical activity improves executive function duringtask switching in young adults. Int J Psychophysiol. 2010; 75(3): 304-311.
35. Padilla C, Perez L, Andres P, Parmentier FBR. Exercise improves cognitive control: evidence from the stop signal task. Appl Cogn Psychol. 2013; 27(4): 505-511.
36. Pérez L, Padilla C, Parmentier FBR, Andrés P. The effects of chronic exercise on attentional networks. PLoS ONE. 2014; 9(7): e101478. https://doi.org/10.1371/journal.pone.0101478
37. Woo E, Sharps MJ. Cognitive aging and physical exercise. Educ Gerontol. 2003; 29(4): 327-337.
38. Keeley TJ, Fox KR. The impact of physical activity and fitness on academic achievement and cognitive performance in children. Int Rev Sport Exerc Psychol. 2009; 2(2): 198-214.
39. Winneke AH, Godde B, Reuter EM, Vieluf S, Voelcker-Rehage C. The association between physical activity and attentional control in younger and older middle-aged adults: an ERP study. GeroPsych. 2012; 25(4): 207–221.
40. Best JR. Effects of physical activity on children’s executive func -tion: contributions of experimental research on aerobic exercise. Dev Rev. 2010; 30(4): 331-351.
41. Roebers CM, Röthlisberger M, Neuenschwander R, Cimeli P, Michel E, Jäger K. The relation between cognitive and motor performance and their relevance for children’s transition to school: a latent variable approach. Hum Mov Sci. 2014; 33: 212-219.
42. Erickson KI, Kramer AF. Be smart, exercise your heart: exercise effects on brain and cognition. Nat Rev Neurosci. 2008; 9(1): 58-65. 43. Vicente-Campos D, Mora J, Castro-Pinero J, Gonzalez-Montesinos
JL, Conde-Caveda J, Chicharro JL. Impact of a physical activity
program on cerebral vasoreactivity in sedentary elderly people. J Sports Med Phys Fitness. 2012; 52(5): 537-544.
44. Vivar C, Potter MC, van Praag H. All about running: synaptic plasticity, growth factors and adult hippocampal neurogenesis. Curr Top Behav Neurosci. 2013; 15: 189-210.
45. Khan NA, Hillman CH. The Relation of Childhood Physical Activity and Aerobic Fitness to Brain Function and Cognition: A Review. Pediatr Exerc Sci. 2014; 26(2): 138-146.
46. Donnelly JE, Hillman CH, Castelli D, Etnier JL, Lee S, Tomporowski P, et al. Physical Activity, Fitness, Cognitive Function, and Academic Achievement in Children: A Systematic Review. Med Sci Sports Exerc. 2016; 48(6): 1197-1222.
47. Murray NP, Russoniell C. Acute Physical Activity on Cognitive Function: A Heart Rate Variability Examination. Appl Psychophysiol Biofeedback. 2012 ; 37(4): 219-27.
48. Edwards B, Waterhouse J, Atkinson G, Reilly T. Effects of time of day and distance upon accuracy and consistency of throwing darts. J Sports Sci. 2007; 25(13): 1531-1538.
49. Roebers CM, Kauer M. Motor and cognitive control in a normative sample of 7-year-olds. DEVELOPMENTAL SCI. 2009; 12(1): 175-181.
50. Atkinson G, Reilly T. Circadian variation in sports performance. Sports Med. 1996; 21(4): 292–312.
51. Etnyre BR. Accuracy characteristics of throwing as a result of maximum force effort. Percept Mot Skills. 1998; 86: 1211-1217. 52. Edwards B, Lindsay K, Waterhouse J. Effect of time of day on the
accuracy and consistency of the badminton serve. Ergonomics. 2005; 48(11-14): 1488-98.
53. Cauraugh J, Gabert T, White J. Tennis serving velocity and accuracy. Percept Mot Skills. 1990; 70(3): 719-722.
54. Frömer R, Hafner V, Sommer W. Aiming for the bull’s eye: Preparing for throwing investigated with event-related brain potentials. Psychophysiology. 2012; 49(3): 335-344.
55. Delignières D, Brisswalter J, Legros P. Influence of physical exercise on choice reaction time in sport experts: the mediating role of resource allocation. J Hum Movement Stud. 1994; 27(4): 173–188.
56. Elghoul Y, Frikha M, Abdelmlak S, Chtourou H, Dammak K, Chamari K, et al. Time of-day effect on dart-throwing performance and the perception of the difficulty of the task in 9–10 year-old boys. Biol Rhythm Res. 2014; 45(4): 523-532.
Corresponding author
Elghoul Yousri
Mharza Road km1.5; 208, n10; Sfax 3003, Tunisia. E-mail: [email protected]
Manuscript received on April 19, 2018 Manuscript accepted on July 16, 2018