Y-chromosome Lineages from Portugal, Madeira
and A¸cores Record Elements of Sephardim
and Berber Ancestry
Rita Gonc¸alves1, Ana Freitas1, Marta Branco1, Alexandra Rosa1,4, Ana T. Fernandes1,
Lev A. Zhivotovsky2, Peter A. Underhill3, Toomas Kivisild4and Ant ´onio Brehm1,∗
1Human Genetics Laboratory, University of Madeira, Campus of Penteada, 9000-390 Funchal, Portugal 2Vavilov Institute of General Genetics, Russian Academy of Science, 3 Gubkin St., Moscow 119991, Russia 3Department of Genetics, Stanford University, Stanford, California 94305-5120
4Department of Evolutionary Biology - Estonian Biocentre,Tartu University, Riia 23-51010 Tartu, Estonia
Summary
A total of 553 Y-chromosomes were analyzed from mainland Portugal and the North Atlantic Archipelagos of Ac¸ores and Madeira, in order to characterize the genetic composition of their male gene pool. A large majority (78–83% of each population) of the male lineages could be classified as belonging to three basic Y chromosomal haplogroups, R1b, J, and E3b. While R1b, accounting for more than half of the lineages in any of the Portuguese sub-populations, is a characteristic marker of many different West European sub-populations, haplogroups J and E3b consist of lineages that are typical of the circum-Mediterranean region or even East Africa. The highly diverse haplogroup E3b in Portuguese likely combines sub-clades of distinct origins. The present composition of the Y chromosomes in Portugal in this haplogroup likely reflects a pre-Arab component shared with North African populations or testifies, at least in part, to the influence of Sephardic Jews. In contrast to the marginally low sub-Saharan African Y chromosome component in Portuguese, such lineages have been detected at a moderately high frequency in our previous survey of mtDNA from the same samples, indicating the presence of sex-related gene flow, most likely mediated by the Atlantic slave trade.
Keywords: Portuguese, Y-chromosome, SNP, STR
Introduction
For centuries the Iberian Peninsula was a melting pot for various populations of different origins, includ-ing Celts, Germanics or Scandinavians (Swabians and Visigoths), Phoenicians, contributions from a myriad of east Mediterranean peoples, and finally Moors and Arabs (Amaral & Amaral, 1997; Oliveira Martins, 1994). Apart from these populations, there is also a well-documented input of sub-Saharan slaves into Portugal during the
∗
Corresponding author: Ant ´onio Brehm, Phone
+351291705383, Fax +351291705393. E-mail: brehm@
uma.pt
15th–16thcenturies. From all these peoples, three groups
have been the focus for vigorous debate over their con-tribution to the present day Portuguese genetic gene pool: the Sephardim Jews, the Arab-Berbers and the sub-Saharans. Jews are known to have inhabited the
Iberian Peninsula since at least the 3rd century AD
(Tavares, 2000). Their arrival was probably the result of migrations via North Africa, where Jewish commu-nities were already well established. During the Visigoth and Muslim periods Jews reinforced their position and flourished in the peninsular society. Expelled from Spain
and Portugal in the 15th century, the Sephardim Jews
(from “Sepharad” meaning Spain or “Espaniah”) went back to North Africa or migrated, mainly to Amsterdam
and Constantinople (Kayserling, 1971). However, many are supposed to have remained in Portugal under forced conversion to Catholicism, becoming known as “new-Christians” (Borges, 1998; Guerra, 2003).
Moors, or Berbers from Mauritania, started to expand into Iberia in 711 AD. However, it is generally assumed that their presence in the north of Portugal was mini-mal and short-lived. On the contrary, it is known that Arabs from Egypt and Yemen settled down in villages of southern Portugal (Lopes, 1928). Arab rule in Iberia ended in 1492 with the fall of Granada.
Although some sub-Saharans entered the Iberian Peninsula with the Berbers and Arabs, most of this
com-ponent in Portugal dates back to the 15thcentury when
the importation of sub-Saharan slaves accelerated, fol-lowing the establishment of a commercial Atlantic net-work. At the height of the slave trade, 10% of the pop-ulation in the south of the country, and particularly in Lisbon, was composed of sub-Saharan slaves (Godinho, 1965).
The Atlantic Archipelagos of Ac¸ores and Madeira were discovered and settled by the Portuguese in the first
half of the 15thcentury and both archipelagos played a
major role in the complex Atlantic trade network in the following centuries. The Ac¸ores also received a signifi-cant portion of male settlers from Flandria who married Portuguese women (Frutuoso, 1977). In Madeira, the non-Iberians were mainly from Italy and because of the heavy involvement with the Atlantic slave trade, espe-cially after the discovery and settlement of Cabo Verde islands, the island also saw a considerable input of sub-Saharan slaves. In fact, it is known that the proportion of imported slaves in Madeira reached 10% of the total
population by the 16thcentury. Inter-island movements
have also been recorded, and it is known that many set-tlers of the Ac¸ores came from Madeira.
Mitochondrial and autosomal polymorphisms have been used to study the genetic composition of present day populations from Portugal, Madeira and the Ac¸ores (Pereira et al. 2000a; Sp´ınola et al. 2002; Brehm et
al. 2003; Fernandes et al. 2003; Gonzalez et al. 2003).
MtDNA markers in particular showed that the Por-tuguese are characterized by a strong spatial hetero-geneity in their mtDNA distribution. This prompted us to look for the genetic imprint left in today’s pop-ulations by the male settlers, both in mainland
Portu-gal and the Atlantic Islands of Madeira and the Ac¸ores. Using Y-chromosome biallelic markers and microsatel-lites, we aimed to characterize the extant paternal lin-eages to investigate if (1) genetic markers possibly trans-mitted by Sephardim Jews are detectable in today’s gene pool, (2) whether there is a parallel with the strong imprint of sub-Saharan maternal markers found in Portugal and Madeira and (3) to what extent North African or Berber lineages are associated with the Mus-lim period. Moreover, the recently proposed phyloge-netic characterization of Y-chromosome haplogroups E and J, regarding their possible origin and spread around the Mediterranean area (Cinnio˘gulu et al. 2004; Cruciani et al. 2004; Luis et al. 2004; Semino et al. 2004), renders possible the inference of potential sources of these lineages in the extant genetic pool of Portuguese males.
Materials and Methods
Population Samples
The populations included in this study consisted of 553 unrelated males from mainland Portugal and the North Atlantic archipelagos of Madeira and Ac¸ores. We fur-ther subdivided mainland Portugal into three regions: North, Central and South. Blood samples were collected with informed consent from volunteer males that could unambiguously certify that all relatives back to three generations were from the same island or mainland re-gion (see Gonzalez et al. 2003). For comparisons of the Y-chromosome profiles prevailing in these regions we used published data on Europeans (Hammer et al. 2000; Underhill et al. 2000; Semino et al. 2000, 2004; Nebel
et al. 2001; Capelli et al. 2003; Cruciani et al. 2004;
DiGiacomo et al. 2004), North Africans (Bosch et al. 2001; Arredi et al. 2004; DiGiacomo et al. 2004; Luis
et al. 2004), Middle Eastern (Nebel et al. 2000;
Un-derhill et al. 2000; Semino et al. 2002; Cinnio˘gulu et al. 2004; Cruciani et al. 2004; DiGiacomo et al. 2004) and sub-Saharan African populations (Semino et al. 2002; Gonc¸alves et al. 2003).
DNA Extraction and Y-chromosome typing
Genomic DNA was isolated by standard protocols and the STSs containing Y-SNPs were amplified with primers described in Underhill et al. (2000, 2001)
MA AC NP CP SP Total n diversityGene 129 121 101 102 100 553 .696 (.004) .647 (.004) .688 (.004) .611 (.005) .698 (.004) 1 1 1 3 1 1 2 3 1 1 5 1 1 2 5 1 8 7 6 1 26 4 8 7 5 6 30 6 6 2 4 4 1 2 1 1 2 4 8 7 34 10 5 9 5 7 36 8 7 1 5 7 1 3 1 8 3 6 33 12 4 4 6 2 2 2 3 3 1 1 2 1 7 2 2 3 2 2 7 68 62 52 304 69 53 2 2 F* G I J* J2 K2 L N3 Q R1* R1aR1b3 R1b3f M89 M201 M170 M304 M9 M172 M70 M61 LLy22g Tat M45 P36 M207 M173 SRY 1532 P25 SRY2627 M269 A M91
C E1 E3aE3b* E3b1 E3b2 E3b3
M1 M96 M33 P2 M2 M35 M78 M81 M168 M94 M216 M123 E3b3a M34 M267 J1 M67 J2f 5 16 6 5 15 1 3
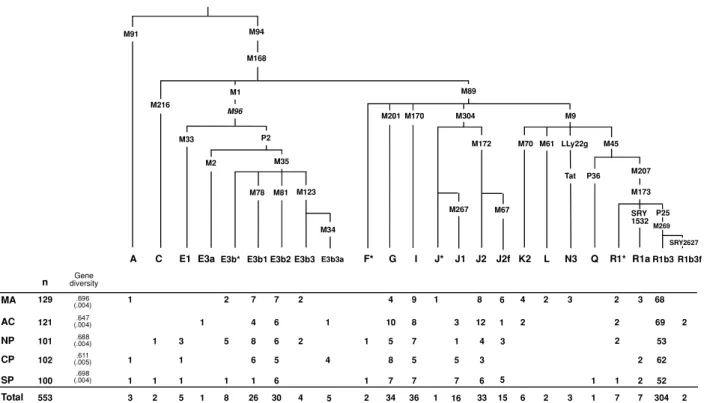
Figure 1 Phylogenetic tree of the Y-chromosome haplotypes. Haplogroup defining mutations assayed in this study are shown along branches. Population codes are as follows: Madeira-MA, Ac¸ores-AC, North Portugal-NP, Centre Portugal-CP, and South Portugal-SP. and Cinnio˘gulu et al. (2004). Genotyping was done
using both native and engineered RFLP methods. The selected SNPs that were analyzed are shown in Figure 1 in their phylogenetic order defining the haplogroup sta-tus of each Y-chromosome. The following binary mark-ers were assayed but derived alleles not observed: M31, M32, M75, M52, M62, M147, SRY9138, P35, M175 and M124. Six STR loci (DYS19, DYS388, DYS390, DYS391, DYS392 and DYS393) were assayed in chro-mosomes belonging to haplogroups E3b and J1 using standard methodology (Thomas et al. 1999). DYS439 and A7.1 were also tested to further define E3b1 sub-clusters (Cruciani et al. 2004), and DYS439 for J1 lin-eages (Table 1).
Analysis of Y chromosomal haplogroups and STR based haplotypes
In this study we follow the haplogroup nomenclature proposed by the Y Chromosome Consortium (2002) for Y chromosome typing. Frequencies of Y haplogroups for each region and gene diversity measures were ob-tained using Arlequin v2.000 (Schneider et al. 2002). These frequencies were used for comparisons with other populations and employed in an analysis of molecular
variance (AMOVA) using Euclidean distances between all pairs of haplotypes (Excoffier et al. 1992). The total genetic variation between the populations was parti-tioned into hierarchical levels of grouping, and variance components were tested for significance by nonpara-metric randomization tests using 10000 permutations. We performed a principal component analysis (PCA) of Y haplogroup frequencies for Madeira, the Ac¸ores, and the Portuguese mainland populations, and published data sets typed with the same phylogenetic resolution: a population from North Africa (Bosch et al. 2001), Euro-peans (Capelli et al. 2003), Mediterranean and Middle-Eastern Sephardim Jews (Nebel et al. 2001) and Middle Eastern non-Jews (Hammer et al. 2000). To standardize the latter data sets to the level of phylogenetic resolu-tion used in our study we deduced the proporresolu-tion of J1 versus J2 (which appeared under the haplogroup desig-nation “Med”) using an estimate based on the frequen-cies proposed by Nebel et al. (2001). In this analysis we included one Jewish population of Nebel et al. (2001): the “Sephardic” Jews reported from the Mediterranean area and the Middle East. Superimposed on the PCA, we calculated a minimum-length spanning tree (MST) in order to detect possible distortions suggested by the
Ta ble 1 Y chr omosome haplotypes in fiv e P or tuguese populations of haplo g roups E1, E3b and J ∗defined b y 12 STR loci. P opulation codes ar e accor ding to Figur e 1 Allele Status P opulations Hg D YS19 D YS388 D YS390 D YS391 D YS392 D YS393 GA T A7.1 D YS439 D YS389I D YS437 D YS438 A C MA NP CP SP H1 E1 14 24 11 13 13 12 12 14 12 1 H2 E1 14 24 12 14 13 12 12 14 12 1 H3 E1 15 21 10 11 13 12 13 14 11 1 H4 E1 14 23 11 13 13 12 13 15 12 1 H5 E1 15 21 11 11 14 11 14 14 11 1 H6 E3b ∗ 13 12 23 9 1 1 1 3 2 H7 E3b ∗ 13 12 24 9 1 1 1 3 3 H8 E3b ∗ 13 12 24 10 11 12 1 H9 E3b ∗ 13 12 24 10 11 13 11 H10 E3b1 13 12 23 10 11 13 9 1 1 H11 E3b1 13 12 23 10 11 13 11 12 1 H12 E3b1 13 12 23 11 11 13 9 1 H13 E3b1 13 12 23 11 11 14 11 12 1 H14 E3b1 13 12 23 9 1 1 1 3 1 0 1 2 1 H15 E3b1 13 12 24 9 1 1 1 3 9 1 H16 E3b1 13 12 24 10 11 13 9 1 1 1 2 H17 E3b1 13 12 24 10 11 13 10 12 1 1 H18 E3b1 13 12 24 11 11 14 10 12 2 H19 E3b1 13 12 25 10 11 13 9 1 1 H20 E3b1 13 12 25 11 11 13 10 11 1 H21 E3b1 13 13 23 10 11 13 10 10 1 H22 E3b1 13 13 24 10 11 13 9 2 H23 E3b1 13 13 25 10 11 13 9 1 H24 E3b1 14 12 24 10 11 12 11 11 1 H25 E3b1 14 12 25 10 11 13 11 11 1 H26 E3b1 14 12 25 10 11 13 10 12 1 H27 E3b2 13 12 23 9 1 1 1 3 1 1 1 H28 E3b2 13 12 24 9 1 1 1 2 1 H29 E3b2 13 12 24 9 1 1 1 3 2 3 4 3 1 H30 E3b2 13 12 24 9 1 1 1 4 1 1 H31 E3b2 13 12 24 10 11 13 2 H32 E3b2 13 12 24 11 11 13 1 H33 E3b2 13 12 24 11 11 14 1 H34 E3b2 13 12 25 11 11 13 1 H35 E3b2 13 13 23 9 1 1 1 3 1 H36 E3b2 13 13 24 9 1 1 1 3 1 1 H37 E3b2 14 12 22 9 1 1 1 2 1
Ta ble 1 Contin ued Allele Status P opulations Hg D YS19 D YS388 D YS390 D YS391 D YS392 D YS393 GA T A7.1 D YS439 D YS389I D YS437 D YS438 A C MA NP CP SP H38 E3b2 14 12 23 9 1 1 1 3 1 H39 E3b2 14 12 24 11 11 12 1 H40 E3b3 13 12 23 10 11 12 1 H41 E3b3 13 12 24 9 1 1 1 3 2 H39 E3b3 13 12 24 10 11 12 1 H40 E3b3 13 12 24 10 11 13 1 H41 E3b3 13 12 24 10 11 14 1 H42 E3b3 14 12 23 10 11 13 1 H43 E3b3 15 12 24 10 11 12 1 1 H44 J1 13 16 23 10 11 12 11 1 H45 J1 13 16 24 10 11 12 12 1 H46 J1 14 15 23 10 11 12 9 1 H47 J1 14 16 22 10 11 12 12 1 H48 J1 14 16 23 10 11 12 11 2 1 H49 J1 14 16 24 10 11 12 11 1 H50 J1 14 16 25 10 11 12 11 1 H51 J ∗ 15 15 24 10 11 12 10 1 H52 J1 15 16 22 10 11 13 11 1 2 H53 J1 15 16 23 10 11 12 11 2 H54 J1 15 16 24 10 13 13 12 1 H55 J1 16 16 24 10 13 13 11 1
plot (Rohlf, 1973). PCAs for the E and J haplogroups were done with the data from Semino et al. (2004) and Cruciani et al. (2004). All the analysis was done using NTSYSpc 2.02h package.
The age of STR variation within each haplogroup was estimated as the average squared difference in the number of repeats between all current chromosomes (pooled together from all samples) and the founder (as-sumed to be modal) haplotype, divided by w = 6.9 x 10– 4 per 25 years (Zhivotovsky et al. 2004). We computed upper and lower bounds for expansion time (the time of divergence of populations). The upper bounds were
calculated using TD (Zhivotovsky, 2001) and assuming
an STR-variance in repeat scores at the beginning of the population split (V0) equal to zero. The lower bounds
were calculated as TD, with V0 taken as a predicted
value of the within-population STR-variance prior to the population split; the latter was computed as a lin-ear approximation of the within-population variance in repeat scores as a function of time (L. A. Zhivotovsky, unpublished method). The minimum sample size for age calculations was 5 individuals.
Results and Discussion
Haplogroup R1b (particularly R1b3) was found to be the most dominant Y chromosomal lineage in Portugal and the North Atlantic Archipelagos of the Ac¸ores and Madeira, covering more than half of the Y chromosomal lineages in each population. The high frequency of this haplogroup is typical in all West European populations, reflecting a cline (Rosser et al. 2000) and likely continu-ity of the Paleolithic gene pool in Europe (Semino et al. 2000). Haplogroups I and G, also characteristic mark-ers for many different West European populations, were found in all the populations in this study at an average frequency above 5%. Together with R1b, haplogroups J and E3b comprise 78–83% of the Y-chromosomal gene pool of each sampled population. Haplogroups J and E3b consist of lineages with differential distribution within Middle East, North Africa and Europe.
The sub-Saharan component
Typically sub-Saharan lineages are represented by hap-logroups A and B, which are also the basal clades in the human Y-chromosomal tree of humans. E1-M33 has
a rather limited distribution in the West sub-Saharan region, reaching its highest frequency in Mali (34%, Underhill et al. 2000) and north Cameroon (especially among the Fulbe and Tali groups, Cruciani et al. 2002). This haplogroup is virtually absent in European popu-lations (Semino et al. 2004) and Northwest Africa, al-though it is found among Berbers (1.6–3.2%, Bosch
et al. 2001). Haplogroup E3a is especially common in
Sub-Saharan West Africa (Underhill et al. 2000, 2001; Semino et al. 2002), has been associated with the dis-persal of Bantu people (Underhill et al. 2001, 2001) and
reaches ∼80% in Senegal (Semino et al. 2002). The
combined frequency of all these haplogroups in
Por-tugal is marginally low (∼0.7%), so it is highly unlikely
it is a result of accidental sampling of African immi-grants. Haplogroup E3a is notably absent from our sam-ple except for a single E3a individual in the Ac¸ores, although this haplogroup constitutes the majority of
Y-chromosomes in Guinea (>70%, Rosa et al.
unpub-lished data) and Cabo Verde (16%, Gonc¸alves et al. 2003), the putative regions of origin for the first slaves brought to Portugal. These results sharply contrast with those obtained with mtDNA markers. mtDNA hap-logroups L0–L3 and M1 that are characteristic to
sub-Saharan populations are present at∼12% and ∼14.8%
in the south of Portugal and Madeira, respectively (Brehm et al. 2003; Gonzalez et al. 2003). This con-trasting pattern of paternally and maternally inherited markers closely follows the situation in the Canary Is-lands where E3a is residual (0.9%, Flores et al. 2003). These Y-chromosome haplogroups have escaped detec-tion in other populadetec-tions of Iberia (Semino et al. 2000, 2004; Bosch et al. 2001), in spite of the fact that the peninsula was a recipient for sub-Saharan slaves from
the 15th century onwards. These results are consistent
with sex specific gene flow, probably resulting from the custom that male slaves did not mate with Iberian women while the opposite situation was common, as supported by mtDNA analysis (Brehm et al. 2003; Gon-zalez et al. 2003). Three lineages belonging to
hap-logroup A (Y(×M94)) were found. The presence in
Portugal of both the A and E1 haplogroups may be in-dependent from the slave trade (otherwise E3a would be well represented since it comprises the majority of West Africa lineages). These findings either suggest a pre-Neolithic migration from North Africa or a more
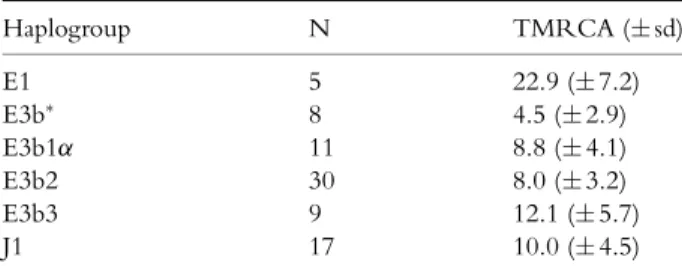
Table 2 Haplogroup age estimates based on STR-variation (in ky) and expansion time of population divergence (in ky, in brack-ets) within haplogroups are shown. Population codes are as in Figure 1. TMRCA for all haplogroups except E1 was determined on the basis of 6 STR profiles (DYS19, 388, 390, 391, 392 and 393, see Table 1). E1 was calculated on the basis of 9 STRs (DYS19, 390, 391, 392, 393, 389I, 437, 438 and 439)
Haplogroup N TMRCA (±sd) E1 5 22.9 (±7.2) E3b∗ 8 4.5 (±2.9) E3b1α 11 8.8 (±4.1) E3b2 30 8.0 (±3.2) E3b3 9 12.1 (±5.7) J1 17 10.0 (±4.5)
recent origin from a founder population of small size that did not carry haplogroup E3a, which is a major com-ponent in North African populations today. TMRCA
for Portuguese E1 lineages estimated as 22.9± 7.2 ky
(Table 2) favours the first scenario, a possible parallel to mtDNA U6 cited in Gonzalez et al. (2003).
Haplogroup E3b
Haplogroup E3b (characterized by mutation M35) is widespread in Northwest Africa, East Africa, the Middle-East (Bosch et al. 2000; Semino et al. 2002; Un-derhill et al. 2000; Cruciani et al. 2004) and is also com-mon in Europe, albeit at variable frequencies (Semino
et al. 2000). Eastern Africa is seen as the homeland for
E3b as there it has the highest number of different clades and microsatellite diversity and the almost
exclu-sive presence of E3b∗, with estimates of∼30 ky for the
age of the M35 mutation (Bosch et al. 2001; Cruciani
et al. 2004). The frequency of E3b∗ varies from ∼3–
8% in Morocco (Bosch et al. 2001; Cruciani et al. 2002; Semino et al. 2004) and reaches its highest frequency in Ethiopian Oromo (19.2%, Cruciani et al. 2002; Semino
et al. 2002). The clustering of E3b∗ lineages in North
Portugal (with 3.8± 2.2 kya) and low Y-STR variation
(compared to North Africa) is a putative indication of a restricted but definite gene flow across the Strait of Gibraltar.
Haplogroup E3b1 has a significantly uneven distri-bution in mainland Portugal, occurring at 8–6% in Northern and Central Portugal versus only 1% in the
South (x2, P < 0.01). Regional sub-clustering of the
STR haplotypes on the background of Portuguese
E3b1-M78 suggests that these lineages could have spread from the Balkans all over Europe during the Neolithic
(E-M78α in Cruciani et al. 2004). This is furthermore
supported by the age of STR variation (8.8± 4.1 ky,
Fig. 2) and fits into the 6.3–9.2 ky range suggested by Cruciani et al. (2004). The pairwise divergence times between Madeira, North and Central of Portugal differ insignificantly from each other, being on average around 6 thousand years (Table 2). The timescale for the arrival of E3b1-M78 is coincident with that pointed out by Flores et al. (2003). Defined on the basis of GATA A7.1
allele 9, E-M78α follows the same pattern of
north-central prevalence (3% vs 1% in the south). An in-creased frequency of 4.6% was detected in Madeira. This may correlate with the contribution of Italians
to the archipelago, as this cluster is present in ∼7%
in their homeland (Cruciani et al. 2004). Based on the same resolution level we detected one individual in the North of Portugal having the GATA A7.1 indicated by Cruciani et al. (2004) as the North African E3b1ß. All the remaining E3b1 cannot be associated to any pro-posed geographical origin on the basis of the additional STRs.
In Northwest Africa ∼75% of the Y lineages are
haplogroup E3b2-M81 (Bosch et al. 2001) although a much lower frequency of this clade is seen among the Arabs (32,6 % in Cruciani et al. 2002; 52,3 % in Bosch et al. 2001). E3b2-M81 in North Africa may have arisen near Egypt or Somalia and then spread west-wards along the upper boundary of Africa (Sanchez
et al. 2003; Arredi et al. 2004; Cruciani et al. 2004;
Luis et al. 2004). This particular haplogroup has been observed at variable frequencies in Iberian popula-tions (1–12%) and is almost absent, or occurs at very
low frequencies (<6%), elsewhere in Western Europe
(Underhill et al. 2000; Bosch et al. 2001; Cruciani et al. 2004; Semino et al. 2004). Surprisingly, an uniform fre-quency of 5–6% E3b2 was observed in Madeira, the Acores and in all Portuguese sub-populations (Figure 1), in contrast to an earlier observation of 12% in a smaller sample from Southern Portugal (Cruciani et al. 2004). Half of the Portuguese E3b2 haplotypes are shared with Berber and/or Arab speaking populations from Mo-rocco (Quintana-Murci et al. 2004), and the age STR variation at E3b2 in the Portuguese populations is
1 -11.36 -5.36 0.65 6.65 12.65 2 -9.91 -5.63 -1.36 2.92 7.19 MA AC NP CP SP NA ME NO GD BI SJ EG
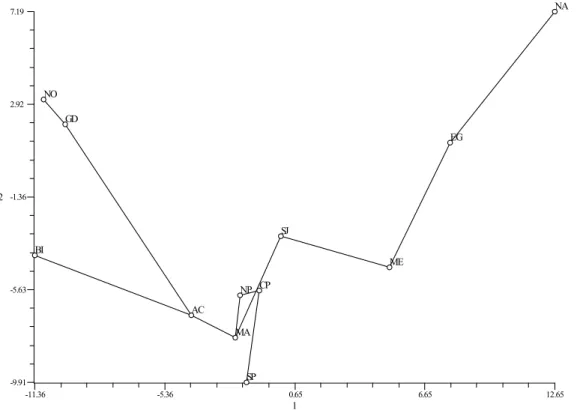
Figure 2 Principal Component Analysis based on Y-chromosome haplogroups frequencies. Axis 1 and 2 extracted 37.3% and 23% of the total variation (a third axis accounts for 17%, not shown). The MST superimposed on the ordination of populations is also shown and reveals the most likely connections between populations. Populations are as follows: MA-Madeira, AC-Ac¸ores, SP-South Portugal, CP-Centre Portugal, NP-North Portugal, ME-Middle East, BI-British Isl., GD-Germany/Denmark, NO-Norway, SJ-Sephardim Jews, EG-Egyptians and NA-North Africa.
8.6 ± 2.3 ky) (Table 2, Semino et al. 2004). All these
findings suggest a flow of Berber-related lineages into the male Portuguese population. The lack of differen-tiation between Europe and Africa in relation to this haplogroup, as reported by Cruciani et al. (2004), makes it more plausible that extant lineages in the Portuguese most likely reflect the signature of a northwestern North African gene flow. Cruciani et al. (2004) explain the differences between Iberians and the remaining Euro-peans by an African contribution, probably resulting from Islamic influence and/or drift/founder effects. It is highly probable that the Berber dispersion in Portugal was population-structured: the average time of pairwise population divergence, more than 4 thousand years (Ta-ble 2), well predates the Arab settlement. Central and North Portugal show a lower divergence time for E3b2-STR variation (800 to 2,200 years ago); these two re-gions might have diverged from the same North-West African populations.
E3b3 has a clear affiliation with Mid-Eastern popu-lations but is infrequent in Europe and North Africa (Cruciani et al. 2004; Semino et al. 2004). This hap-logroup shows a considerable Y-STR variation in Turkey (Cinnio˘glu et al. 2004) and Egypt (Luis et al. 2004), and again its presence in Portugal points to a Middle Eastern influence, most likely via North Africa.
Haplogroup J
More than 10% of Portuguese Y chromosomes could be classified in haplogroup J. The frequency of this hap-logroup in Portugal is significantly higher than among
the Spanish (p< 0.001) or other West European
pop-ulations (Rosser et al. 2000), with the exception of Italy as reported by Semino et al. (2004) and DiGia-como et al. (2004). Haplogroup J is thought to have originated in the Middle East or North East Africa
(Hammer et al. 2000; Malaspina et al. 2001; Cin-nio˘glu et al. 2004; Semino et al. 2004) both main J1 and J2 clusters appearing in the Levant at Neolithic times (DiGiacomo et al. 2004). Notably,
the collection of J∗ lineages characterized as not
bearing the mutation at M172 apportion to the J1-M267 sister clade (Cinnio˘glu et al. 2004), and appear to have spread into North Africa from Arabia (Nebel et al. 2002;
Semino et al. 2004). Haplogroup J∗ (= J1-M267)
lin-eages occur in both Jewish and other Semitic speaking non-Jewish populations in the Middle East (Nebel et al. 2001; Semino et al. 2004) and notably also in the Arabs of Oman (Luis et al. 2004). J1 is also present in Mediter-ranean Europe, especially Italy (3.9%, DiGiacomo et al. 2004), although with a more reduced diversity than in the Middle East. The high frequency of this haplogroup among Turkish Jews and non-Jews (Hammer et al. 2000; Nebel et al. 2001; Behar et al. 2004) may be a signa-ture of influence from the Middle East. As for the pro-posed Neolithic diffusion hypothesis, it is important to note that haplogroup J1 is weakly represented in the Balkans. A maritime dispersal, probably associated with Greeks or Phoenicians, should alternatively be postu-lated if one considers its higher frequency along south Mediterranean coastal areas (DiGiacomo et al. 2004). The history of Jewish settlement in Iberia makes it plau-sible that one source of the haplogroup J1 in Portugal (which reaches 7% in the South) could be related to either Jewish or Arabian ancestry. Non-Jewish North Africans are also characterized by over 10% of J1-M267 (Semino et al. 2004) The Portuguese J1 microsatellite combined haplotypes (Table1) include an exact match at six STR loci to the Cohen Modal Haplotype (CMH, Thomas et al. 1998), and do not match the Arab modal haplotypes described by Nebel et al. (2002). This sup-ports the view that Portuguese J1 lineages are not due to Arab gene flow, and could have entered the country independently. DiGiacomo et al. (2004) indicate a pu-tative ancestral Y-STR haplotype for J1 in Europe that is also the most representative in the Middle East, and includes the CMH. In our sample we found 3 exact matches to this Y-STR pattern (2 in the Centre, 1 in the South) and four one-step matches again in Cen-tral and South Portugal. The allelic state of 3 YSTR loci (DYS388, DYS391 & DYS439 respectively) pro-vides a metric to distinguish the CMH (16, 10, 12)
and Arab (17, 11, 11) J1 lineages (Nebel et al. 2002; Arredi et al. 2004). We observed 3 individuals display-ing a similar motif to the CMH haplotype, but for the remaining ones it is not possible to assign any association with the Arab motif, further supporting our hypothesis of a loose connection to Arabs. Alternatively, an ear-lier but unrecorded gene flow from North Africa, or by sea from the Middle East, could be considered as likely. J1 presents a heterogeneous distribution since its frequency is higher in the South and Centre than in the
North of Portugal (x2, P < 0.01). Jews are supposed
to have arrived in Iberia at least in the 3rd century via
North Africa (Tavares, 2000). Bring longer ago than the possible arrival time of the Jewish lineages, the di-vergence time of J1 in Central and South Portuguese populations (between 4.8 ky and 11.1 ky, Table 2) sug-gests that they were imported from distinct founding populations or even through different waves from differ-ent Middle-Eastern populations that had diverged much earlier elsewhere. J2 has a higher representation than its sister clade in Madeira, the Ac¸ores and South Portu-gal. Turkey and the Aegean areas are supposed to have acted as a secondary source for this originally Middle-Eastern haplogroup (DiGiacomo et al. 2004), from where it spread to Europe. An association with Greek and/or Phoenician eras should also be considered in Portugal.
Population structure and Principal Component Analysis
An AMOVA between populations pooled by geo-graphic regions (mainland Portugal, the two Archipela-gos of Madeira and Ac¸ores, and data from North Africa
(Bosch et al. 2001)) attributes ∼33% of variance to
differences among groups, but only 1% to differences among populations within each group (overall FST
value of 0.335, P< .0001). Population pairwise
differ-ences were all statistically significant (P< 0.0001).
Ex-cluding North Africans, the variance attributed to dif-ferences among insular and mainland populations drops
to only∼2%. This amount of variance is mainly due to
the lack of R1b in North Africa. These results are also evident in the PCA (Figure 2). The Portuguese popula-tions reveal themselves as a highly heterogeneous group, clearly separated from other European populations (GD,
NO and BI, see Figure 2 for population codes) but also from North Africa and Mid-Eastern populations ob-viously denoting an intermediate status. Interestingly, both North Africans and Middle-Easterners join the Portuguese populations through the “Sephardim” Jews as indicated by the MST. The most likely lineage groups responsible for differences on the axis distinguish-ing European-Iberian-MidEast populations are E3b (a characteristic of NA) and R1b (typical of West Euro-peans). The latter haplogroup is almost absent in North Africa and Middle East.
Overall, the Portuguese show an affinity to Middle Eastern populations. So far, the degree of genetic con-tribution from peoples of Jewish, North African and sub-Saharan ancestry to the present day Portuguese has been uncertain. Our data suggests only minor influ-ences from sub-Saharan males in Portugal and the At-lantic Islands, despite historical records indicating that slaves constituted at least 10% of the total population
in Madeira and the South of the country in the 15th
century. This contrasts mtDNA and HLA data, but pro-vides genetic support to the view that mixing was highly asymmetrical by sex. The North African component at least for mtDNA, is mainly concentrated in the North of Portugal. The mtDNA and Y data indicate that the Berber presence in that region dates prior to the Moor-ish expansion in 711 AD. Our Y chromosome results are also consistent with a continuous and regular assimila-tion of Berbers in North of Portugal. This argues against previous interpretations of Moorish mediated contribu-tions, based on Y chromosome data (Bosch et al. 2001; Pereira et al. 2000b; Cruciani et al. 2004) and provides an alternative view of an earlier Berber presence in the
North of Portugal. Haplogroup J∗ distribution in
Por-tugal runs opposite to haplogroup E3b2, corroborating the hypothesis that J1 lineages were not introduced with North African E3b2 lineages during the Arab/Berber expansion. In addition, the J1 lineages are distinct from the common Arab haplotype, consistent with an inde-pendent source, possibly Sephardim and/or other Near East peoples. Until now, the only evidence supporting the presence of Berbers in Iberia was the high frequen-cies of haplogroup U6 in Northern Portugal. Our data indicate that male Berbers, unlike sub-Saharan immi-grants, constituted a long-lasting and continuous com-munity in the country.
Note Added in Proof
While under review, two papers appeared on Y-chromosome profiles from the Ac¸ores (Montiel et al. 2005, Pacheco et al 2005). Montiel et al. (2005) found a haplogroup composition similar to ours but they recognize that a lack of information or resolution of haplogroups E and J prevents a better un-derstanding of the putative origin of islanders (North African versus Europeans), which has been resolved in our research.
The second article (Pacheco et al. 2005) does not achieve a reasonable level of Y-chromosome discrimination and presents serious inconsistencies with the most recently updated phy-logeny and nomenclature system of the YCC. There is an obvious mis-assignment of samples under P∗ (most of them are likely R1b3 if M269 had been tested) or K∗. The lack of resolution is most obvious for E3b, which are pooled. A more correct clarification of the differential origin of this group could have be achieved only with the use of Y-STRs, as per-formed in our research.
(references from Annals of Human Genetics, January 2005)
Acknowledgements
We thank Drs. Roy King, Miguel Sequeira and Jos´e Jesus for a critical reading of the manuscript. RG and MB have a re-search contract with the University of Madeira. AF and AR are PHD students from FCT (contracts SFRH/BD/8592/2002 and SFRH/BD/12173/2003).
References
Amaral, J. F. & Amaral, A. F. (1997) Povos antigos de
Portu-galQuetzal (Ed.), Lisbon.
Arredi, B., Poloni, E. S., Paracchini, S., Zerjal, T., Fathallah, D. M., Makrelouf, M., Pascali, V. L., Novelletto, A. & Tyler-Smith, C. (2004) A predominantly neolithic origin for Y-chromosomal DNA variation in North Africa. Am J Hum
Genet 75, 338–45.
Behar, D., Garrigan, D., Kaplan, M., Mobasher, Z., Rosen-garten, D., Karafet, T., Quintana-Murci, L., Ostrer, H., Skorecki, K. & Hammer, M. (2004) Contrasting patterns of Y chromosome variation in Ashkenazi Jewish and host non-Jewish European populations. Hum Genet 114, 354– 365.
Bosch, H., Calafell, F., P´erez-Lezaun, A., Comas, D., Izaabel, H., Akhayat, O., Sefiani, A., Hariti, G., Dugoujon, J. M., Bertranpetit, J. (2000) Y chromosome STR haplotypes in four populations from northwest Africa. Int J Legal Med 114, 36–40.
Bosch, H., Calafell, F., Comas, D., Oefner, P., Underhill, P. & Bertranpetit, J. (2001) High-resolution analysis of human Y-chromosome variation shows a sharp discontinuity and limited gene flow between Northwestern Africa and the Iberian Peninsula. Am J Hum Genet 68, 1019–1029.
Borges, A. B. (1998) Crist˜aos-novos judeus e os novos argona-utas. Col. Questionar a Hist ´oria IV, Caminho (Ed.), Lisboa. Brehm, A., Pereira, L., Bandelt, H.-J., Prata, M. & Amorim, A. (2002) Mitochondrial portrait of the Cabo Verde archipelago: the Senegambian outpost of the Atlantic slave trade. Ann Hum Genet 66, 49–60.
Brehm, A., Pereira, L., Kivisild, T. & Amorim, A. (2003) Mi-tochondrial portraits of the Madeira and Ac¸ores archipela-gos witness different genetic pools of its first settlers. Hum
Genet 114, 77–86.
Capelli, C., Redhead, N., Abernethy, J., Gratix, F., Wilson, J., Moen, T., Hervig, T., Richards, M., Stumpf, M., Un-derhill, P., Bradshaw, P., Shaha, A., Thomas, M., Bradman, N. & Goldstein, D. (2003) A Y chromosome census of the British Isles. Current Biology 13, 979–984.
Cinnio˘gulu, C., King, R., Kivisild, T., Kalfo˘glu, E., Atasoy, S., Cavalleri, G. L., Lillie, A. S., Roseman, C. C., Lin, A. A., Prince, K., Oefner, P. J., Shen, P., Semino, O., Cavalli-Sforza, L. L., Underhill, P. A. (2004) Excavating Y-Chromosome Haplotype Strata in Anatolia. Hum Genet
114, 127–148.
Cruciani, F., Santalomazza, P., Shen, P., Macaulay, V., Moral, P., Olckers, A., Modiano, D., Holmes, S., Destro-Bisol, G., Coia, V., Wallace, D., Oefner, P., Torroni, A., Cavalli-Sforza, L., Scozzari, R. & Underhill, P. (2002) A back mi-gration from Asia to sub-Saharan Africa is supported by high-resolution analysis of human Y-chromosome haplo-types. Am J Hum Genet 70, 1197–1214.
Cruciani, F., La Fratta, R., Santolamazza, P., Daniele Sellito, Pascone, R., Moral, P., Watson, E., Guida, V., Colomb, E. B., Zaharova, B., Lavinha, J., Vona, G., Aman, R., Cal`ı, F., Akar, N., Richards, M., Torroni, A., Novelletto, A. & Scozzari, R. (2004) Phylogeographic analysis of hap-logroups E3b (E-M215) Y chromosomes reveals multiple migratory events within and out of Africa. Am J Hum Genet
74, 1014–22.
Di Giacomo, F., Luca, F., Popa, L. O., Akar, N., Anag-nou, N., Banyko, J., Brdicka, R., Barbujani, G., Papola, F., Ciavarella, G., Cucci, F., Di Stasi, L., Gavrila, L., Kerimova, M. G., Kovatchev, D., Kozlov, A. I., Loutradis, A., Man-darino, V., Mammi, C., Michalodimitrakis, E. N., Paoli, G., Pappa, K. I., Pedicini, G., Terrenato, L., Tofanelli, S., Malaspina, P. & Novelletto, A. (2004) Y chromosomal hap-logroup J as a signature of the post-neolithic colonization of Europe. Hum Genet 115, 357–71.
Excoffier, L., Smouse, P. E. & Quattro, J. M. (1992) Analysis of molecular variance inferred from metric distances among haplotypes: application to human mitochondrial DNA re-striction data. Genetics 131, 479–491.
Fernandes, A., Velosa, R., Jesus, J., Carracedo, A. & Brehm, A. (2003) Genetic differentiation of the Cabo Verde Archipelago population analysed by STR polymorphisms.
Annals Hum Genet 67, 340–347.
Flores, C., Maca-Meyer, N., P´erez, J., Gonz´alez, A., Larruga, J. & Cabrera, V. (2003) A predominant European ancestry of paternal lineages from Canary Islanders. Ann Hum Genet
67, 138–152.
Frutuoso, G. (1977) Saudades da Terra, Livro IVVol. I. Ponta Delgada.
Godinho, V. M. (1965) Os Descobrimentos e a Economia Mundial.Arc´adia (Ed.),Vol 1 and 2, Lisboa.
Gonc¸alves, R., Rosa, A., Freitas, A., Fernandes, A., Kivisild, T., Villems, R. & Brehm, A. (2003) Y-chromosome lin-eages in Cabo Verde Islands witness the diverse geographic origin of its first male settlers. Hum Genet 113, 467– 478.
Gonz´alez, A. M., Brehm, A., P´erez, J., Maca-Meyer, N., Flores, C. & Cabrera, V. (2003) Mitochondrial DNA affini-ties at the Atlantic fringe of Europe. Am J Phys Anthropol
120, 391–404.
Guerra, V. (2003) Judeus e crist˜aos-novos na Madeira, 1461–1650. In: Rol dos Judeus e seus descendentes, Arquivo Hist ´orico da Madeira (Ed.), S´erie Transcric¸˜oes
Doc-umentais 1.
Hammer, M., Redd, A., Wood, E., Bonner, M., Jarjanazi, H., Karafet, T., Santachiara-Benerecetti, S., Oppenheim, A., Jobling, M., Jenkins, T., Ostrer, H. & Bonn´e-Tamir, B. (2000) Jewish and Middle Eastern non-Jewish populations share a common pool of Y-chromosome biallelic haplo-types. PNAS USA, early Ed.
Kayserling, M. (1971) Hist ´oria dos Judeus em Portu-gal.Livraria Pioneira Editora (Ed.). S˜ao Paulo.
Lopes, D. (1928) O dom´ınio ´Arabe. In Hist ´oria de Portugal (Dir. Dami˜ao Peres), Portucalence (Ed.), Barcelos. Lu´ıs, J. R., Rowold, D. J., Regueiro, M., Caeiro, B.,
Cin-nioglu, C., Roseman, C., Underhill, P. A., Cavalli-Sforza, L. L. & Herrera, R. J. (2004) The Levant versus the Horn of Africa: evidence for bidirectional corridors of human migrations. Am J Hum Genet 74, 532–44.
Malaspina, P., Tsopanomichalou, M., Duman, T., Stefan, M., Silvesti, A., Rinaldi, B., Garcia, O., Giparaki, M., Plata, E., Kozlov, A., Barbujani, G., Vernesi, C., Papola, F., Ciavarella, G., Kovatchev, D., Kerimova, M., Anagnou, N., Gavrila, L., Veneziano, L., Akar, N., Loutradis, A., Michalodimi-trakis, E., Terrenato, L. & Novelletto, A. (2001) A multistep process for the dispersal of a Y chromosomal lineage in the Mediterranean area. Ann Hum Genet 65, 339–349. Nebel, A., Filon, D., Weiss, D., Weale, M., Faerman, M.,
Oppenheim, A. & Thomas, M. (2000) High-resolution Y chromosome haplotypes of Israeli and Palestinian Arabs re-veal geographic substructure and substantial overlap with haplotypes of Jews. Hum Genet 107, 630–641.
Nebel, A., Filon, D., Brinkmann, B., Majumder, P., Faerman, M. & Oppenheim, A. (2001) The Y chromosome pool of Jews as part of the genetic landscape of the Middle East.
Nebel, A., Landau-Tasseron, E., Filon, D., Oppenheim, A. & Faerman, M. (2002) Genetic evidence for the expansion of Arabian tribes into the Southern Levant and North Africa.
Am J Hum Genet 70, 1594–1596.
Oliveira Martins, J. (1994) Hist ´oria da civilizac¸˜ao Ib´erica. Guimar˜aes (Ed.), 12th Ed., Lisboa.
Pereira, L., Prata, M. J. & Amorim, A. (2000a) Diversity of mtDNA lineages in Portugal: not a genetic edge of Euro-pean variation. Ann Hum Genet 64, 491–506.
Pereira, L., Prata, M. J., Jobling, M. & Amorim, A. (2000b) Analysis of the Y-chromosome and mitochondrial DNA pools in Portugal. In: Archaeogenetics: DNA and the pop-ulation prehistory of Europe. C. Renfrew & K. Boyle (Ed.),
McDonald Institute Monographs, Cambridge.
Quintana-Murci, L., Bigham, A., Rouba, H., Barakat, A., McElreavey, K. & Hammer, M. (2004) Y-chromosomal STR haplotypes in Berber and Arabic-speaking popula-tions from Morocco. Forensic Sci Int 140, 113–115. Rohlf, F. J. (1973) Algorithm 76. Hierarchical clustering using
the minimum spanning tree. Computer J 16, 93–95. Rohlf, F. J. (2002) NTSYSpc. Exeter Publishing, Setauket,
NY.
Rosser, Z., Zerjal, T., Hurles, M., Adojaan, M., Alavantic, D., Amorim, A., Amos, W., Armenteros, M., Arroyo, E., Barbujani, G., Beckman, G., Beckman, L., Bertranpetit, J., Bosch, E., Bradley, D., Brede, G., Cooper, G., Corte-Real, H., Knijff, P., Decorte, R., Dubrova, Y., Evgrafov, O., Gilissen, A., Glisic, S., Golge, M., Hill, E., Jeziorowska, A., Kalaydjieva, L., Kayser, M., Kivisild, T., Kravchenko, S., Krumina, A., Kucinskas, V., Lavinha, J., Livshits, L., Malaspina, P., Maria, S., McElreavey, L., Meitinger, T., Mikelsaar, A., Mitchell, R., Nafa, K., Nicholson, J., Norby, S., Pandya, A., Parik, J., Patsalis, P., Pereira, L., Peterlin, B., Pielberg, G., Prata, M., Previdere, C., Roewer, L., Rootsi, S., Rubinsztein, D., Saillard, J., Santos, F., Ste-fanescu, G., Sykes, B., Tolun, A., Villems, R., Tyler-Smith, C. & Jobling, M. (2000) Y-chromosomal diversity in Eu-rope is clinal and influenced primarily by geography, rather than by language. Am J Hum Genet 67, 1526–1543. Sanchez, J., Borsting, C., Hallenberg, C., Hernandez, A. &
Morling, N. (2003) Y Chromosome analysis of the Somali population suggests the origin of the haplogroups E3b1. Abstracts, 2ndDNA Polymorphisms in Human Populations
– International Symposium, Paris 5–6.
Schneider, S., Kueffer, J.-M., Roessli, D. & Excoffier, L. (2002) Arlequin: a software for population genetic data analysis. Genetics and Biometry Laboratory, University of Geneva, Switzerland.
Semino, O., Passarino, G., Oefner, P., Lin, A., Arbuzova, S., Beckman, L., De Benedictis, G., Francalacci, P., Kouvatsi, A., Limborska, S., Marcikiae, M., Mika, A., Mika, B., Pri-morac, D., Santachiara-Benerecetti, A., Cavalli-Sforza, L. & Underhill, P. (2000) The genetic legacy of Palaeolithic
Homo sapiens sapiens in extant Europeans: a Y chromosome
perspective. Science 290, 1155–1159.
Semino, O., Santachiara-Benerecetti, A., Falaschi, F., Cavalli-Sforza, L. & Underhill, P. (2002) Ethiopians and khoisan share the deepest clades of the human Y-chromosome phy-logeny. Am J Hum Genet 70, 265–268.
Semino, O., Magri, C., Benuzzi, G., Lin, A., Al-Zahery, N., Battaglia, V., Maccioni, L., Triantaphyllidis, C., Shen, P., Oefner, P., Zhivotovsky, L., King, R., Torroni, T., Cavalli-Sforza, L., Underhill, P. & Santachiara-Benerecetti, S. (2004) Origin, diffusion and differentiation of Y-chromosome haplogroups E and J: inferences on the Ne-olithization of Europe and later migratory events in the Mediterranean area. Am J Hum Genet 74, 1023–34. Sp´ınola, H., Brehm, A., Williams, F., Jesus, J. & Middleton,
D. (2002) Distribution of HLA alleles in Portugal and Cabo Verde. Relationships with the slave trade route. Annals Hum
Genet 66, 285–296.
Tavares, M. J. F. (2000) Os Judeus em Portugal no s´eculo XIV. Colecc¸˜ao Hist ´oria & Ensaios (2nd Ed.). Guimar˜aes (Ed.),
Lisboa.
Thomas, M. G., Bradman, N. & Flinn, H. (1999) High throughput analysis of 10 microsatellite and 11 diallelic polymorphisms on the human Y chromosome. Hum Genet
105, 577–581.
Underhill, P., Shen, P., Lin, A., Jin, L., Passarino, G., Yang, W., Kauffman, E., Bonne-Tamir, B., Bertranpetit, J., Francalacci, P., Ibrahim, M., Jenkins, T., Kidd, J., Mehdi, S., Seielstad, M., Wells, R., Piazza, A., Davis, R., Feldman, M., Cavalli-Sforza, L. & Oefner, P. (2000) Y chromosome sequence variation and the history of human populations.
Nature Genet 26, 358–361.
Underhill, P., Passarino, G., Lin, A., Shen, P., Mirazon, Lahr, M., Foley, R., Oefner, P. & Cavalli-Sforza, L. (2001) The phylogeography of Y chromosome binary haplotypes and the origins of modern human populations. Ann Hum Genet
65, 43–62.
Y Chromosome Consortium (2002) A nomenclature system for the tree of human Y-chromosomal binary haplogroups.
Genome Res 12, 339–348.
Zhivotovsky, L. A. (2001) Estimating divergence time with use of microsatellite genetic distances: impacts of population growth and gene flow. Mol Biol Evol 18, 700–709. Zhivotovsky, L. A., Underhill, P. A., Cinnio˘glu, C., Kayser,
M., Morar, B., Kivisild, T., Scozzari, R., Cruciani, F., Destro-Bisol, G., Spedini, G., Chambers, G. K., Herrera, R. J., Yong, K. K., Gresham, D., Tournev, I., Feldman, M. W. & Kalaydjieva, L. (2004) On the effective mutation rate at Y-chromosome STRs with application to human population divergence time. Am J Hum Genet 74, 50–61.
Received: 26 May 2004 Accepted: 7 December 2004