Victor Mouzinho Spinelli1, Marcos Santana Moraes2, Darlan Sanches Barbosa Alves3,
Rodrigo Barros Rocha4, André Rostand Ramalho5, Alexsandro Lara Teixeira6 (Received: March 20, 2018; accepted: June 12, 2018)
ABSTRACT: The evaluation of morphological characters related to the hulled coffee yield subsidizes the selection of Coffea
canephora plants that combine a set of favorable traits. The aim of this study was to evaluate the direct and indirect effects
of agronomic traits on the production of hulled coffee to subside the plant selection. To this, nine morphological descriptors were evaluated of 130 clones of the botanical varieties Conilon and Robusta over two crop years in the experimental field of Embrapa, in the municipality of Ouro Preto do Oeste, state of Rondônia (RO). To quantify the genetic variability the path analysis and the Scott Knott cluster test were used. The effect of genotype x year interaction was significant for eight of the nine characteristics analyzed. The genotypes were clustered in three to five classes, subsidizing the establishment of a scale to evaluate the variability of this genetic resource. Pathway analysis indicated that the number of plagiotropic branches and the number of rosettes per productive branch were the traits that exhibited the greatest direct effect on hulled coffee yield. These results show that it is possible to select plants with complementarity traits which favor a higher production of hulled coffee. Index terms: Conilon coffee, Robusta coffee, path analysis, genetic variability.
CONTRIBUIÇÃO DE CARACTERES AGRONÔMICOS PARA A PRODUTIVIDADE DE CAFÉ BENEFICIADO DE Coffea canephora Pierre ex A. Froehner
NA REGIÃO AMAZONICA OCIDENTAL
RESUMO: A utilização simultânea de caracteres morfológicos associados à produtividade de café beneficiado subsidia a seleção de plantas de Coffea canephora que apresentem um conjunto de características favoráveis. O objetivo desse estudo foi avaliar os efeitos diretos e indiretos de características agronômicas sobre a produção de café beneficiado de C. canephora subsidiando a seleção de plantas. Para isso foram considerados nove descritores morfológicos avaliados em 130 clones das variedades botânicas Robusta e Conilon ao longo de dois anos agrícolas no campo experimental da Embrapa, no município de Ouro Preto do Oeste, estado de Rondônia (RO). Para quantificar a variabilidade genética, utilizou-se a análise de trilha e o teste do agrupamento Scott Knott. O efeito da interação genótipo x ano foi significativo para oito das nove características analisadas. Os genótipos foram agrupados em três a cinco classes, delimitando uma escala que pode ser utilizada para avaliar a variabilidade deste recurso genético. A análise de trilha indicou que o número de ramos plagiotrópicos e o número de rosetas por ramo produtivo foram as características que apresentaram o maior efeito direto sobre o rendimento do café beneficiado. Termos para indexação: Café Conilon, café Robusta, análise de trilha, variabilidade genética.
1 INTRODUCTION
The Coffea canephora Pierre ex A. Froehner represents approximately 35% of world coffee production and it is characterized by high plant vigor and high yield (Ico, 2016). In the Western Amazon, the state of Rondônia stands out as a traditional coffee producer with approximate production of 1.93 million bags of hulled coffee in 2017 (Conab, 2017).
This species presents two botanical varieties with distinct characteristics that are commercially cultivated (Davis et al., 2006). The botanical variety Robusta is characterized by erect growth, larger leaf size, higher average sieve, late maturation, less tolerance to water deficit, and greater resistance to diseases and pests.
1,2,3,4,5,6 Empresa Brasileira de Pesquisa Agropecuária - Embrapa Rondônia - BR 364 - Km 5,5 - Zona Rural - 76.815-800 -
Porto Velho RO spinellivm@gmail.com marcosopo16@hotmail.com darlansanches1@icloud.com rodrigo.rocha@embrapa.br andre.rostand@embrapa.br - alexsandro.teixeira@embrapa.br
The botanical variety Conilon is characterized by shrub growth, early maturation, elongated leaves, greater tolerance to drought, and greater susceptibility to pests and diseases (Montagnon et al., 2012; Oliveira et al., 2018).
In modern agriculture, two main strategies are considered to increase yield per area: planting genetically superior materials and improving growing conditions (Ramalho et al., 2012; Ferrão et al., 2017). In various crops, an additive relationship between these factors has been observed, the result of the expression of superior genetic potential with improvement of growing conditions (Dubberstein et al., 2017; Rodrigues et al., 2016). In classical breeding of C. canephora, the aim is to select plants with superior yield potential associated with greater uniformity of ripening, greater sieve size, and smaller plant architecture (Teixeira et al., 2017).
Contribution of agronomic traits to the coffee ... 334
branches (NPLAG), number of rosettes per branch (NROS), length of plagiotropic branches (LPLAG), number of fruits per rosette (FROS), distance between rosettes (DROS), number of days to fruit ripening (NDAYS), hulled coffee bean yield (YLD), and mean sieve size (SIEV). The field experiment was managed according to Marcolan et al. (2009).
The assay installed in November 2011 was carried out in the experimental field of Embrapa, in the municipality of Ouro Preto do Oeste, state of Rondônia (RO). The Climate in the region, according to Köppen, is tropical rainy, with mean annual rainfall of 1939 mm/year and mean annual temperatures from 21.2ºC to 30.3ºC. The region is located at 10º37’03’’S and 62º51’50’’W, with relative humidity throughout the year around 81%. Soil in the experimental area is eutrophic red-yellow oxisol with clayey texture and flat topography, it is a deep and well-drained soil. The experimental design was randomized blocks with four replications of four plants per plot at spacing of 3.5 x 1.5 meters, between plants and between rows, respectively.
Multicollinearity diagnosis and pathway analysis
Data were subjected to analysis of variance and analysis of homoscedasticity. With the aim of clustering the clones in divergent and mutually exclusive groups, the Scott Knott mean clustering test was used at 5% probability (Cruz, 2013).
Pathway analysis was conducted by estimating the phenotypic correlations (rf) between the traits and their significance was tested at 1% and 5% probability by the t test at
(
n
−
2
)
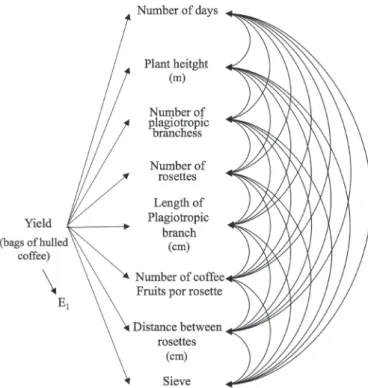
degrees of freedom (Cruz et al., 2014). Multicollinearity was diagnosed according to the condition number (CN) of the singular matrix X’X, defining the ratio between the largest and smallest eigen value of the correlation matrix. According to Montgomery & Peck, (1981), if CN<100, multicollinearity is weak and does not constitute a problem for analysis; if 100<CN<1000 multicollinearity is moderate to strong; and if CN>1000, it is severe.To obtain estimates of the direct and indirect effects, a causal diagram was established that considers the logical, additive relationship among the primary and secondary yield components (Figure 1). The statistical analyses were done using the statistical software Genes, version 1990.2018.18 (Cruz, 2013).
In addition to the long reproductive cycle, the overlapping of generations, and the vigor that is manifested in plants from divergent crosses; association among the coffee bean yield components has considerable implications for breeding of this species (Souza et al., 2017; Rocha et al., 2015). According to Cruz et al. (2014), genetic gain from direct selection is defined as changes in the population mean resulting from selection practiced on the trait itself. However, it is known that selection in one main trait may result changes that can favor or hinder the selection of plants that combine a series of favorable characteristics.
Pathway analysis, originally proposed by Wright (1923), allows the correlation coefficients to be broken down into their direct and indirect effects on a main trait. Appropriate interpretation of pathway analysis depends on the creation of a cause and effect diagram, which represents the relationship of secondary traits on a main trait when complex relationships are involved (Cruz et al., 2014).
Bikila and Sakiyama (2017) observed significant estimates of the simple correlation coefficient between yield, number of plagiotropic branches and plant height. Cilas et al. (2006) observed significant phenotypic correlations among the distance between rosettes, the number of rosettes and hulled coffee yield. Ferrão et al. (2008a) observed higher magnitude of the genotypic correlations compared to the environmental correlations, selecting plants of higher yield potential. Studies were not found in the literature that estimated the direct and indirect effects of other agronomic traits on C. canephora hulled coffee yield.
In this context, the aim of this study was to quantify the direct and indirect effects of morphological and yield traits on the hulled coffee bean yield of C. canephora, for the purpose of subsidizing the characterization and use of the genetic variability of this species.
2 MATERIALS AND METHODS Field experiment
Over the 2013-2014 and 2014-2015 crop years, nine morphological and yield descriptors were evaluated from 130 genotypes with characteristics of the botanical varieties Robusta (37), Conilon (75), and interspecific hybrids (18): plant height (PHt), number of plagiotropic
3 RESULTS AND DISCUSSION
The effect of the clone × year interaction wasn’t significant for only one of the nine traits analyzed (Table 1). The significant effect of the clones x year interaction difficult the improvement of perennial species, as it results in a decrease in the genetic progress obtained with plant selection resulting from changes in the order of clones selected from one year to the next. Expressive clone × year interaction were also observed by Souza et al. (2013) and Montagnon et al. (2012) in genotypes evaluated in the state of Espírito Santo and in Ivory Coast.
Characterization of C. canephora genotypes should consider both superior performance and maintenance of superiority over time (Silva et al., 2017). Although the effect of the genotype × year interaction was significant, except for SIEV, the repeatability estimates of the traits evaluated indicate the predominance of simple interaction (Resende; Duarte, 2007) (Table1). Simple interaction is characterized by smaller changes in ordering of the genotypes over time, unlike complex interaction, which is characterized by the absence of correlation in ordering of genotypes over time (Cruz et al., 2014).
FIGURE 1 - Illustrative diagram representing in the single-headed arrows, the direct effects of eight explanatory variables on the main variable, yield. The bidirectional arrows represent the indirect effects quantified by the phenotypic correlation coefficients.
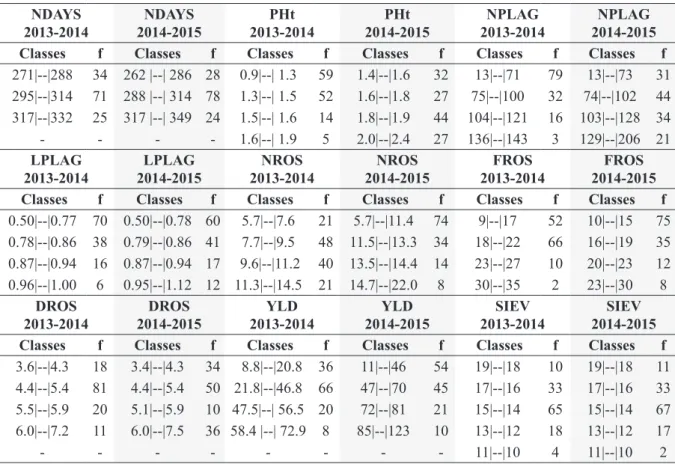
The Scott Knott cluster test at 5% probability was used with the aim of grouping the genotypes in mutually exclusive classes. This test allows the genotypes to be grouped in sets of minimum variation within groups and maximum variation among groups, making it easier to interpret results, due to the absence of ambiguity (Bhering et al., 2008). The clones evaluated were clustered in three to five mutually exclusive groups, depending on the trait (Table 2).
The grouping based in the number of days to fruit ripening (NDAYS) indicated the existence of three different times of fruit ripening, with approximately 20 days difference between them (Table 2). This grouping corroborates the variability observed in the field in which clones that mature in Abril, May, and June are called early, intermediate, and late clones, respectively. Partelli et al. (2014) and Morais et al. (2012) observed genotypes with fruit ripening in March and July called super early and super late, respectively.
For hulled coffee yield (YLD), four different yield classes were observed, with amplitude from 8.8 to 72.9 bags.ha-1 in the first
harvest and from 11.3 to 123.7 bags.ha-1 in the
Contribution of agronomic traits to the coffee ... 336
TABLE 1 - Summary of the F estimates of the joint analyses variance for the traits: number of days to fruit ripening (NDAYS), plant height (PHt), number of plagiotropic branches (NPLAG), number of rosettes per branch (NROS), length of plagiotropic branches (LPLAG), number of fruits per rosette (FROS), distance between rosettes (DROS), yield (YLD), and mean sieve size (SIEV) of C. canephora coffee, evaluated in the 2013-2014 and 2014-2015 crop years.
S.V. NDAYS PHt NPLAG NROS LPLAG FROS DROS SIEV YLD
Blocks Clones 6.78** 5.52** 5.92** 1.79** 4.94** 1.51* 2.72** 4.57** 3.64** Years 2.10** 1387.98** 169.47** 68.43** 14.96** 26.33** 24.67** 0.51NS 148.38** Clones xYears 2.94** 4.43** 2.29** 3.11** 2.70** 8.12** 7.84** 2.96NS 3.90** Residue Mean 302.0 1.58 81.34 10.33 0.79 17.01 4.91 15.09 43.31 Mean1st measure 302.7 1.32 67.95 9.44 0.77 18.09 5.06 15.12 33.70 Mean2nd measure 301.2 1.84 94.72 11.22 0.80 15.92 4.76 15.06 52.91 Repeatability 85.25 81.89 83.13 44.38 79.83 33.68 63.23 78.14 72.51 CV 3.25 6.65 26.91 19.09 9.43 14.03 7.25 5.43 29.72
*and ** = significant at 1% and 5% probability by the F test, respectively. r = repeatability; CV = coefficient of variation.
TABLE 2 - Grouping by interval of classes of the C. canephora coffee yield traits. Embrapa, RO, Brazil. NDAYS
2013-2014 2014-2015NDAYS 2013-2014PHt 2014-2015PHt 2013-2014NPLAG 2014-2015NPLAG Classes f Classes f Classes f Classes f Classes f Classes f 271|--|288 34 262 |--| 286 28 0.9|--| 1.3 59 1.4|--|1.6 32 13|--|71 79 13|--|73 31 295|--|314 71 288 |--| 314 78 1.3|--| 1.5 52 1.6|--|1.8 27 75|--|100 32 74|--|102 44 317|--|332 25 317 |--| 349 24 1.5|--| 1.6 14 1.8|--|1.9 44 104|--|121 16 103|--|128 34
- - - - 1.6|--| 1.9 5 2.0|--|2.4 27 136|--|143 3 129|--|206 21
LPLAG
2013-2014 2014-2015LPLAG 2013-2014NROS 2014-2015NROS 2013-2014FROS 2014-2015FROS Classes f Classes f Classes f Classes f Classes f Classes f 0.50|--|0.77 70 0.50|--|0.78 60 5.7|--|7.6 21 5.7|--|11.4 74 9|--|17 52 10|--|15 75 0.78|--|0.86 38 0.79|--|0.86 41 7.7|--|9.5 48 11.5|--|13.3 34 18|--|22 66 16|--|19 35 0.87|--|0.94 16 0.87|--|0.94 17 9.6|--|11.2 40 13.5|--|14.4 14 23|--|27 10 20|--|23 12 0.96|--|1.00 6 0.95|--|1.12 12 11.3|--|14.5 21 14.7|--|22.0 8 30|--|35 2 23|--|30 8
DROS
2013-2014 2014-2015DROS 2013-2014YLD 2014-2015YLD 2013-2014SIEV 2014-2015SIEV Classes f Classes f Classes f Classes f Classes f Classes f 3.6|--|4.3 18 3.4|--|4.3 34 8.8|--|20.8 36 11|--|46 54 19|--|18 10 19|--|18 11 4.4|--|5.4 81 4.4|--|5.4 50 21.8|--|46.8 66 47|--|70 45 17|--|16 33 17|--|16 33 5.5|--|5.9 20 5.1|--|5.9 10 47.5|--| 56.5 20 72|--|81 21 15|--|14 65 15|--|14 67 6.0|--|7.2 11 6.0|--|7.5 36 58.4 |--| 72.9 8 85|--|123 10 13|--|12 18 13|--|12 17
- - - 11|--|10 4 11|--|10 2
f = simple absolute frequency; NDAYS = number of days to fruit ripening; PHt = plant height; NPLAG = number of plagiotropic branches; LPLAG = length of plagiotropic branches; NROS = number of rosettes; DROS = distance between rosettes; FROS = number of fruits per rosette; YLD = hulled coffee yield; SIEV = mean sieve size.
Hulled coffee yield is a quantitative trait of continuous distribution expression, influenced both by the genotype and by the environment (Cruz et al., 2014). The establishment of mutually exclusive groups ordered according to the variability of the trait, allowed establishment of scales that differentiate plants with low, medium, high, and very high yield (Table 2).
Plant height (PHt) was grouped in four different classes, with amplitude from 0.92 to 1.87 m in the first harvest and from 1.36 to 2.39 min the second; a mean increase of 0.90 m between the first and second year of evaluation was observed. Bergo et al. (2008) observed genotypes of C. canephora that after four years of growth in the field exhibited mean height of 3.55 m in comparison with the cultivars Icatu and Catuaí of C. arabica, which exhibited 3.33 m and 2.71 m height, respectively. According to Ferrão et al. (2008b), this trait is predominantly under genetic control, with heritability estimates higher than 0.60.
The NPLAG and LPLAG traits were grouped in four different classes (Table 2). For NPLAG, an increase in the mean value from 26 to 47 plagiotropic branches was observed between the first and second year; and for LPLAG, a mean increase of 120 cm was observed between the first and the second year (Table 2). This classification allows to identify plants of greater yield potential, which stand out through a higher number and greater length of productive branches.
The NROS, FROS, and DROS traits were also grouped in four different classes. The NROS exhibited an increase in the mean number of rosettes over time, from 8.8 to 16.3, unlike FROS, which exhibited a similar mean performance over time of 18.09 in the first year and 15.92 in the second year of evaluation (Table 2). For DROS were identified groups with minimal, small, intermediate, and large distance between rosettes (Table 2).
In relation to mean sieve size (SIEV), distribution of clones was observed in five classes, with amplitude from 10 to 19, with a small variation over time of 14.82 in the first year and 14.75 in the second year. Ramalho et al. (2016) observed greater amplitude in genotypes of the Conilon botanical variety, from 13.6 to 17 and a mean sieve size of 15.4.
The study of the direct and indirect effects of the plant traits on coffee yield allows to identify the degree of importance of the explanatory variables to the main variable (Sureshkumar et al., 2013). The pathway diagram shows the
relationship between the primary components and hulled coffee yield (Figure 1). To estimate the direct and indirect effects of pathway analysis, it is necessary that the X’X matrix not have high levels of multicollinearity, since in the presence of multicollinearity, the variances associated with the estimators of the pathway coefficients can reach excessively high values (Cruz et al., 2014). According to Montgomery & Peck (1981), the estimates of phenotypic correlations showed weak multicollinearity, and it was not necessary to discard any of the traits analyzed (Table 3).
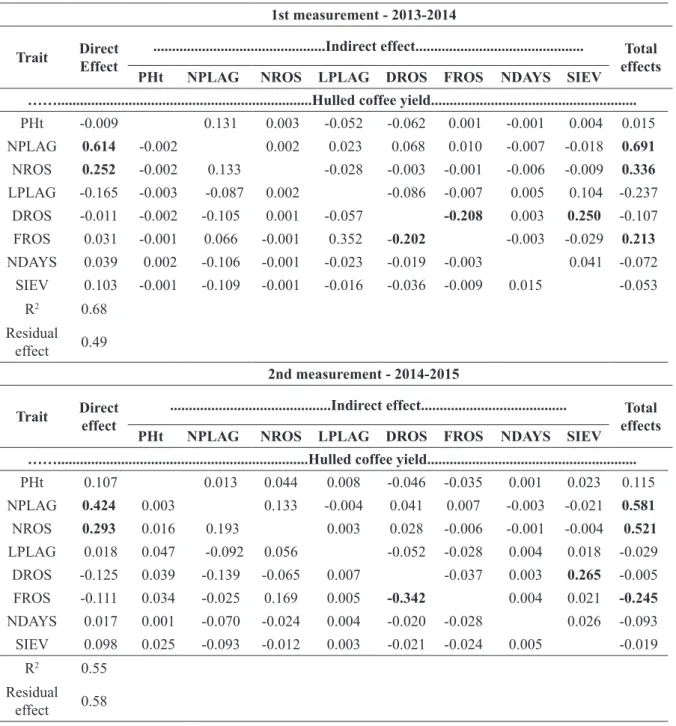
The coefficient of determination of the pathway analysis (R²), which measures the fraction of total variation explained by the variables under study, was estimated at 68% in the first harvest and 55% in the second harvest (Table 3). In the second year the residual effect exceed the coefficient of determination. According to Cruz et al. (2014), the values observed allow to interpret the cause and effect relations since a representative fraction of the variability is explained by the traits of the diagram.
In evaluation of the direct effects of the plant traits on the main variable (YLD), the highest magnitude was found for NPLAG that was the most important for hulled coffee yield, followed in smaller proportion by NROS in the first and second year of evaluation (Table 3). Positive associations between development of plagiotropic branching and hulled coffee yield were also observed by Dalcomo et al. (2017) in C. canephora.
Different associations can facilitate or hinder the selection process. The effects of DROS were negative in relation to the FROS trait and positive in relation to SIEV, since a lower distance between rosettes was associated with a lower number of fruits per rosette and with a lower mean sieve size. Cilas et al. (2006) observed that a higher number of fruits per rosette were also associated with a greater distance between them.
The small direct effect of the PHt trait on yield indicates the possibility of selecting plants of smaller size and of superior yield (Table 3). On the other hand, Bikila and Sakiyama (2017) observed a positive association between plant height and yield. This association was not observed in the germplasm evaluated, which has genotypes of the Conilon botanical variety that stand out for lower height and good yield potential. Rocha et al. (2014) also observed a positive correlation between plant height and distance between rosettes.
Contribution of agronomic traits to the coffee ... 338
TABLE 3 - Estimates of the direct and indirect effects of the secondary traits of number of days to fruit ripening (NDAYS), number of plagiotropic branches (NPLAG), number of rosettes (NROS), length of plagiotropic branches (LPLAG), number of fruits per rosette (FROS), distance between rosettes (DROS), and mean sieve size (SIEV) on the primary trait of hulled coffee yield (YLD). Bold print highlights the associations of greatest relevance.
1st measurement - 2013-2014
Trait DirectEffect ...Indirect effect... effects Total
PHt NPLAG NROS LPLAG DROS FROS NDAYS SIEV
……...Hulled coffee yield... PHt -0.009 0.131 0.003 -0.052 -0.062 0.001 -0.001 0.004 0.015 NPLAG 0.614 -0.002 0.002 0.023 0.068 0.010 -0.007 -0.018 0.691 NROS 0.252 -0.002 0.133 -0.028 -0.003 -0.001 -0.006 -0.009 0.336 LPLAG -0.165 -0.003 -0.087 0.002 -0.086 -0.007 0.005 0.104 -0.237 DROS -0.011 -0.002 -0.105 0.001 -0.057 -0.208 0.003 0.250 -0.107 FROS 0.031 -0.001 0.066 -0.001 0.352 -0.202 -0.003 -0.029 0.213 NDAYS 0.039 0.002 -0.106 -0.001 -0.023 -0.019 -0.003 0.041 -0.072 SIEV 0.103 -0.001 -0.109 -0.001 -0.016 -0.036 -0.009 0.015 -0.053 R2 0.68 Residual effect 0.49 2nd measurement - 2014-2015
Trait Direct effect ...Indirect effect... effects Total
PHt NPLAG NROS LPLAG DROS FROS NDAYS SIEV
……...Hulled coffee yield...
PHt 0.107 0.013 0.044 0.008 -0.046 -0.035 0.001 0.023 0.115 NPLAG 0.424 0.003 0.133 -0.004 0.041 0.007 -0.003 -0.021 0.581 NROS 0.293 0.016 0.193 0.003 0.028 -0.006 -0.001 -0.004 0.521 LPLAG 0.018 0.047 -0.092 0.056 -0.052 -0.028 0.004 0.018 -0.029 DROS -0.125 0.039 -0.139 -0.065 0.007 -0.037 0.003 0.265 -0.005 FROS -0.111 0.034 -0.025 0.169 0.005 -0.342 0.004 0.021 -0.245 NDAYS 0.017 0.001 -0.070 -0.024 0.004 -0.020 -0.028 0.026 -0.093 SIEV 0.098 0.025 -0.093 -0.012 0.003 -0.021 -0.024 0.005 -0.019 R2 0.55 Residual effect 0.58
:
2R
Coefficient of determinationYield potential is related to the indirect effects of NROS and LPLAG on hulled coffee yield (Table 3). Although mean sieve size (SIEV) is important for better beverage quality, the small direct and indirect effects of this trait on yield
indicate that hulled coffee yield was more related to the capacity of the plant to produce fruits than to the variability of coffee bean size.
These results reveal that it is possible to select plants that aggregate a set of favorable
traits associated with higher hulled coffee yield, such as higher number of productive branches, higher number of rosettes per branch, and lower distance between rosettes. The complementarity of the Conilon and Robusta traits favors selection of hybrid genotypes that express the best traits of each breeding population.
4 CONCLUSIONS
Although the effect of the genotype × year interaction was not significant for only one trait, the repeatability estimates indicate predominance of simple interaction over the years. The establishment of mutually exclusive groups, ordered according to the variability of the traits, subsidizes the establishment of a scale to evaluate the variability of this genetic resource. Pathway analysis indicated that the number of plagiotropic branches and the number of rosettes per productive branch were the traits that exhibited the greatest direct effect on hulled coffee yield.
5 ACKNOWLEDGEMENTS
The authors thank to the Conselho Nacional de Desenvolvimento Científico e Tecnológico (CNPq) for the scholarship and research grant. We also gratefully acknowledge the Consórcio Pesquisa Café for financial support.
6 REFERENCES
BERGO, C. L.; PEREIRA, R. C. A.; SALES, F. Avaliação de genótipos de cafeeiros Arabica e Robusta no Estado do Acre. Ciência e Agrotecnologia, Lavras, v. 32, n. 1, p. 11-16, Jan/Feb. 2008.
BHERING, L. L. et al. Alternative methodology for Scott-Knott test. Crop Breeding And Applied Technology, Viçosa, v. 8, n. 1, p. 9-16, Jan/Mar. 2008. BIKILA, B. A.; SAKIYAMA, N. S. Estimation of Genetic Parameters in Coffea canephora Var. Robusta. Advances in Crop Science and Technology, v. 5, n. 5, p. 310, Sept/Oct. 2017.
CILAS, C. et al. Definition of architectural ideotypes for good yield capacity in Coffea canephora. Annals of Botany, v. 97, n. 3, p. 405–411, Mar. 2006.
CONAB (2017). Companhia Nacional de Abastecimento. Café: Safra 2016: Primeira Estimativa. Available on: <http://www.conab.gov.br> Access in: 05 April 2016.
CRUZ, C. D. Genes: a software package for analysis in experimental statistics and quantitative genetics. Acta Scientiarum, Maringá, v. 35, n. 3, p. 271-276, July/ Sept. 2013.
CRUZ, C. D.; REGAZZI, A. J.; CARNEIRO, P. C. S. Modelos biométricos aplicados ao melhoramento genético. 3ed, Viçosa: Editora UFV, 2014, 560p. DALCOMO, J. M. et al. Growth comparison of 22 genotypes of conilon coffee after regular pruning cycle. African Journal of Agricultural Research, v. 12, n. 1, p. 63-70, Jan. 2017.
DAVIS, A. P. et al. An annotated taxonomic conspectus of the genus Coffea (Rubiaceae). Botanical Journal of the Linnean Society, London, v. 152, n. 4, p. 465-512, Dec. 2006.
DUBBERSTEIN, D. et al. Matéria seca em frutos, folhas e ramos plagiotrópicos de cafeeiros cultivados na Amazônia Ocidental. Coffee Science, Lavras, v. 12, n. 1, p. 74-81, Jan/Mar. 2017.
FERRÃO, R. G. et al. Parâmetros genéticos em café Conilon. Pesquisa Agropecuária Brasileira, Brasília, v. 43, n. 1, p. 61-69, Jan. 2008b.
FERRÃO, R. G. et al. Inter-trait relations for direct and indirect selection in Coffee. Crop Breeding and Applied Biotechnology, Viçosa, v. 8, n. 4, p. 271-278, Oct/Dec. 2008a.
FERRÃO, R. G. et al. Café Conilon. 2 ed, Vitória, ES: Incaper, 2017, p. 784.
ICO - International Coffee Organization Robusta cupping protocols (2010) PSCB 123/10. Available on: <http://dev.ico.org/documents/pscb-123-e-robusta. pdf>. Access in: 09 Sept. 2016.
MARCOLAN, A. L. et al. Cultivo dos cafeeiros Conilon e Robusta para Rondônia. 3. ed. rev. atual. Porto Velho: Embrapa Rondônia, (Embrapa Rondônia. Sistema de produção, 33), 2009, 67p.
MONTAGNON, C.; CUBRY, P.; LEROY, T. Amélioration génétique du caféier Coffea canephora Pierre: connaissnacesacquises, stratégieset perspectives. Cahiers Agricultures, Montipellier, v. 21, n. 2-3, p. 143-153, Mar/June. 2012.
Contribution of agronomic traits to the coffee ... 340
MONTGOMERY, D. C.; PECK, E. A. Introduction to linear regression analysis. New York: J. Wiley, 1981, p. 504.
MORAIS, L. E. et al. The effects of pruning at different times on the growth, photosynthesis and yield of conilon coffee (Coffea canephora) clones with varying patterns of fruit maturation in southeastern Brazil. Experimental Agriculture, Baltimore, v. 48, n. 2, p. 210-221, Apr/June. 2012.
OLIVEIRA, L. N. L. D. et al. Selection of Coffea
canephora parents from the botanical varieties Conilon
and Robusta for the production of intervarietal hybrids. Ciência Rural, Santa Maria, v. 48, n. 4, Apr. 2018. PARTELLI, F. L. et al. Dry matter and macronutrient accumulation in fruits of conilon coffee with different ripening cycles. Revista Brasileira de Ciência do Solo, Viçosa, v. 38, n. 1, p. 214-222, Jan/Feb. 2014. RAMALHO, A. R. et al. Progresso genético da produtividade de café beneficiado com a seleção de clones de cafeeiro ‘Conilon’. Revista Ciência Agronômica, Ceará, v. 47, n. 3, p. 516-523, July/Sept. 2016.
RAMALHO, M. A. P.; DIAS, L. A. D. S.; CARVALHO, B. L. Contributions of plant breeding in Brazil: progress and perspectives. Crop Breeding and Applied Biotechnology, v. 12, n. edição especial, p. 111-120, Nov. 2012.
RESENDE, M. D. V.; DUARTE, J. B. Precisão e controle de qualidade em experimentos de avaliação de cultivares. Pesquisa Agropecuária Tropical, Goiânia, v. 37, n. 3, p. 182-194, July/Sept. 2007.
ROCHA, R. B. et al. Adaptabilidade e estabilidade da produção de café beneficiado em Coffea canephora. Ciência Rural, Santa Maria, v. 45, n. 9, p. 1531-1537, Sept. 2015.
ROCHA, R. B. et al. Caracterização e uso da variabilidade genética de banco ativo de germoplasma de Coffea canephora Pierre ex Froehner. Coffee Science, Lavras, v. 8, n. 4, p. 478-485, Oct/Dec. 2013. RODRIGUES, W. P. et al. Assessment of genetic divergence among coffee genotypes by Ward-MLM procedure in association with mixed models. Genetics and Molecular Research, Ribeirão Preto, v. 15, n. 2, p. 1-7, Apr/June. 2016.
SILVA, V. A. et al. Adaptability, stability, and genetic divergence of conilon coffee in Alto Suaçuí, Minas Gerais, Brazil. Crop Breeding and Applied Biotechnology, Viçosa, v. 17, n. 1, p. 25-31, Jan/Mar. 2017.
SOUZA, C. A. et al. Componentes genéticos do desenvolvimento e maturação de frutos de Coffea
canephora Pierre ex A. Froehner. Coffee Science,
Lavras, v. 12, n. 3, p. 355-364, July/Sept. 2017. SOUZA, F. D. F. et al. Molecular diversity in Coffea
canephora germplasm conserved and cultivated in
Brazil. Crop Breeding and Applied Biotechnology, Viçosa, v. 13, n. 4, p.221-227, Oct/Dec. 2013.
SURESHKUMAR, V. B. et al. Interrelationship and association of characters in Robusta Coffee (Coffea
Canephora Var. Robusta). Agriculture, Forestry and
Fisheries, New York, v. 2, n. 2, p. 98-104, Mar/Apr. 2013.
TEIXEIRA, A. L. et al. Performance of intraspecific hybrids (Kouillou x Robusta) of Coffea canephora Pierre. African Journal of Agricultural Research, Lagos, v. 12, n. 35, p. 2675-2680, Aug. 2017. WRIGHT, S. Theory of path coefficients. Genetics, Madison, v. 8, n. 3, p. 239-285, May/June. 1923.