BJRS
RADIATION SCIENCES
08-02 (2020) 01-22
ISSN: 2319-0612 Accepted: 2020-04-27
Planar and tomographic imaging dosimetry comparing to
develop a new radiopharmaceutical for melanoma therapy
Soriano S. C.S.
a, Barboza, T.
b, Souza S.A.L.
b, Sá L.V.
aa Instituto de Radioproteção e Dosimetria (IRD)/Comissão Nacional de Energia Nuclear (CNEN), 22783-127 Rio de Janeiro, RJ
b Hospital Universitário Clementino Fraga Filho(HUCFF)/Universidade Federal do Rio de Janeiro, 21941-913
Rio de Janeiro, RJ
ABSTRACT
This work aims to compare SPECT (Single Photon Emission Tomography Computed) and planar modalities as the most efficient methodology to perform dosimetry by molecular imaging. Twenty-one male C57BL6 mice induced with murine melanoma cell line B16-F10, administered 131I-Ixolaris were used for melanoma therapy.
The procedures applied to them followed the standards described for the use of experimental animals, duly ap-proved by the National Council for Animal Experimentation Control (CONCEA from Federal University of Rio de Janeiro. The accumulated activities were obtained in order to estimate the absorbed doses in each organ. Mass and metabolic differences between mice and humans were considered and used to extrapolate data ac-quired at different scales. From the dose factors provided by the IDAC 2.1 software, the absorbed doses in the target organs irradiated by the source organs were calculated and, finally, the effective dose was estimated. From the Student's t-hypothesis test performed in the accumulated activity, absorbed dose and S-factor quantities, there is no statistically significant difference between performing the image dosimetry from SPECT and planar acquired images.
1. INTRODUCTION
Technological innovation associated new radiopharmaceuticals developments contribute to re-cent diagnostic and therapeutic tools. To register a new drug, however, preclinical trial reports are required as well as three clinical trial phases [1]. Dosimetry is an integral and fundamental part of preclinical studies and can be performed semi-quantitatively, where relative measurements are compared with healthy regions; physiological quantification, such as perfusion or glucose metabo-lism; and absolute quantification, which was the main focus of this work, that is, the measurement of the true concentration of activity in a volume of interest [2].
Molecular imaging is based on the tracer principle, where a tiny amount of a radiopharmaceuti-cal is introduced into the body to monitor the physiologiradiopharmaceuti-cal function of the patient. Thus, it is possi-ble to evaluate the physiological function of tissues, organs and systems [3]. Planar scintigraphy is used extensively in clinical practice because it offers the advantage of fast, large area acquisition at relatively low cost [4]. The limitation of this technique is the lack of information about the spatial distribution of radioactivity in the body. In addition, acquired images may exhibit limited contrast as structures overlaps. On the other hand, Single Photon Emission Computed Tomography (SPECT) and Positron Emission Tomography (PET) produces images that represent the three-dimensional distribution of radioactivity. This improves both image quality and the potential for quantifying the distribution of radioactivity in vivo. However, there are some factors to consider such as system sensitivity and resolution, dead time and attenuation, scatter and partial volume ef-fects, voluntary and involuntary patient movement, kinetic differences, and radiopharmaceutical bladder filling [5].
Previous studies [6] demonstrated that C57BL6 mice induced with murine melanoma B16-F10 obtained good specificity with the radiopharmaceutical 99mTc-Ixolaris in their diagnosis, in addition
to its safe use. Therefore, 131I-Ixolaris shows promise in melanoma therapy. The development of a
new therapeutic option could improve the survival of patients with metastatic melanoma, and in some cases even bring about a cure, avoiding more aggressive treatments such as external beam radiotherapy and chemotherapy. The aim of this paper is to compare preclinical dosimetry results by the two imaging methods, planar and SPECT.
2. MATERIALS AND METHODS
2.1. Animal model
The procedure applied followed the patterns described for the use of experimental animals approved by National Counsel of Animal Experimentation Control (CONCEA).
A group of 1E+06 murine melanoma cell line B16-F10 was induced by intravenous administra-tion (caudal vein) in twenty-one young male adults C57BL6 mice weighing between 25 and 30 g. For cellular implantation, mice were intraperitoneal anesthetized with 15 mg/kg of xylazine and 80 mg/kg of ketamine. As the animals are of the same lineage, same sex, same age and are cared for under the same conditions, we can say that they will have the same answer to biodistribution study.
2.2. Radiopharmaceutical
Ixolaris labeling with 131I was performed by the direct method using iodogen [7]. Iodogen (1mg) was dissolved in dichloromethane (25 ml) and 50, 100 and 200 μg aliquots were used in conical glass tubes and evaporated through a continuous flow nitrogen evaporation chamber, forming a film at the bottom of the tube. The tubes containing the films can be stored for up to 6 months at -20 °C [8].
In one of these tubes, the labeling process used 10 μL phosphate buffer (0.05M, pH 7.4), 10 μL ixolar (1μg) followed by 10 μL Na131I with different activities 0.5 mCi, 5 mCi and 10 mCi, leaving
for 10 minutes at room temperature. Soon after this solution was removed to a new clean tube, 250 μL of phosphate buffered saline (PBS) (0.01M) including pH 7.4 sodium chloride (1M) was used. Ten minutes later, 250 μL of PBS containing 1% potassium iodine was selected. Thus, the 131I –
Ixolaris radiopharmaceutical was ready for quality control [9].
2.3. Molecular image acquisition and quantification
To guarantee that the mice’s thyroid was blocked, 0.14 mg of sodium iodide was mixed with the water supplied to the mice 48 hours before molecular imaging.
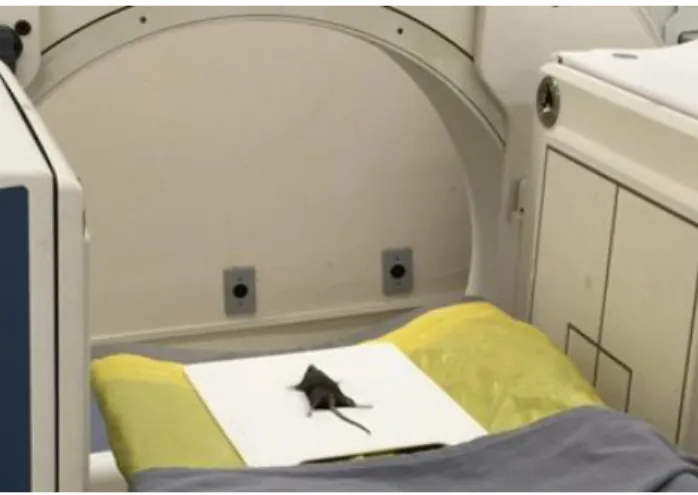
The mice were anesthetized with xylazine (15 mg/kg) and ketamine (80 mg/kg) intraperitone-ally. After anaesthesia, they were identified, weighed and immobilized so that they would not move during the images acquisition (Figure 1).
Figure 1: Mouse positioned and immobilized for planar and SPECT images acquisition.
Subsequently, the radiopharmaceutical 131I-Ixolaris was fractionated and administered intrave-nously, limited to a maximum volume of 0.2 ml [10]. CT imaging was used just to guide ROIs de-marcation (Optima PET/CT560®, animals in the supine position, 0.62 mm cuts, 140 Kv and 320 mAs). The fusion of the CT imaging with SPECT and planar imaging was performed using the Osi-rix® software [11], based on the alignment of the animal's contour. The molecular images of the mice were performed by two methods, Planar and SPECT as described in the table 1.
Table 1: Details about image acquisition.
Planar image acquisition SPECT image acquisition
Time of image 10 min
15 min (Acquisition circular: 32 projections with 28 seconds
each one)
Acquisition matrix 512 x 512 128 x 128
Zoom 2 4
Distance between detectors 105 mm 500 mm
Vertical distance of table 764 mm 803 mm
Collimator HEGP (High Energy General
Purpose) HEGP
Energy windows set up 364 ± 15% keV 364 ± 15% keV
Reconstruction -
Iterative reconstruction method OSEM / MLEM. Butterworth filter with 0.5 cut-off frequency
was applied [12].
The necessity to consider attenuation correction was tested by a transmission acquisition and the results demonstrated that there is no influence of attenuation of the mouse body (Figure 2). As the animal consists almost entirely of soft tissue, an assumption of uniform attenuation can be made through a post-processing tool, known as the Chang algorithm [13]. The overlapping of the organs was not performed, as there was no overlapping of the uptake organs. Corrections for partial volume effects, scatter and collimator response were not applied in this study.
Figure 2: Transmission image of the mouse performed with a 131I planar source.
To determine the calibration factor for 131I, 37 MBq (1 mCi) of this radionuclide were introduced in
a cylindrical phantom positioned above each detector and a planar image was acquired in order to accumulate 10,000 counts [14]. From this accumulated count, the time of image acquisition and the activity, the sensitivity of each detector was determined, expressed in count rate/MBq for planar and for SPECT imaging. For planar, the calibration factor for each corresponding detector was used, and for SPECT imaging the mean between the two detectors was applied.
The quantification was performed within regions of interest (ROI) positioned in specific organs for the time series described above.
The number of average counts and respective associated uncertainties within ROI selection was performed by using OsiriX® software for quantification. For the planar imaging the geometric method was used and for the SPECT imaging the sum each slice for each organ was performed. From the count observed, the retained activities in each organ or tissue were obtained in the time intervals using the calibration factor determined for 131I radionuclide. The time-integrated activity (Equation 1) was later corrected for mass (Equation 2) and metabolic factors (Equation 3) to consider differences between species, animals and humans [15]. These corrections are necessary
because smaller animals have fastest metabolism, so we cannot consider that human dosimetric data could be the same as the dosimetric data obtained to the studied mice. Therefore, there is a need for extrapolation data through an allometric scale [16].
(1)
(2) Where,
fmas is the mass factor; moh the human organ mass; mch the human body mass; moa the animal organ
mass; and mca the animal body mass.
Resulting in the equation 7 where fmet is the metabolic factor.
(3) For the calculation of mass and metabolic factor, the mice were weighed before and after the molecular images were performed, the animals were then sacrificed, and their organs were dissected and weighed.
Absorbed doses in each organ were calculated based on dose factors provided by the software IDAC 2.1. and the obtained organ accumulated activities [17]. The effective doses were estimated through radiation weighting factors (wR) and tissue or organ weighting factor (wT) provided by
ICRP 103 [18].
2.4. Uncertainty analysis
The activity meter uncertainty of 4% was determined from traceability and intercomparison with the National Metrology Laboratory of Ionizing Radiation (LNMRI) in Brazil. The uncertainty for the mice weight used in this study was 0.01% from the variation of decimal places during mouse weighing. The uncertainty associated with the sensitivity test was determined from the standard deviation of the sample, equal to 0.2%. The uncertainty associated with visual acuity during ROI delimitation was determined performing 10 different measures in the same region; it was noted a
10% variation between scores. Thus, the total uncertainty attributed to the absorbed dose was 10.77%.
2.5. Statistical analysis
Student's t-test was performed to validate the study. First, the null hypothesis was that there is no statistical difference between quantifications of target organs from planar and tomographic im-ages for the biokinetic quantities. However, this study focus attention on accumulated activity, ab-sorbed dose and S factor. Finally, the null hypothesis was that there is no statistical difference be-tween using only the mass factor and applying the mass factor in conjunction with the metabolic factor in a translational model.
3. RESULTS AND DISCUSSION
3.1. Animal Model
Seventeen mice administered 131I-Ixolaris were tested, 10 of which underwent only 1 therapy
cycle and 7 for 2 cycles. The 131I-Ixolaris radiopharmaceutical therapy procedure occurred at
differ-ent time intervals after tumour induction. Three mice were administered immediately after induc-tion so that there was competiinduc-tion between tumour development and non-development caused by immediate therapy. In this case it was expected to see small uptake or even no uptake in the lung, which would be the first metastatic melanoma pathway [19]. For mice that only went through one course of therapy, it occurred at different times after tumour induction: 8 days for 1 animal, 16 days for 8 animals, and 19 days for 1 animal.
For animals that underwent 2 cycles of therapy, the first phase of therapy (T1) occurred imme-diately after tumour induction and the second phase of therapy (T2) 8 days later for 3 animals; and finally, 8 days for T1 and 19 days for T2 after tumour induction for 4 animals.
The administered activities varied widely, from 1.07 MBq to 15.55 MBq due to the limitations of the 131I-Ixolaris radiopharmaceutical labelling. Since the maximum volume to be injected into a mouse was 0.2 ml, the specific activity of radiopharmaceutical labelling determined the subsequent administered activity, as show in Table 2.
In animal’s studies for each SPECT or planar imaging, one animal must be used to acquire im-ages at different times. This is a common methodology because they do not survive to multiple cy-cles of anesthesia since that causes pressure drop and hypothermia [20]. Only animals that were able to take at least three images were considered in this study.
Using the information about the weighing organs of interest in animals and according to ICRU [21], mouse bladder mass can be estimated to be 0.05 g (it could not be weighed because it is a very fragile organ that when full of urine bursts during dissection), the mass and metabolic factors were calculated (Table 3). The ICRP 110 reference man body mass was considered, total weight of 73 kg, liver mass 1.8 kg, lung mass 1.1 kg and bladder mass 0.2 kg [22].
Table 2: Mouse Identification and Therapy Information: AxTx index, where A corresponds to the
word Animal and x follows the cardinal numbering. T corresponds to the word Therapy and again x follows the cardinal numbering.
Animal Radiopharma- ceutical Number of therapy cycles Imaging method Time of radiopharmaceutical administration after tumour induction (days)
Administered Activity
(MBq)
A1 131I - Planar 8 1.07
A2 131I - Planar 8 1.51
A2T1 131I-Ixolaris 1 Planar 19 10.32
A3T1 131I-Ixolaris 1 Planar 1 3.61
A3T2 131I-Ixolaris 2 Planar 8 1.84
A4T1 131I-Ixolaris 1 Planar 1 4.42
A4T2 131I-Ixolaris 2 Planar 8 2.51
A5T1 131I-Ixolaris 1 Planar 1 3.65
A5T2 131I-Ixolaris 2 Planar 8 1.77
A6T1 131I-Ixolaris 1 Planar 8 1.55
A6T2 131I-Ixolaris 2 Planar 19 11.13
A7T1 131I-Ixolaris 1 Planar 8 1.55
A8T1 131I-Ixolaris 1 Planar 8 1.62
A8T2 131I-Ixolaris 2 Planar 19 12.71
A9T1 131I-Ixolaris 1 Planar 8 3.83
A9T2 131I-Ixolaris 2 Planar 19 8.22
A10T1 131I-Ixolaris 1 Planar 8 2.58
A10T2 131I-Ixolaris 2 Planar 19 7.55
A11T1 131I-Ixolaris 1 SPECT 16 9.88
A12T1 131I-Ixolaris 1 SPECT 16 9.58
A13T1 131I-Ixolaris 1 SPECT 16 9.40
A14T1 131I-Ixolaris 1 SPECT 16 8.14
A15T1 131I-Ixolaris 1 SPECT 16 8.44
A16T1 131I-Ixolaris 1 SPECT 16 10.94
A17T1 131I-Ixolaris 1 SPECT 16 10.94
A18T1 131I-Ixolaris 1 SPECT 16 7.51
A19 131I - SPECT 16 15.55
A20 131I - SPECT 16 15.92
Table 3: Mice body mass, mass factor and metabolic factor. Minimum Maximum Arithmetic
Mean
Standard Deviation
Mice body mass 20.7 g 30.4 g 25.4 g 3.1 g
Mice lung mass 0.15 g 0.30 g 0.21 g 0.04 g
Mice liver mass 1.01 g 1.67 g 1.27 g 0.22 g
Lung mass factor 1.34 3.41 2.05 0.53
Liver mass factor 0.41 0.59 0.50 0.09
Bladder mass
factor 1.10 1.59 1.39 0.17
Metabolic factor 7.00 7.76 7.34 0.23
Molecular images of mice were acquired after administration of the 131I-Ixolaris radiophar-maceutical. In three therapies (A3T1, A4T1 and A5T1), two images were performed for 1.8 ± 0.3 h and 70.7 ± 0.3 h each. The animals A1, A2, A3T2, A4T2, A5T2, A6T1, A7T1, A8T1, A9T1, A10T1,
A19, A20 and A21 had three images taken at 0.3 ± 0.1 h, 2.8 ± 0.4 h, and 17.7 ± 1.1 h. In nine
thera-pies (A2T1, A11T1, A12T1, A13T1, A14T1, A15T1, A16T1, A17T1 and A18T1) four images were performed at 0.6 ± 0.4 h, 3.1 ± 1.0 h, 6.2 ± 1.1 h and 22.1 ± 1.8 h. In four therapies (A6T2, A8T2,
A9T2 and A10T2) five images were performed at 1.3 ± 0.3 h, 2.3 ± 0.3 h, 3.1 ± 0.3 h, 4.0 ± 0, 3 h
and 25.4 ± 0.9 h.
3.2. 131I-Ixolaris Radiopharmaceutical Dosimetry
Animals that were administered with 131I-Ixolaris radiopharmaceutical presented wide varia-tion in the studied quantities due to some factors, such as: different administered activities, caused by the maximum volume limitation to be injected; due to the degree tumour development and pul-monary metastases; there is a strong contribution from the uncertainty of exponential adjustment of organ retention curves; and particularly because the bladder is a dynamic organ.
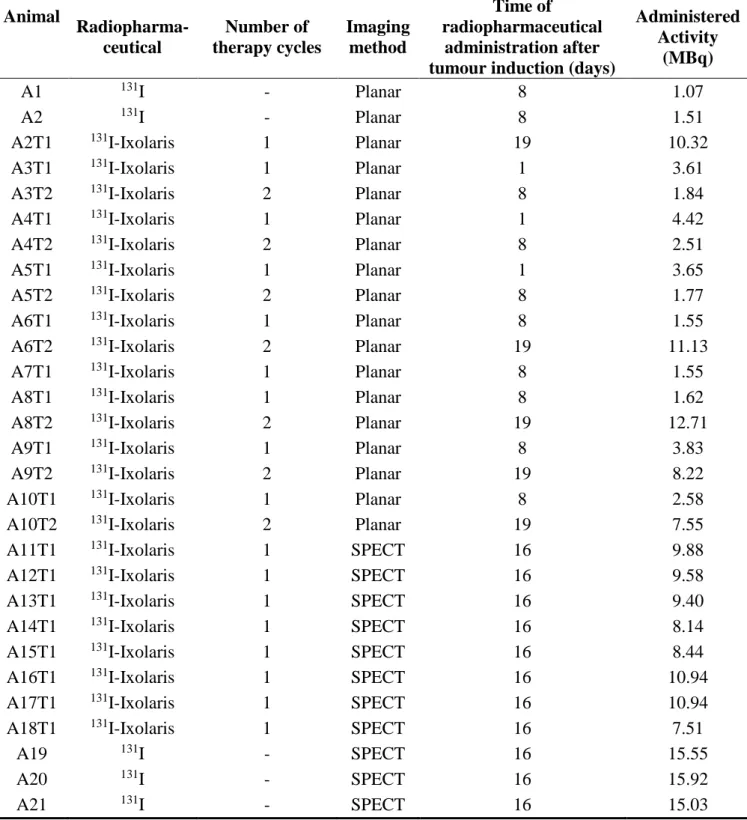
Table 4 presents the main quantities used for the dosimetric calculation from the molecular image’s quantification. Thetime-integrated activity is the first step to dosimetry calculation, being
that they present mono-exponential adjustment for each organ, for each animal. The adjustment provides a coefficient of determination, named R2, being a measure of statistical adjustment, which varies between 0 and 1, indicating how much the model can explain the observed values. The near-est value 1of R2, the better the model fits the sample. The R2 values obtained were in the interval between0,90868 and 0,99999.
Posteriorly the absorbed doses in each source organ are calculated (Table 4).
Table 4: Absorbed dose (mGy) to human after applying the translational model. Absorbed dose Image Min. Max. Arithmetic
Mean
Standard Deviation
Lung (male) Planar 2.32E-01 5.79E+00 6.82E-01 1.93E+00 SPECT 1.43E-01 1.81E+01 4.50E+00 4.65E+00 Lung (female) Planar 2.89E-01 7.23E+00 8.43E-01 2.41E+00 SPECT 1.78E-01 2.26E+01 5.61E+00 5.81E+00 Liver (male) Planar 9.15E-02 1.90E+00 2.40E-01 5.93E-01 SPECT 5.51E-02 7.25E+00 1.67E+00 2.10E+00 Liver (female) Planar 1.21E-01 2.39E+00 2.99E-01 7.38E-01 SPECT 6.85E-02 9.06E+00 2.08E+00 2.62E+00 Bladder wall
(male)
Planar 4.00E-04 2.94E+02 2.82E+01 7.26E+01 SPECT 2.74E+00 3.82E+02 1.15E+02 1.22E+02 Bladder wall
(female)
Planar 3.75E-04 3.57E+02 3.43E+01 8.83E+01 SPECT 3.32E+00 4.64E+02 1.40E+02 1.48E+02
The absorbed doses provided by IDAC 2.1. software using its male and female models are shown in Tables 5, 6, 7 and 8, for all organs.
BJRS
RADIATION SCIENCES
08-02 (2020) 01-22
ISSN: 2319-0612 Accepted: 2020-04-27
Table 5: Absorbed dose in male organs (mGy) estimated from planar images.
Organ A2T1 A3T1 A3T2 A4T1 A4T2 A5T1 A5T2 A6T1 A6T2 A7T1 A8T1 A8T2 A9T1 A9T2 A10T1 A10T2
Adrenals 2.71E-01 1.97E-02 2.94E-02 2.50E-01 3.49E-02 2.23E-01 2.53E-02 2.05E-02 2.58E-01 2.08E-02 3.37E-02 3.72E-01 3.32E-02 2.26E-01 6.21E-02 2.87E-01 Brain 2.62E-03 6.87E-04 9.22E-04 8.17E-03 1.05E-03 6.85E-03 8.50E-04 6.32E-04 1.08E-02 5.01E-04 1.22E-03 1.18E-02 9.89E-04 7.99E-03 2.09E-03 1.00E-02 Breast 9.48E-02 1.48E-02 2.05E-02 1.80E-01 2.36E-02 1.53E-01 1.86E-02 1.40E-02 2.23E-01 1.22E-02 2.61E-02 2.62E-01 2.23E-02 1.72E-01 4.55E-02 2.17E-01 Colon wall 6.00E-01 2.39E-02 3.58E-02 2.72E-01 4.06E-02 3.01E-01 2.55E-02 4.62E-02 4.64E-01 5.78E-03 2.72E-02 3.66E-01 3.80E-02 2.83E-01 7.64E-02 2.53E-01 Endosteum
(bone surface) 2.14E-01 1.11E-02 1.61E-02 1.27E-01 1.81E-02 1.31E-01 1.22E-02 1.87E-02 2.09E-01 3.58E-03 1.43E-02 1.73E-01 1.70E-02 1.31E-01 3.49E-02 1.28E-01 ET region 9.70E-03 2.77E-03 3.71E-03 3.29E-02 4.20E-03 2.75E-02 3.42E-03 2.53E-03 4.39E-02 2.00E-03 4.91E-03 4.74E-02 3.97E-03 3.22E-02 8.40E-03 4.04E-02 Eye lenses 3.07E-03 9.85E-04 1.31E-03 1.17E-02 1.48E-03 9.72E-03 1.22E-03 8.93E-04 1.57E-02 7.02E-04 1.75E-03 1.68E-02 1.40E-03 1.15E-02 2.98E-03 1.44E-02 Gallbladder
wall 6.52E-01 3.33E-02 5.32E-02 4.43E-01 6.47E-02 4.05E-01 4.42E-02 3.61E-02 3.71E-01 4.34E-02 5.68E-02 6.74E-01 6.18E-02 3.80E-01 1.08E-01 4.94E-01 Heart wall 1.82E-01 3.99E-02 5.41E-02 4.78E-01 6.16E-02 4.02E-01 4.96E-02 3.70E-02 6.21E-01 3.03E-02 7.06E-02 6.91E-01 5.83E-02 4.64E-01 1.22E-01 5.84E-01 Kidneys 1.96E-01 1.24E-02 1.87E-02 1.56E-01 2.22E-02 1.43E-01 1.57E-02 1.43E-02 1.68E-01 1.23E-02 2.04E-02 2.31E-01 2.11E-02 1.43E-01 3.93E-02 1.76E-01 Liver 1.90E+00 9.15E-02 1.48E-01 1.23E+00 1.82E-01 1.13E+00 1.23E-01 9.74E-02 9.54E-01 1.27E-01 1.57E-01 1.89E+00 1.74E-01 1.04E+00 2.98E-01 1.37E+00 Lung 7.52E-01 3.43E-01 4.52E-01 4.04E+00 5.08E-01 3.35E+00 4.22E-01 3.09E-01 5.57E+00 2.32E-01 6.11E-01 5.79E+00 4.80E-01 4.00E+00 1.04E+00 5.01E+00 Lymphatic
nodes 9.85E-01 4.76E-02 6.92E-02 5.39E-01 7.78E-02 5.72E-01 5.15E-02 8.47E-02 9.21E-01 1.22E-02 5.86E-02 7.28E-01 7.29E-02 5.64E-01 1.50E-01 5.30E-01 Muscle 1.86E-01 1.00E-02 1.45E-02 1.15E-01 1.64E-02 1.18E-01 1.11E-02 1.66E-02 1.87E-01 3.49E-03 1.32E-02 1.57E-01 1.54E-02 1.19E-01 3.16E-02 1.17E-01 Oesophagus 1.54E-01 3.17E-02 4.31E-02 3.80E-01 4.91E-02 3.20E-01 3.94E-02 2.94E-02 4.89E-01 2.44E-02 5.60E-02 5.50E-01 4.65E-02 3.68E-01 9.66E-02 4.63E-01 Oral mucosa 8.79E-03 2.25E-03 3.02E-03 2.67E-02 3.42E-03 2.24E-02 2.78E-03 2.07E-03 3.53E-02 1.65E-03 3.98E-03 3.86E-02 3.24E-03 2.61E-02 6.82E-03 3.28E-02 Ovaries 0.00E+00 0.00E+00 0.00E+00 0.00E+00 0.00E+00 0.00E+00 0.00E+00 0.00E+00 0.00E+00 0.00E+00 0.00E+00 0.00E+00 0.00E+00 0.00E+00 0.00E+00 0.00E+00 Pancreas 3.00E-01 1.79E-02 2.75E-02 2.30E-01 3.29E-02 2.10E-01 2.30E-02 2.00E-02 2.28E-01 1.97E-02 2.99E-02 3.44E-01 3.13E-02 2.06E-01 5.71E-02 2.58E-01 Prostate 3.57E+00 1.27E-01 1.90E-01 1.40E+00 2.12E-01 1.64E+00 1.27E-01 2.78E-01 2.71E+00 2.08E-04 1.24E-01 1.81E+00 1.98E-01 1.52E+00 4.07E-01 1.20E+00 Red (active)
bone marrow 3.88E-01 2.29E-02 3.29E-02 2.64E-01 3.72E-02 2.65E-01 2.58E-02 3.57E-02 4.17E-01 9.32E-03 3.14E-02 3.65E-01 3.50E-02 2.70E-01 7.17E-02 2.76E-01 Salivary
glands 9.35E-03 2.62E-03 3.50E-03 3.11E-02 3.97E-03 2.60E-02 3.23E-03 2.40E-03 4.14E-02 1.89E-03 4.64E-03 4.48E-02 3.75E-03 3.04E-02 7.94E-03 3.82E-02 Skin 7.60E-02 4.69E-03 6.74E-03 5.46E-02 7.66E-03 5.39E-02 5.36E-03 7.02E-03 8.31E-02 2.20E-03 6.63E-03 7.60E-02 7.20E-03 5.51E-02 1.47E-02 5.80E-02 Small
intestine wall 5.98E-01 2.34E-02 3.50E-02 2.64E-01 3.95E-02 2.95E-01 2.46E-02 4.65E-02 4.66E-01 4.26E-03 2.58E-02 3.52E-01 3.69E-02 2.78E-01 7.47E-02 2.42E-01 Spleen 9.59E-02 2.13E-02 2.87E-02 2.53E-01 3.26E-02 2.14E-01 2.62E-02 2.01E-02 3.36E-01 1.54E-02 3.73E-02 3.65E-01 3.08E-02 2.47E-01 6.47E-02 3.08E-01 Stomach wall 1.96E-01 1.87E-02 2.70E-02 2.32E-01 3.16E-02 2.04E-01 2.37E-02 1.90E-02 2.65E-01 1.74E-02 3.23E-02 3.42E-01 3.00E-02 2.16E-01 5.84E-02 2.72E-01 Testes 2.33E-01 8.32E-03 1.24E-02 9.15E-02 1.39E-02 1.07E-01 8.35E-03 1.81E-02 1.77E-01 4.71E-05 8.14E-03 1.19E-01 1.30E-02 9.95E-02 2.66E-02 7.88E-02 Thymus 8.72E-02 3.05E-02 4.05E-02 3.61E-01 4.57E-02 3.00E-01 3.76E-02 2.77E-02 4.89E-01 2.13E-02 5.42E-02 5.19E-01 4.32E-02 3.55E-01 9.23E-02 4.46E-01 Thyroid 4.48E-02 1.53E-02 2.04E-02 1.81E-01 2.30E-02 1.51E-01 1.89E-02 1.39E-02 2.45E-01 1.07E-02 2.72E-02 2.60E-01 2.17E-02 1.78E-01 4.64E-02 2.24E-01 Urinary 2.94E+02 1.05E+01 1.56E+01 1.15E+02 1.75E+01 1.35E+02 1.05E+01 2.29E+01 2.23E+02 4.00E-04 1.02E+01 1.49E+02 1.63E+01 1.25E+02 3.35E+01 9.88E+01
Organ A11 A12 A13 A14 A15 A16 A17 A18
Adrenals 1.32E+00 5.33E-01 8.44E-01 4.74E-01 1.64E-01 2.71E-02 1.08E-02 1.13E-02 Brain 3.76E-02 1.82E-02 1.75E-02 1.27E-02 5.92E-03 8.38E-04 2.98E-04 3.90E-04 Breast 8.63E-01 3.96E-01 4.48E-01 2.96E-01 1.27E-01 1.87E-02 6.91E-03 8.47E-03 Colon wall 1.04E+00 4.81E-01 5.66E-01 6.32E-01 1.24E-01 2.60E-02 7.84E-03 8.63E-03 Endosteum (bone surface) 4.99E-01 2.39E-01 2.49E-01 2.67E-01 6.65E-02 1.23E-02 3.79E-03 4.53E-03 ET region 1.51E-01 7.33E-02 6.92E-02 5.06E-02 2.39E-02 3.36E-03 1.19E-03 1.57E-03 Eye lenses 5.33E-02 2.61E-02 2.41E-02 1.78E-02 8.51E-03 1.19E-03 4.22E-04 5.60E-04 Gallbladder wall 2.54E+00 9.27E-01 1.83E+00 9.19E-01 2.77E-01 4.98E-02 2.11E-02 1.97E-02 Heart wall 2.23E+00 1.06E+00 1.08E+00 7.55E-01 3.44E-01 4.92E-02 1.78E-02 2.27E-02 Kidneys 8.12E-01 3.27E-01 5.23E-01 3.07E-01 9.87E-02 1.69E-02 6.63E-03 6.86E-03 Liver 7.25E+00 2.58E+00 5.36E+00 2.60E+00 7.68E-01 1.40E-01 6.06E-02 5.51E-02
Lung 1.81E+01 9.06E+00 7.77E+00 6.02E+00 2.97E+00 4.09E-01 1.43E-01 1.94E-01
Lymphatic nodes 2.05E+00 9.94E-01 1.01E+00 1.17E+00 2.70E-01 5.15E-02 1.54E-02 1.84E-02 Muscle 4.58E-01 2.19E-01 2.29E-01 2.39E-01 6.14E-02 1.12E-02 3.49E-03 4.18E-03 Oesophagus 1.78E+00 8.43E-01 8.73E-01 6.04E-01 2.72E-01 3.92E-02 1.42E-02 1.81E-02 Oral mucosa 1.23E-01 5.95E-02 5.77E-02 4.16E-02 1.93E-02 2.74E-03 9.78E-04 1.28E-03 Ovaries 0.00E+00 0.00E+00 0.00E+00 0.00E+00 0.00E+00 0.00E+00 0.00E+00 0.00E+00 Pancreas 1.24E+00 4.82E-01 8.31E-01 4.58E-01 1.45E-01 2.52E-02 1.02E-02 1.02E-02 Prostate 4.65E+00 2.30E+00 2.26E+00 3.43E+00 5.43E-01 1.27E-01 3.33E-02 3.81E-02 Red (active) bone marrow 1.08E+00 5.14E-01 5.42E-01 5.34E-01 1.47E-01 2.59E-02 8.30E-03 9.99E-03 Salivary glands 1.42E-01 6.93E-02 6.56E-02 4.79E-02 2.25E-02 3.18E-03 1.13E-03 1.48E-03
Skin 2.30E-01 1.08E-01 1.18E-01 1.09E-01 3.13E-02 5.41E-03 1.78E-03 2.12E-03
Small intestine wall 9.78E-01 4.60E-01 5.15E-01 6.19E-01 1.17E-01 2.50E-02 7.28E-03 8.13E-03 Spleen 1.16E+00 5.60E-01 5.50E-01 3.99E-01 1.81E-01 2.59E-02 9.24E-03 1.20E-02 Stomach wall 1.17E+00 5.01E-01 6.84E-01 4.15E-01 1.57E-01 2.47E-02 9.48E-03 1.07E-02 Testes 3.05E-01 1.51E-01 1.49E-01 2.24E-01 3.57E-02 8.36E-03 2.19E-03 2.50E-03 Thymus 1.64E+00 8.07E-01 7.28E-01 5.47E-01 2.64E-01 3.67E-02 1.29E-02 1.73E-02 Thyroid 8.22E-01 4.05E-01 3.67E-01 2.75E-01 1.32E-01 1.85E-02 6.50E-03 8.69E-03 Urinary bladder wall 3.82E+02 1.89E+02 1.85E+02 2.82E+02 4.47E+01 1.05E+01 2.74E+00 3.13E+00 Uterus/cérvix 0.00E+00 0.00E+00 0.00E+00 0.00E+00 0.00E+00 0.00E+00 0.00E+00 0.00E+00
Table 7: Absorbed dose in female organs (mGy) estimated from planar images.
Organ A2T1 A3T1 A3T2 A4T1 A4T2 A5T1 A5T2 A6T1 A6T2 A7T1 A8T1 A8T2 A9T1 A9T2 A10T1 A10T2
Adrenals 4.37E-01 2.73E-02 4.20E-02 3.54E-01 5.04E-02 3.18E-01 3.56E-02 2.87E-02 3.35E-01 3.18E-02 4.69E-02 5.32E-01 4.80E-02 3.13E-01 8.71E-02 4.03E-01 Brain 3.46E-03 9.69E-04 1.30E-03 1.15E-02 1.47E-03 9.62E-03 1.20E-03 8.88E-04 1.53E-02 6.99E-04 1.72E-03 1.66E-02 1.39E-03 1.13E-02 2.94E-03 1.41E-02 Breast 9.77E-02 2.05E-02 2.79E-02 2.46E-01 3.18E-02 2.07E-01 2.55E-02 1.90E-02 3.17E-01 1.57E-02 3.63E-02 3.56E-01 3.01E-02 2.38E-01 6.25E-02 3.00E-01 Colon wall 8.69E-01 3.18E-02 4.77E-02 3.54E-01 5.36E-02 4.08E-01 3.25E-02 6.72E-02 6.59E-01 2.47E-03 3.26E-02 4.65E-01 5.00E-02 3.80E-01 1.02E-01 3.12E-01 Endosteum
(bone surface) 2.52E-01 1.39E-02 2.01E-02 1.60E-01 2.27E-02 1.63E-01 1.55E-02 2.27E-02 2.58E-01 5.06E-03 1.85E-02 2.20E-01 2.13E-02 1.65E-01 4.38E-02 1.64E-01 ET region 1.30E-02 4.03E-03 5.37E-03 4.77E-02 6.07E-03 3.98E-02 4.97E-03 3.67E-03 6.41E-02 2.87E-03 7.14E-03 6.87E-02 5.74E-03 4.69E-02 1.22E-02 5.88E-02 Eye lenses 6.89E-03 1.57E-03 2.12E-03 1.87E-02 2.41E-03 1.58E-02 1.95E-03 1.48E-03 2.48E-02 1.15E-03 2.77E-03 2.70E-02 2.28E-03 1.83E-02 4.79E-03 2.29E-02 Gallbladder
wall 7.22E-01 3.73E-02 5.94E-02 4.95E-01 7.23E-02 4.51E-01 4.95E-02 4.02E-02 4.16E-01 4.85E-02 6.36E-02 7.53E-01 6.90E-02 4.25E-01 1.21E-01 5.53E-01 Heart wall 2.20E-01 5.29E-02 7.13E-02 6.31E-01 8.11E-02 5.29E-01 6.56E-02 4.86E-02 8.27E-01 3.95E-02 9.37E-02 9.12E-01 7.67E-02 6.15E-01 1.61E-01 7.73E-01 Kidneys 2.42E-01 1.44E-02 2.21E-02 1.84E-01 2.63E-02 1.69E-01 1.84E-02 1.66E-02 1.90E-01 1.51E-02 2.38E-02 2.74E-01 2.50E-02 1.66E-01 4.60E-02 2.06E-01 Liver 2.39E+00 1.14E-01 1.85E-01 1.53E+00 2.27E-01 1.40E+00 1.53E-01 1.21E-01 1.17E+00 1.60E-01 1.95E-01 2.36E+00 2.17E-01 1.29E+00 3.70E-01 1.71E+00 Lung 9.22E-01 4.29E-01 5.64E-01 5.04E+00 6.34E-01 4.17E+00 5.27E-01 3.85E-01 6.95E+00 2.89E-01 7.63E-01 7.23E+00 5.99E-01 5.00E+00 1.29E+00 6.26E+00 Lymphatic
nodes 5.22E-01 3.30E-02 4.70E-02 3.81E-01 5.31E-02 3.77E-01 3.73E-02 5.00E-02 5.98E-01 1.38E-02 4.61E-02 5.26E-01 4.99E-02 3.88E-01 1.03E-01 4.03E-01 Muscle 2.24E-01 1.23E-02 1.77E-02 1.41E-01 2.00E-02 1.44E-01 1.37E-02 2.01E-02 2.29E-01 4.38E-03 1.63E-02 1.93E-01 1.88E-02 1.45E-01 3.86E-02 1.44E-01 Oesophagus 1.78E-01 4.04E-02 5.46E-02 4.83E-01 6.22E-02 4.06E-01 5.02E-02 3.72E-02 6.27E-01 3.06E-02 7.15E-02 6.99E-01 5.88E-02 4.69E-01 1.23E-01 5.91E-01 Oral mucosa 1.41E-02 3.91E-03 5.23E-03 4.64E-02 5.92E-03 3.88E-02 4.83E-03 3.59E-03 6.19E-02 2.82E-03 6.92E-03 6.68E-02 5.60E-03 4.55E-02 1.18E-02 5.70E-02 Ovaries 2.45E+00 8.75E-02 1.31E-01 9.63E-01 1.46E-01 1.13E+00 8.78E-02 1.91E-01 1.86E+00 3.82E-04 8.56E-02 1.25E+00 1.36E-01 1.05E+00 2.80E-01 8.29E-01 Pancreas 2.92E-01 1.63E-02 2.53E-02 2.10E-01 3.03E-02 1.94E-01 2.10E-02 1.88E-02 2.07E-01 1.81E-02 2.70E-02 3.14E-01 2.88E-02 1.87E-01 5.22E-02 2.34E-01 Prostate 0.00E+00 0.00E+00 0.00E+00 0.00E+00 0.00E+00 0.00E+00 0.00E+00 0.00E+00 0.00E+00 0.00E+00 0.00E+00 0.00E+00 0.00E+00 0.00E+00 0.00E+00 0.00E+00 R/ed (active)
bone marrow 4.22E-01 2.79E-02 3.97E-02 3.24E-01 4.50E-02 3.16E-01 3.19E-02 4.07E-02 4.94E-01 1.31E-02 4.00E-02 4.51E-01 4.24E-02 3.28E-01 8.70E-02 3.48E-01 Salivary
glands 1.23E-02 3.63E-03 4.84E-03 4.30E-02 5.48E-03 3.59E-02 4.48E-03 3.31E-03 5.76E-02 2.59E-03 6.43E-03 6.20E-02 5.18E-03 4.22E-02 1.10E-02 5.30E-02 Skin 1.01E-01 6.27E-03 9.00E-03 7.29E-02 1.02E-02 7.20E-02 7.16E-03 9.39E-03 1.11E-01 2.90E-03 8.85E-03 1.01E-01 9.61E-03 7.37E-02 1.96E-02 7.73E-02 Small
intestine wall 9.25E-01 3.49E-02 5.23E-02 3.92E-01 5.90E-02 4.44E-01 3.63E-02 7.12E-02 7.03E-01 5.17E-03 3.73E-02 5.20E-01 5.52E-02 4.15E-01 1.12E-01 3.53E-01 Spleen 1.34E-01 2.22E-02 3.05E-02 2.68E-01 3.50E-02 2.28E-01 2.77E-02 2.13E-02 3.41E-01 1.74E-02 3.89E-02 3.88E-01 3.31E-02 2.58E-01 6.81E-02 3.23E-01 Stomach wall 2.47E-01 1.98E-02 2.92E-02 2.49E-01 3.44E-02 2.21E-01 2.53E-02 2.07E-02 2.70E-01 1.97E-02 3.39E-02 3.68E-01 3.27E-02 2.29E-01 6.22E-02 2.88E-01 Testes 0.00E+00 0.00E+00 0.00E+00 0.00E+00 0.00E+00 0.00E+00 0.00E+00 0.00E+00 0.00E+00 0.00E+00 0.00E+00 0.00E+00 0.00E+00 0.00E+00 0.00E+00 0.00E+00 Thymus 1.09E-01 3.94E-02 5.22E-02 4.65E-01 5.89E-02 3.87E-01 4.85E-02 3.57E-02 6.32E-01 2.74E-02 7.00E-02 6.68E-01 5.57E-02 4.59E-01 1.19E-01 5.75E-01 Thyroid 4.80E-02 1.69E-02 2.25E-02 2.00E-01 2.54E-02 1.66E-01 2.09E-02 1.54E-02 2.71E-01 1.18E-02 3.01E-02 2.88E-01 2.40E-02 1.97E-01 5.12E-02 2.47E-01 Urinary
bladder wall 3.57E+02 1.27E+01 1.90E+01 1.40E+02 2.12E+01 1.64E+02 1.27E+01 2.78E+01 2.71E+02 3.75E-04 1.24E+01 1.81E+02 1.98E+01 1.52E+02 4.07E+01 1.20E+02 Uterus/cervix 6.99E+00 2.49E-01 3.72E-01 2.74E+00 4.16E-01 3.21E+00 2.49E-01 5.44E-01 5.30E+00 3.86E-04 2.43E-01 3.55E+00 3.88E-01 2.98E+00 7.97E-01 2.35E+00
Organ A11 A12 A13 A14 A15 A16 A17 A18
Adrenals 1.94E+00 7.50E-01 1.31E+00 6.96E-01 2.28E-01 3.90E-02 1.60E-02 1.60E-02
Brain 5.27E-02 2.56E-02 2.43E-02 1.77E-02 8.35E-03 1.18E-03 4.18E-04 5.50E-04
Breast 1.15E+00 5.45E-01 5.61E-01 3.90E-01 1.76E-01 2.54E-02 9.18E-03 1.17E-02
Colon wall 1.24E+00 5.97E-01 6.28E-01 8.56E-01 1.45E-01 3.28E-02 9.02E-03 1.01E-02
Endosteum (bone surface) 6.42E-01 3.06E-01 3.21E-01 3.30E-01 8.66E-02 1.56E-02 4.90E-03 5.88E-03
ET region 2.18E-01 1.07E-01 9.88E-02 7.30E-02 3.48E-02 4.87E-03 1.72E-03 2.28E-03
Eye lenses 8.64E-02 4.16E-02 4.08E-02 2.95E-02 1.35E-02 1.92E-03 6.86E-04 8.89E-04
Gallbladder wall 2.83E+00 1.04E+00 2.04E+00 1.02E+00 3.10E-01 5.57E-02 2.36E-02 2.21E-02
Heart wall 2.93E+00 1.40E+00 1.39E+00 9.87E-01 4.56E-01 6.49E-02 2.33E-02 3.01E-02
Kidneys 9.74E-01 3.84E-01 6.44E-01 3.67E-01 1.15E-01 2.00E-02 7.98E-03 8.06E-03
Liver 9.06E+00 3.21E+00 6.74E+00 3.25E+00 9.54E-01 1.75E-01 7.59E-02 6.85E-02
Lung 2.26E+01 1.13E+01 9.68E+00 7.51E+00 3.71E+00 5.11E-01 1.78E-01 2.43E-01
Lymphatic nodes 1.56E+00 7.47E-01 7.67E-01 7.53E-01 2.17E-01 3.73E-02 1.20E-02 1.46E-02
Muscle 5.64E-01 2.69E-01 2.81E-01 2.92E-01 7.60E-02 1.37E-02 4.30E-03 5.16E-03
Oesophagus 2.25E+00 1.07E+00 1.08E+00 7.60E-01 3.48E-01 4.97E-02 1.79E-02 2.30E-02
Oral mucosa 2.13E-01 1.03E-01 9.80E-02 7.16E-02 3.36E-02 4.75E-03 1.69E-03 2.22E-03
Ovaries 3.21E+00 1.59E+00 1.56E+00 2.36E+00 3.75E-01 8.79E-02 2.30E-02 2.63E-02
Pancreas 1.14E+00 4.37E-01 7.72E-01 4.26E-01 1.31E-01 2.30E-02 9.34E-03 9.19E-03
Prostate 0.00E+00 0.00E+00 0.00E+00 0.00E+00 0.00E+00 0.00E+00 0.00E+00 0.00E+00
Red (active) bone marrow 1.36E+00 6.44E-01 6.84E-01 6.33E-01 1.89E-01 3.21E-02 1.05E-02 1.28E-02
Salivary glands 1.97E-01 9.60E-02 8.98E-02 6.61E-02 3.13E-02 4.40E-03 1.56E-03 2.06E-03
Skin 3.06E-01 1.44E-01 1.56E-01 1.45E-01 4.17E-02 7.21E-03 2.37E-03 2.83E-03
Small intestine wall 1.43E+00 6.73E-01 7.51E-01 9.34E-01 1.67E-01 3.69E-02 1.06E-02 1.17E-02
Spleen 1.27E+00 5.89E-01 6.39E-01 4.36E-01 1.89E-01 2.77E-02 1.01E-02 1.26E-02
Stomach wall 1.28E+00 5.32E-01 7.91E-01 4.61E-01 1.65E-01 2.68E-02 1.05E-02 1.13E-02
Testes 0.00E+00 0.00E+00 0.00E+00 0.00E+00 0.00E+00 0.00E+00 0.00E+00 0.00E+00
Thymus 2.11E+00 1.04E+00 9.33E-01 7.03E-01 3.40E-01 4.73E-02 1.66E-02 2.23E-02
Thyroid 9.07E-01 4.48E-01 4.03E-01 3.03E-01 1.46E-01 2.04E-02 7.17E-03 9.60E-03
Urinary bladder wall 4.64E+02 2.30E+02 2.25E+02 3.43E+02 5.43E+01 1.27E+01 3.32E+00 3.80E+00
BJRS
RADIATION SCIENCES
08-02 (2020) 01-22
ISSN: 2319-0612 Accepted: 2020-04-27
There are some factors that influence the fluctuation of the absorbed dose values. Among them, the administered activity of the drug, the degree of tumour development and the methodology of image acquisition. In order to assess the influence of the image acquisition method, statistical analysis was performed.
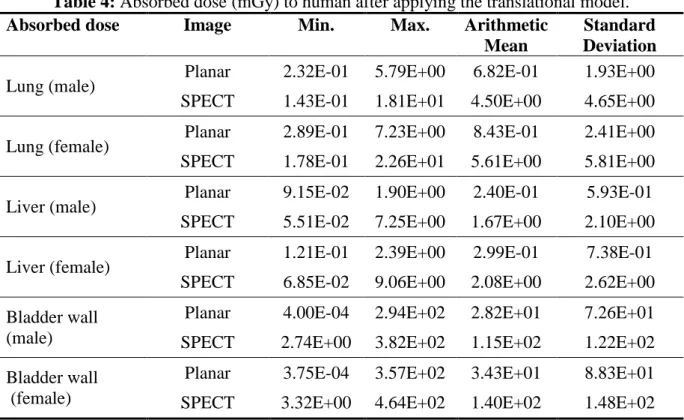
Hypothesis tests were performed to compare both image acquisition methodologies used here to estimate absorbed doses. The null hypothesis is the quantities estimate from planar and SPECT im-ages are equal. The Table 9 bellow shows the p-values provided by Student’s t-hypothesis.
Table 9: p-values provided by Student’s hypothesis Quantity
p – values
Lung Liver Bladder
Absorved dose (male) 0.08 0.06 0.16
Absorved dose (female) 0.08 0.06 0.16
Since p-values are greater than the significance level of 0.05, the hypothesis is therefore accepted. Thus, we can state that there is no statistically significant difference between the execu-tion of molecular images between the planar and SPECT modalities for the condiexecu-tions considered in this study.
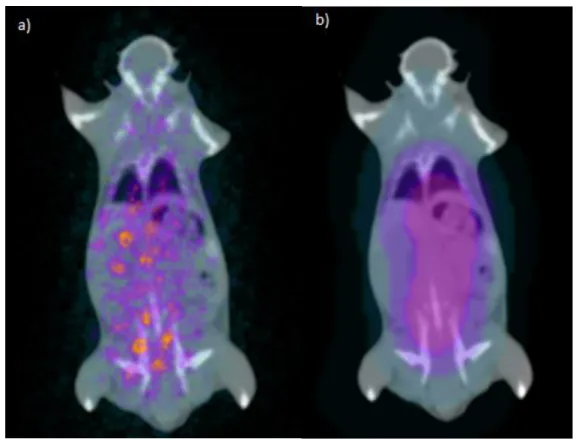
In addition to the statistical comparison between image acquisition protocols, there is the possibility of performing a visual analysis from Figures 3. It is worth mentioning that the images below are fused with the CT that attenuate the visual difference between them, however the planar image presents better quality to define ROIs. Finally, it is important to note that the planar image acquisition protocol is favorable when it comes to a preclinical study as it is possible to reduce the administered activity and reduce the image acquisition time. Although the tomographic image ac-quisition protocol provides greater imaging quality and organ localization in the image, it is neces-sary to increase the administered activity and the acquisition time, which results in more anesthetic for the animals and greater potential for death.
Finally, it must be emphasized that molecular images were taken with human equipment, which is not ideal, beyond absence of attenuation correction, overlapping of the organs correction, consideration of partial volume effects, scatter correction and collimator response. It is believed that this visual comparison can be changed in the case of the use of equipment dedicated to animals.
Figure 3: a) Tomographic image of the A14T1 mouse; b) Planar image of the A8T2 mouse.
4.
CONCLUSION
From the Student's t-hypothesis test performed in the accumulated activity, absorbed dose and S-factor results, there is no statistically significant difference between performing the image dosimetry from the SPECT and planar acquired images in this case.
For the study carried out here, the preference for performing image acquisitions in planar protocols can be chosen, according to the conditions of the statistical analysis presented. n addition, these protocols make acquisitions faster, contributing to the animal's survival for new cycles of therapy, improving dosimetry evaluation. Certainly, in a study of the radiopharmaceutical
131I-Ixolaris in human therapy, the methodology must be revised and improved when conducting
clinical studies. Currently, pre-clinical studies carried out in the country are performed only by the death of a group of animals at different times after injection and uptake estimates in each organ by dissection and counting, leading to large quantification errors. In addition, only the mass scale has been considered, and the allometric scale has not been used. This study aimed to contribute to the improvement of this method, leading to making it feasible in routine pre-clinical studies.
ACKNOWLEDGMENT
This work was supported by the Nuclear Energy National Commission (CNEN), which provided a scholarship.
REFERENCES
[1] AGÊNCIA NACIONAL DE VIGILÂNCIA SANITÁRIA. Resolução – RDC n° 64 –
Dispõe sobre o Registro de Radiofármacos, Brasil, 2009.
[2] GERDEKOOHI1, S., VOSOUGHI1, N., TANHA, K. Implementation of absolute quantifi-cation in small-animal SPECT imaging: Phantom and animal studies. Medical Imaging, 2016.
[3] ZAIDI, H. Quantitative Analysis in Nuclear Medicine, Switzerland, Springer, 2006. [4] BIANCARDI, R. Protocolo para adaptação de técnicas de dosimetria interna para
planejamento de doses individualizadas de 131I em pacientes pediátrico. Instituto de
Radioproteção e Dosimetria – IRD/CNEN, Brasil, 2011.
[5] MATHER, S. Molecular Imaging with Bioconjugates in Mouse Models of Cancer.
Ameri-can Chemical Society, v.20(4), 2009.
[6] SORIANO, S.C.S., SOUZA, S.A.L., BARBOZA, T. e DE SÁ, L.V., 2019. Preclinical do-simetric evaluation of Ixolaris labeled with 99mTc and Translational Model. Braz. J. Rad.
[7] FRAKER P.J., SPECK J.C. Protein and cell membrane iodinations with a sparingly soluble chloroamide, 1,3,4,6-tetrachloro-3a,6a-diphenylglycoluril. Biochem Biophys Res
Com-mun, v.80(4), p.849–57, 1978.
[8] KAMESWARAN M., SARMA HD., DASH A. Preclinical evaluation of131I-Bevacizumab – A prospective agent for radioimmunotherapy in VEGF expressing cancers. Appl
Radiat Isot. Elsevier Ltd. v.123, p.109–13, 2017.
[9] ÜNAK T., AKGÜN Z., YILDIRIM Y., DUMAN Y., ERENEL G. Self-radioiodination of iodogen. Appl Radiat Isot, v.54(5), p.749–52, 2001.
[10] UNIVERSITY OF COLORADO DENVER. Guidelines for Fluid Administration and Blood Collection.
[11] https://www.osirix-viewer.com/
[12] SORIANO, S.C.S., SOUZA, S.A.L., BARBOZA, T. e DE SÁ, L.V. The image recon struction influence in relative measurement in SPECT / CT animal. Brazilian Braz J
Rad Sci, 2018.
[13] GE MEDICAL SYSTEMS. Nuclear Medicine-Millenium MG Operator's Reference
Manual Includes Genie Acquisition. Version 4.5 Direction 2412348-100 Re vision 4, 2007.
[14] IAEA - International Atomic Energy Agency. TECDOC-602- Quality control of
nuclear medicine instruments. Vienna: IAEA, 1991.
[15] MCPARLAND, B.J. Nuclear Medicine Radiation Dosimetry - Advanced Theoretical
Principles. 1st ed. Springer, 2010.
[16] STABIN, M.G. Fundamentals of Nuclear Medicine Dosimetry. USA, Springer, 2008. [17] ELVAS, VANGESTEL, C., RAPIC, S. Characterization of 99mTc- Duramycin as a
SPECT Imaging Agent for Early Assessment of Tumor Apoptosis. Mol Imaging Biol, 2015.
[18] ICRP - International Comission on Radiological Protection. ICRP Recommendations
of the International Commission on Radiological Protection - ICRP Publication 103, 2007.
[19] BARBOZA, T.; GOMES, T.; MIZURINI, D. 99mTc-ixolaris targets glioblastoma-associated tissue factor: In vitro and pre-clinical applications. Thrombosis Research, v. 15, p. S0049, 2015.
[20] PICOLLO, C; SERRA A.J.; LEVY, R.F. Hemodinamic and thermoregulatory effects of xylazine-ketamine mixture persist even after the anesthetic stage in rats. Arq Bras Med
Zo-otec, vol.64, no.4, 2012.
[21] ICRU - International Commission on Radiation units and Measurements. Receiver
Operating Characteristic (ROC) Analysis in Medical Imaging – ICRU Publication 79. ICRU, 2008.
[22] ICRP - International Commission on Radiological Protection. Adult Reference