The Moderating Effect of the Sector’s Level of
Concentration on the Relationship Between Balance
Sheet Composition and the Firm’s Competitive
Advantage
Luiz Claudio Louzada 1,†
1 Universidade Federal do Espirito Santo-UFES, Vitória, ES, Brazil Márcio Augusto Gonçalves 2,Ω
2 Universidade Federal de Minas Gerais-UFMG, Belo Horizonte, MG, Brazil
1. Introduction
Issues related to performance study are part of the strategy and
ac-counting study fields, which differ in the focus of interest and the unit of analysis. While strategy focuses on the analysis of choices, decisions and resources in the firm’s environment, aiming to relate the firm’s com
-petitive advantage to the characteristics of its environment (Rumelt, Schendel & Teece, 1991), accounting provides financial, operational, and economic metrics that, combined, are designed to measure firm performance from an ex post facto perspective (Penman, 2009), but which allows the support or repositioning of managers’ choices and decisions in the use of their resources (O’connor, Deng & Fei, 2015).
The study of the origin of competitive advantage (endogenous or exogenous) is based on theoretical arguments in the context of indus -trial organization and the resource theory. In an endogenous
dimen-sion, it can be configured as resources available to the firm and evi
-denced by metrics contained in the structure of the financial statements
Corresponding author:
† Universidade Federal do Espirito Santo-UFES,
Vitória, ES, Brazil.
E-mail: [email protected]
Ω Universidade Federal de Minas Gerais-UFMG,
Belo Horizonte, MG, Brazil E-mail: [email protected]
Received: 08/07/2017. Revised: 02/06/2018. Accepted: 03/01/2018. Published Online: 09/03/2018.
DOI: http://dx.doi.org/10.15728/bbr.2018.15.6.1
ABSTRACT
This paper investigates the relationship between the competitive advantage and balance sheet composition of the firm, based on metrics contained in the structure of financial statements, from endogenous origin (firm’s balance sheet composition) or exogenous (level of sector concentration). In addition, we perform tests in order to verify whether the exogenous characteristics moderate the relation between endogenous characteristics and the firm’s operational performance. We selected data from the Economatica® database, a Brazilian company specialized in information for the capital market. We based the tests on the hierarchical model approach with repeated measures involving serial and nested regressions, estimated by maximum likelihood. The test results suggest that (i) the firm’s idiosyncratic features have greater explanatory capability for the firm’s performance than the industry features; (ii) the relation between firm idiosyncratic resources and firm performance are sensitive to industry characteristics.
Keywords: competitive advantage; decomposition of operational perfor-mance; level of concentration; structure-conduct-perforperfor-mance; resource theory.
This work licensed under a Creative Commons Attribution 4.0 International License.
BBR
15,6
513
composition as subgroups that are financial, operational, from structure and origin of fi
-nancing (as proxies of competitive advantage, in a dimension of firm resources). We can also find it in an exogenous dimension, from environmental characteristics (sector’s level of competition) in which the firm is inserted, which suggests having an effect on the firm’s performance. In addition, the relationship of coexistence between firm and environment suggests the existence of a moderating effect of the characteristics of the environment on the relationship between resources and operational performance of the firm.
Therefore, in assuming that economic and financial information are the main references for decision-making in the context of the firm and, considering the financial statements as one of its main sources (Healy & Palepu, 2001, Penman, 2009), it is relevant for us to study the relationship between competitive advantage and the firm’s balance sheet composition from the use of metrics contained in the structure of the financial statements.
We assume in this context that the firm’s strategic choices influence the nature and com
-position of its assets (through the choice of resources and the source of its funding), combi
-ned with the effects that environmental characteristics have on the firm, both are evidenced in the balance sheet and financial statements. In the course of this research, we will try to answer the following question: Does the operational performance receive greater influence from characteristics specific to the firm or the sector of which it is inserted? And, what is the moderating effect of the level of competition in the relationship between the balance sheet composition and the firm’s competitive advantage? When we monitor them from proxies contained in the financial statement structure.
This research investigates the relationship between the dimensions of competitive ad
-vantage (endogenous and exogenous to the firm) and the firm’s operational performance, and how the level of competition moderates the relationship between the balance sheet composition and the firm’s operating performance. In order to meet such propositions, we objectively investigate the following aspects: whether the operational performance has gre
-ater influence of factors endogenous or exogenous to the firm; how the relationship betwe
-en the balance sheet composition and the firm’s performance is moderated by the sector’s concentration level.
Berry and Jarvis (1994) state that the approximation between these fields contributes to the identification of accounting metrics and their use as proxies of the competitive advan
-tage. Misangyi, et al. (2006) corroborate this idea, and emphasize that the analysis of the accounting information, combined with the context in which the firm is inserted, allows the analyst to make more accurate forecasts about the firm’s performance. The identification of firm-specific or industry-specific factors and their effects on performance not only provide an understanding of the reflection that the strategy has on the firm’s performance, but from the practical point of view, can contribute substantially to the study of performance, since they enable managers to focus their attention on those determinants of greater relevance for generating and sustaining firm performance (Bowman & Helfat, 2001; Misangyi, et al., 2006).
The results of this study suggest that the firm’s idiosyncratic capabilities have a greater explanatory capability of the operational performance than the characteristics of the envi
-ronment in which the firm is inserted. And, that the relationship between the idiosyncratic resources of the firm and its operational performance are moderated by characteristics of the sector where the firm is inserted. Thus, to relate concepts of the firm’s competitive ad
BBR
15,6
514
2. Theoretical Framework
Strategic management researchers who investigate their theoretical and applied relevan
-ce from the perspective of determinants of firm performan-ce, are based on two theoretical, competing and complementary strands. They base these strands on the structure of the sector and the idiosyncratic characteristics of the firm as a source of performance, which combined lead to a debate in the literature on the relative importance of firm and sector on performance formation. Since the seminal studies by Schmalensee (1985) and Rumelt (1991) on this matter, several scholars entered the debate, such as Roquebert, Phillips and Westfall (1996), Adner and Helfat (2003), Bowman and Helfat (2001), Brush and Bromiley (1997), Brush, Bromiley and Hendrickx (1999), McGahan and Porter (1997) and Misangyi, et al., (2006).
Competitive advantage is the central theme of the strategy field and one of the most used hypotheses to explain the heterogeneity of performance amongst firms. It originates in ma
-nagement practice and consulting (South, 1981) and its development driven in conjunction with the evolution of strategy in the academic environment, thus developing a formal and scientific approach, highlighting in the most relevant discourses in the disciplines of strate
-gy (Brito & Brito, 2012).
Several authors investigate the firm-industry relationship, focusing on the level of con
-centration used as a measure of market competition, highlighting, amongst them: Porter (1979), Lawless and Finch (1989), Nissan (1990), Castrogiovanni (1991), Goll and Rasheed (1997), Thompson and Formby (2002), Simerly and Li (2000), Besanko, et al., (2006), Almeida (2010) and Ribarczyk and Oliveira (2013). We verify a dense base in research that use proxies of characteristics of the sector such as effect of the competition to verify the existence of causal relation with the performance of the firm.
Byrns and Stone (1996) claim that market structures almost rigidly determine the con
-duct of each firm (pro-duction decision and price behavior); which generates an overall performance of the sector (efficiency and profitability). Such an approach is termed the Structure-Conduct-Performance paradigm.
The essence of the Industrial Organization paradigm is to relate firm performance with variables dependent on the characteristics of the environment to which the firm is exposed (Porter, 1983). Thus, the structure of the sector determines the firm’s behavior, whose set of strategies determines the collective performance of the firms in their sector. Performance is defined, in general, towards economic measures, covering dimensions such as profitability, technical efficiency (cost minimization). The conduct consists of choosing the firm to use
its resources.
The resource theory, on the other hand, is based on two empirical generalizations and two postulates, which are: empirical generalizations: there are systematic differences be
-tween firms as to how they control the resources needed to implement their strategies, with such differences being relatively stable; and postulates: the differences in resource endo
-wments cause differences in performance and firms have a constant practice to maximize economic performance (Penrose, 1959, FOSS, 1996).
In comparing these theoretical approaches, we can observe, in theories of industrial organization, that in the arguments that underpin the concept of strategy, the factors exo
-genous to the firm remain, emphasizing the environment in which it operates and the in
-fluence that such an environment has on operational performance. On the other hand, the resource theory relates to factors endogenous to the firm, in the search for fundamentals for the configuration of the competitive advantage, in addition to emphasizing the need of integration between the firm and its environment.
BBR
15,6
515
precedent construct of superior performance (Wiggins & Ruefli, 2002, Powell, 2003, Vasconcelos & Brito, 2004).
Therefore, the firm’s behavior can be seen as the economic and technical dimensions of the strategies adopted by firms (Bain, 1964), as evidenced in the balance sheet composition, considered as management effects on the choice and use of assets (resources available to the firm). The industrial structure, however, is defined as relatively stable economic and technical dimensions that determine the context in which competition occurs (Porter, 1983, Caves, 1984). Consequently, it is evidenced in the firm’s balance sheet composition, ope
-ning new possibilities for research and approximations between these fields, converging to advances in the study of firm performance.
2.1. Sector characteristic and the Herfindahl-Hirschman
In-dex
The most significant market dimensions, which the economic theory identifies, when combined, characterize the different market structures (Esho, Kofman & Sharpe, 2005).
These structures are models that capture aspects inherent in the organization of markets.
Each market structure highlights some key aspects of the interaction of supply and demand, and is based on hypothesis of characteristics observed in existing markets. This enables us to classify the markets in different types, from their dimensions and the interaction between buyers and sellers (Stiglitz, 2003).
We use the herfindahl-hirschman index to measure market concentration, which allows investigating the level of competition in the product market and its impact on the competi
-tors’ operational decisions (Ranieri, 2011).
We calculate this index considering the sum of the squares of all the revenues of the firms in their industries or of the market share that we will analyze (Besanko et al., 2006, Kupfer & Hasenchever, 2013) and thus we describe:
(1)
wherein
(2)
In which represents the participation of each firm in the industry as a concentration me
-asure; and M represents the number of firms in the industry. The index is composed from and can have as variables the quantities produced, the quantities sold, and the size of the assets, revenue or any other economic variable that may represent the firm’s market share (Ranieri, 2011).
For the different market configurations, a key measure for the aggregate interpretation of the structure in the industry we are analyzing is the measurement of concentration indexes (Kupfer & Hasenclever, 2013, Esho, Kofman & Sharpe, 2005). The level of competition influences the firm’s performance. On the other hand, the firm has its particular ways of de
BBR
15,6
516
2.2. Metrics of Financial Statements and Measurement of
Wealth
In the pursuit of its goals of generating information that is useful for decision making, accounting supports its theoretical framework on its Entity and Continuity Postulates. While the Entity Postulate is intended to identify the assets of the firm so that it is possible to follow its variation over time, the Postulate of Continuity assumes that the firm is not in a state of discontinuity. These postulates support the framework of the theoretical field of accounting and guide the measurement of the variation of balance sheet composition and firm performance (Scott, 2009).
If accounting postulates are defined as assumptions derived from the economic envi
-ronment, which underpin the theoretical framework of accounting, influencing the form of measurement, configuration and information contained in its reports, then the financial sta
-tements should be able to reflect the aspects of the firm’s strategy, since both the theories of strategy and the theories contained in the framework of accounting evidence, in its peculiar forms, that the continuity of the firm presupposes profitability and sustainability over time. It is at this point that the accounting postulates seem to keep an alignment (approximation) with the premises of the conceptual framework of strategy and competitive advantage in the context of the firm in its environment.
Therefore, it is reasonable to expect that the decisions taken in the firm can be observed in the information contained in the financial statements, by means of events and facts that show the changes occurred in the balance sheet composition and its results, in the course of time and, thus, evidence the economic effects of the firm (Rutherford, 2013). In this context, the firm can be understood as a unit that makes economic decisions aimed at the achievement of profit through the exploitation of its resources in the context of the sector.
3. Developing the Research Hypotheses
Given that the choices made by managers are captured by the accounting model in the balance sheet structure in the form of financial and operational assets, structure and source of funding, we adopt subgroups of the balance sheet composition as proxies of endogenous variables, thus, we can explain the firm’s operational performance.
On the other hand and in a complementary way, the characteristics of the environment in which the firm is inserted as we adopt differentiated levels of competition as proxy of exogenous variables to explain the firm’s operational performance, allowing to investigate the following hypothesis:
H1: Endogenous factors (characteristics of the firm) explain the composition of ope
-rational performance better than by exogenous factors (characteristic of the environment where the firm is inserted), when monitored by proxies contained in the financial statements
structures.
Given the existence of a relationship between theoretical strands in the formulation of this hypothesis, which suggest that idiosyncratic factors combined with the environment in which the firm is inserted, and considering the existence of environmental effect in the firm, the following moderating hypothesis is formulated:
H2: The level of competition of the sectors (variables exogenous to the firm) moderates the relation between patrimonial composition (endogenous sources of competitive advan
-tage) and the firm’s operational performance.
BBR
15,6
517
4. Methodology and operationalization of variables
We use the hierarchical models approach with repeated measures, which involve serial and nested regressions, estimated by maximum likelihood. In order to estimate the relative importance of the sector and the firm as a source of competitive advantage, the variables as
-signed to the sector’s level of competition will be treated as moderators in the relationships between balance sheet composition and firm performance.
The advantages of using hierarchical models are identified by Raudenbush and Bryk (2002). According to these researchers, the use of these models: (i) allows to identify gro
-wth curves for each individual; (ii) identifies the absence of restrictions on repeated measu
-res at different intervals; (iii) enables the modeling of covariance between repeated measu
-rements; (iv) validates the use of the F-test and t-test, even if the data is unbalanced and (v) allows the inclusion of different levels of influence on the dependent variable.
In ignoring the existence of hierarchy in the data that can evidence possible dependence of the lower levels (firm) in relation to higher levels (industry) inevitably tends to produce biased results and conclusions, generating a distorted and fragmented view of the expected results (Nielsen & Nielsen, 2013).
4.1. Dependent Variables
The organizational performance construct plays a central role in the strategy
litera-ture (Rumelt, Schendel & Teece, 1991) and has different dimensions (Venkatraman & Ramanujam, 1986). Based on an analysis of articles published in the Strategic Management Journal between 1980 and 2004, we identify three distinct dimensions of organizational performance: accounting ROI, growth and change in market value (Combs, Crook & Shook, 2005).
With regard to the organizational performance dimension, Combs, Crook and Shook (2005) recommend ROA (Return on Assets) and ROS (Return on Sales) as reliable indica
-tors. Our study follows the proposal of these authors, using a variant of ROA as in Hough, (2006), Misangyi et al., (2006); Goldszmidt (2010), excluding the effect of interest and taxes, termed as return on invested capital (ROIC), as proposed by Simons (1999).
4.2. Independent Variables
The independent endogenous variables seek to highlight the balance sheet composition of subgroups in relation to the total assets of the firm, which we adopt as resource proxies inherent to the firm. However, given the limited capacity to measure the accounting model of firm resources, this metric is restricted to the resources that the logic of the accounting model can measure. Thus, the variables endogenous to firm, balance sheet composition, inserted in the model under study as proxies of the firm’s resources are: Financial Current Assets (CA); Operating Current Assets (OA); Long-Term Asset (NCR); Permanent Assets (PA); Financial Current Liabilities (CL); Operating Current Liabilities (OL); Long-Term Liabilities (LTL); and Net Equity (NE).
We define the balance sheet composition based on the vertical analysis. It consists on scale classification to identify aspects pertinent to the activity of the firm. And how the ver
-tical analysis of the statements identifies unusual aspects, when compared between firms or over time (Penman, 2010a; Penman, 2010b).
The exogenous independent variables are variables that capture characteristics of the sector in which the firm is inserted, the herfindahl-hirshmann index (HHI) shows the diffe
-rent levels of concentration of the sector.
BBR
15,6
518
of the environment exert on the ability to explain the firm’s performance. In addition, we will use such variables to investigate the moderating effect that these characteristics exert on the relation between resources and the operational performance.
5. Proposed Models
We can use hierarchical models used whenever analysis objects are nested in a context, as in this case in which firms are inserted in sectors of activity. Thus, it allows the objects and the contexts to be organized in hierarchical levels where we see the first level (time); on the second level with objects (firms); and a third level with context (industries) (Bickel, 2007, Goldszmidt, 2010).
We formalized the model in the equations. With it being estimated in stages: Model I: Null model; Model II: Model with linear trend of random effects; and Model III: Model with linear trend of random effects inserting a proxy with moderating effect.
The analysis of hierarchical models occurs in phases, and the first is the estimation by a null model, so called, by using only the intercept and allowing to verify, from its estima
-tion, the portion of the variance in each firm, between firms and between sectors. We will analyze the effects of these different levels using the null model, which is composed of the following set of equations:
Model I – Null model
In the model below (II), we included a trend component (variation over time) in level 1, with the purpose of verifying that the operating return of the firm follows a linear time trend. And by including random effects, we seek to test whether there is significant variance in the trend of operating return between firms over time.
Assuming that different firms present different operating returns, we develop the model with random trends and effects (Model II).
(3)
Level 1 (time)
ROICijk: performance represented operating return, in the period (quarter) i: 1,2..., Ijk; of the firm j: 1,2..., Jk; in sector k: 1,2..., K;
π0jk: expected operating return (mean) of the firm ij in the period 1 (1998); and
eijk : variance of the operating return observed of firm j in period i, in relation to its operatio -nal performance.
Level 2
(firm) βr0jk00k: variance of the operating return of firm : average expected operating return of firms in 1998, in sector j, to the expected from firms in sector k; and k. Level 3
BBR
15,6
519
Model II – Model with linear trend of random effects
Therefore, we insert predictor variables in the estimation model, whose results will be compared with the previous model, in order to explain the final model, in terms of the va
-riance of the studied variables.
We insert the variables that represent balance sheet subgroups at the firm level, with the inclusion of a trend effect in relation to the operating return of firm (j), in sector (k) with fixed effects over the study period, thus being represented:
(4)
Level 1 (time)
ROICijk: performance represented operating return, in the period (quarter) i: 1,2..., Ijk; of the firm j: 1,2..., Jk; in the sector k: 1,2..., K;
π0jk: expected operating return (mean) of the firm ij in the period 1 (1998); π1jk: growth rate of the operating return of firmjk ;
trim: inclusion of the effect of the trend in the operating return is effected by inserting the quarter variable; and
eijk : variance of the operating return observed of firm j in period i, in relation to its opera -tional performance.
Level 2 (firm)
β00k: average expected operating return of firms in 1998, in sector k; and; β10k: average growth rate expected in sector k; and
r0jk: variance of the operating return of firm j, to the expected from firms in sector k. Level 3
(industry) γu00000k: expected operating return of the sector in 1998 (sample mean); and: variance of the operating return of sector k in relation to the sample mean in 1998.
Model III – Model with linear trend of random effects inserting accounting proxies.
We organized the hierarchical models defined as nested models, allowing a comparison between the results presented by the defined models, which in addition, enables us perfor
-ming an incremental analysis in order to estimate the relative importance of the firm and sector to the study of the source of competitive advantage. Moreover, the variables we attribute to the sectors will be modeled as a moderating effect between resource variables and firm operational performance.
BBR
15,6
520
6. Descriptive Statistics
We selected firms from all sectors of the Bovespa (except for banks and funds, software and data and sectors denominated “other”) and then we grouped these firms according to the classification of the North American Industry Classification System (NAIC), excluding from the samples those that did not present at least one of the following data defined in the
model.
We extracted the sample from the database of Economatica®, a company specialized in information for the capital market, referring to the companies that had their accounting sta
-tements published in the period from January 1998 to September 2016, in quarterly periods. After generating these metrics to treat the extreme observations of the sample, the outliers, we used winsorized variables. In this study, we adopted p=0.01, i.e., we considered 2% of the variables as extreme, we generated the descriptive statistics of the sample, containing 20,018 observations (table 1).
In the descriptive analysis of the endogenous variables, we verify that the balance sheet composition presents the following mean in the general sample: Financial Current Assets (9%); Operating Current Assets (21%); Long-Term Assets (13%) and Permanent Assets (57%), and for the composition of liabilities and net equity it was represented wi
-th: Financial Current Liabilities (16%); Operating Current Liabilities (13%); Long-Term Liabilities (31%); and Net Equity (25%), with the variables ROIC, Net Equity and Long-Term Liabilities presenting more significant standard deviations, with their values being 5.37; 3.39; 1.49, respectively.
The coefficients of variation were representative, a factor that suggests that the data of the sample are quite dispersed. Thus, we also perform the analysis by the median to identify the most representative values of each variable and we verify that Financial Current Assets (3%); Operating Current Assets (17%); Long-Term Asset (7%) and Permanent Assets (58 and for the composition of liabilities and net equity it was represented with: Financial Current Liabilities (7%); Operating Current Liabilities (10%); Long-Term Liabilities (13%); and Net Equity (53%).
Level 1 (time)
ROICijk: performance represented operating return, in the period (quarter) i: 1,2..., Ijk; of the firm j: 1,2..., Jk; in the sector k: 1,2..., K;
π0jk: : expected operating return (mean) of the firm ij in the period 1 (1998); π1jk: growth rate of the operating return of firmjk ;
trim: inclusion of the effect of the trend in the operating return is effected by inserting the quarter variable; and
eijk : variance of the operating return observed of firm j in period i, in relation to its operatio -nal performance.
Level 2 (firm)
β00k: average expected operating return of firms in 1998, in sector k; and; β10k: average growth rate expected in sector k;
"BP" : predictive variable, capturing the relationship between balance sheet group (BP) with the trend of the operating return of firm (i) in sector (k), with the regressions being performed for each balance sheet subgroup: Financial Current Assets (CA); Operating Current Assets (OA); Long-Term Asset (NCR); Permanent Assets (PA); Financial Current Liabilities (CL); Operating Current Liabilities (OL); Long-Term Liabilities (LTL); and Net Equity (NE); r0jk: variance of the operating return of firm j, to the expected from firms in sector k;
Level 3 (industry)
γ000: expected operating return of the sector in 1998 (sample mean);
ST: inclusion of the sector's characteristics are inserted separately to verify the herfindahl --hirshmann index (HHI), with the purpose of verifying the sector’s level of concentration (k); and
BBR
15,6
521
Therefore, when comparing the means and medians, all subgroups presented asymmetry to the right, except for the net equity group, which presented asymmetry to the left and positive asymmetry, which in general, suggests the existence of distributions that are more likely to assume above-average values. And the kurtosis reveals that, in general, the distri
-butions of the variables were leptokurtic, configuring the existence of heavy tailed in the distributions of the sample variables.
Through the analysis of the median in the general sample, we are able to verify that, the less liquid the balance sheet groupings are, the higher its median is, except for the noncurrent receivables group, evidencing a preference for the search and application of long-term resources in the sample in general, a factor that suggests that there is a temporal “fit” between funding and the application of resources, as well as a preference for long-term funding and application, permanent assets 58% and that the sources of funds are captured by equity 53%.
7. Results
In order to verify the adequacy of the hierarchical model to identify the origin of the ope
-rational performance of the firm, we start with the null model, because it does not contain explanatory variables. The model allows to decompose the variance at the following levels: (i) the variance originated over time; (ii) the variance originated from the characteristic between firms; and (iii) the variance originated from the characteristic between sectors.
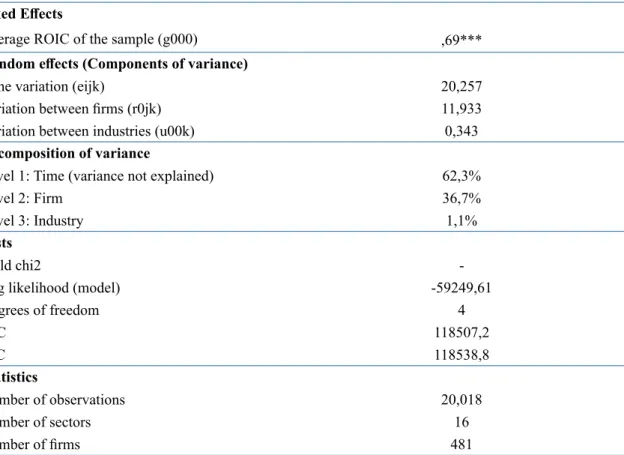
We verify that the level of the sector shows little contribution to the understanding of the variations of the operating result (1.1%), suggesting the possibility of non-existence of significant variations between the analyzed sectors. Moreover, 36.7% of the variance can be attributed to characteristics between firms. Therefore, hypothesis H1 allows identifying the source of the competitive advantage, evidencing that the level of the firm explains the operational performance 36 times more than the level of the Brazilian firms sector. The
ROIC CA OA NCR PA CL OL LTL NE HHI
Mean 1,19 0,09 0,21 0,13 0,57 0,16 0,13 0,31 0,25 0,22
Standard deviation 5,37 0,19 0,18 0,16 0,26 1,22 0,14 1,49 3,97 0,17
Kurtosis 24,60 80,29 3,36 9,49 2,27 1016,0 7,4 448,6 738,3 7,51
Asymmetry -0,39 6,84 0,94 2,32 -0,25 30,31 1,82 19,9 -25,8 1,90
Coef. of variation 4,53 2,09 0,88 1,25 0,45 7,50 1,04 4,86 15,9 0,78 Minimum -39,74 -1,08 0,00 0,00 0,00 -0,05 0,00 0,00 -119,9 0,05
Maximum 54,90 3,12 1,08 0,99 1,01 42,4 0,9 37,5 1,01 0,97
1st Quartile -0,14 0,00 0,05 0,02 0,39 0,02 0,03 0,03 0,32 0,10
Medium 1,30 0,03 0,17 0,07 0,58 0,07 0,10 0,13 0,53 0,18
3rd Quartile 3,01 0,11 0,32 0,18 0,78 0,15 0,19 0,29 0,76 0,30
Table 1. Descriptive Statistics of ROIC and its explanatory variables subdivided into endogenous groups (balance sheet structure –firm resources proxies) and exogenous group (characteristic of the sector competition and dynamism) of firms in the Brazilian market
BBR
15,6
522
remainder of the variance, 62.3%, can be attributed to the variable time in the firm, which suggests that the study be modeled by trend (table 2).
Therefore, we generate linear trend models with random effects, inserting variables, separately, at the firm level that represent subgroups of the balance sheet, such as proxies of the firm’s resources, to verify its relation with the operating return. Thus, we adopted three levels of analysis for the models, being: level 1- variation in the firm’s operating per
-formance over time; level 2- variation in operational per-formance among firms in the same sector; and level 3- variation at the firm-level operational performance and, at the sector level, has been inserted and maintained for all models, the herfindahl-hirshmann variable (HHI) as a proxy for the sector’s level of concentration.
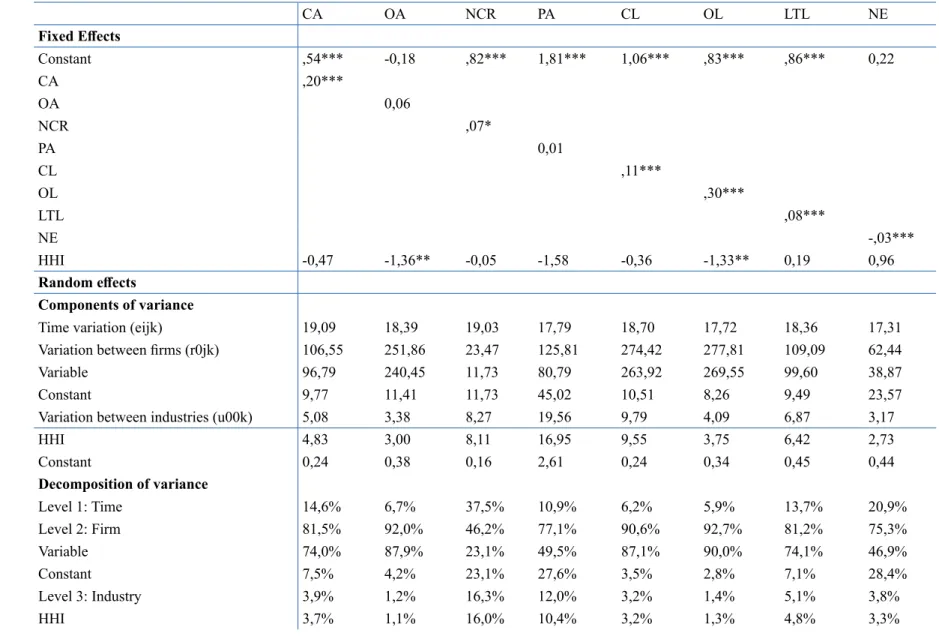
On the other hand, the random effects part shows that an increase of the variance expla
-natory capability at the sector level from 1.2% to around 16.3%; at the firm level between 46.2% and 92.7%, showing a reduction in variance over time, compared to previous models ranging from 5.9% to 37.5%. The fitting criteria of the AIC and BIC models suggest that random models are better fitted (table 3).
The Wald test (χ2) evidences that all the models are significant, except the model that uses the variables NCR and PA. The fixed part of the model suggests that operating sub
-groups demonstrate variables that are statistically significant present a direct relationship with the firm’s operating return, except for variable NE, and that the OL has greater expla
-natory power of the operating return. The level of competition variable we added (HHI) appears to be statistically significant in the models that use OA and OL, having an inverse relationship with the operating return, evidencing that the higher the sector’s concentration, the lower the firms’ operating return inserted therein.
Table 2. Decomposition of the sample Variance - Null Model Fixed Effects
Average ROIC of the sample (g000) ,69***
Random effects (Components of variance)
Time variation (eijk) 20,257
Variation between firms (r0jk) 11,933
Variation between industries (u00k) 0,343
Decomposition of variance
Level 1: Time (variance not explained) 62,3%
Level 2: Firm 36,7%
Level 3: Industry 1,1%
Tests
Wald chi2
-Log likelihood (model) -59249,61
Degrees of freedom 4
AIC 118507,2
BIC 118538,8
Statistics
Number of observations 20,018
Number of sectors 16
Number of firms 481
BBR
15,6
523
CA OA NCR PA CL OL LTL NE
Fixed Effects
Constant ,54*** -0,18 ,82*** 1,81*** 1,06*** ,83*** ,86*** 0,22
CA ,20***
OA 0,06
NCR ,07*
PA 0,01
CL ,11***
OL ,30***
LTL ,08***
NE -,03***
HHI -0,47 -1,36** -0,05 -1,58 -0,36 -1,33** 0,19 0,96
Random effects
Components of variance
Time variation (eijk) 19,09 18,39 19,03 17,79 18,70 17,72 18,36 17,31
Variation between firms (r0jk) 106,55 251,86 23,47 125,81 274,42 277,81 109,09 62,44
Variable 96,79 240,45 11,73 80,79 263,92 269,55 99,60 38,87
Constant 9,77 11,41 11,73 45,02 10,51 8,26 9,49 23,57
Variation between industries (u00k) 5,08 3,38 8,27 19,56 9,79 4,09 6,87 3,17
HHI 4,83 3,00 8,11 16,95 9,55 3,75 6,42 2,73
Constant 0,24 0,38 0,16 2,61 0,24 0,34 0,45 0,44
Decomposition of variance
Level 1: Time 14,6% 6,7% 37,5% 10,9% 6,2% 5,9% 13,7% 20,9%
Level 2: Firm 81,5% 92,0% 46,2% 77,1% 90,6% 92,7% 81,2% 75,3%
Variable 74,0% 87,9% 23,1% 49,5% 87,1% 90,0% 74,1% 46,9%
Constant 7,5% 4,2% 23,1% 27,6% 3,5% 2,8% 7,1% 28,4%
Level 3: Industry 3,9% 1,2% 16,3% 12,0% 3,2% 1,4% 5,1% 3,8%
HHI 3,7% 1,1% 16,0% 10,4% 3,2% 1,3% 4,8% 3,3%
Table 3. Decomposition of Variance - Linear trend model with random effects
BBR
15,6
524
Note: (i) *** p< 1%; ** p< 5%; * p< 10%; (ii) variables endogenous to the firm: Financial Current Assets (CA); Operating Current Assets (OA); Long-Term Asset (NCR); Permanent Assets (PA); Financial Current Liabilities (CL); Operating Current Liabilities (OL); Long-Term Liabilities (LTL); and Net Equity (NE); (iii) Variables Exogenous to the Firm: HHI Level of Competition in the Sector, calculated by the revenue per activity sector for each firm. Source: author’s own elaboration.
CA OA NCR PA CL OL LTL NE
Constant 0,1% 0,1% 0,2% 0,9% 0,0% 0,1% 0,2% 0,3%
Test
Wald chi2 27,52*** 6,49** 2,73 1,9 111,90*** 52,82*** 97,15*** 37,99***
Log likelihood (modelo) -58933,61 -58654,38 -58888,7 -58654,33 -58769,53 -58158,94 -58558,22 -58214,3
Degrees of freedom 8 8 8 8 8 8 8 8
AIC 117883,2 117324,8 117793,4 117324,7 117555,1 116333,9 117132,4 116444,6
BIC 117946,5 117388 117856,6 117387,9 117618,3 116397,1 117195,7 116507,8
Statistics
Number of observations 20,018 20,018 20,018 20,018 20,018 20,018 20,018 20,018
Number of sectors 16 16 16 16 16 16 16 16
Number of firms 481 481 481 481 481 481 481 481
BBR
15,6
525
These data suggest that the operating returns have a greater influence of endogenous factors (both in the null model and in the model with endogenous predictor variables ge
-nerated by accounting proxies), when compared to factors exogenous to the firm. These results converge to a greater adherence to theories that deal with competitive advanta
-ge, originated from resource theories that market theories originating in microeconomics, corroborating with research that investigate the decomposition of the firm’s performance, attributing greater importance relative to the firm than the industry in which the firm is in
-serted, as in the studies by Schmalensee (1985) and Rumelt (1991). On this matter, several scholars expanded these investigations, such as Roquebert, Phillips, and Westfall (1996), Brush and Bromiley (1997), McGahan and Porter (1997), Brush, Bromiley and Hendrickx (1999), Chang and Singh (2000), McGahan and Porter (2002), Bowman and Helfat (2001), Goldszmidt, Brito and Vasconcelos (2007), Goldszmitdt (2010) and Schechtman (2012).
However, organizational performance can be affected in different ways and dimensions, and that industries relate to the performance of the organization in a more complex way that may seem (Combs, Crook & Shook, 2005). Moreover, given the coexistence between fac
-tors of the firm and sector characteristics, we investigate the existence of moderating effects of such characteristics on the relationship between firm’s resources and performance.
In the following models, we insert variables that capture characteristics of the sector: Level of concentration, calculated from the Herfindahl-hirschman index (HHI), whose pur
-pose is to verify the moderating effect that the characteristics of the sectors cause in the relation between the balance sheet subgroups and their operational performance.
The model with a random effects tendency with moderation of the sector’s level of com
-petition evidences the moderating effect that the level of contraction in the sector causes in the relation between the balance sheet subgroups and operating return of the firm. Defined on the argument that competition considered one of the major economic forces towards firm efficiency (Shleifer & Vishny, 1997), and considering the existence of different levels
of competition.
The Wald test (χ2) evidences that all the models are significant, except the model that uses the variables NCR and PA. The fixed part of the model suggests that operating sub
-groups demonstrate variables that are statistically significant present a direct relationship with the firm’s operating return, except for variable NCR and PA; and that OL, CA, and OA have greater explanatory power of the operating return, with all models presenting a positive relationship between balance sheet groups and operating return, except for the NE model (table 4).
The balance sheet variables moderated by the level of competition appear to be signi
-ficant in the models OA, CL, OL, LTL, and NE, with all these indices having an inverse relation to the operating return (negative sign), evidencing that the greater the sector’s level of concentration, the lower are firms’ operating return, except for the NE model that shows direct relationship. The Akaike criteria (AIC) and Bayesian information (BIC) suggest that random effects models with moderating variables are better fitted than models without moderation, except for models with OA and CL variables.
To verify the moderation effect of the level of competition, we plotted the graphs 1a – 1e between the balance sheet composition variables and the firm’s operating return (only for the statistically significant), with high and low values being defined, considering more and less a standard deviation for each variable (graph 1).
The moderation of the level of competition in relation to balance sheet subgroups and their effects on operating returns for the variables were thus observed: (i) in competitive environments, the higher the OA and the CL, the firm’s operational performance tends to be higher; however, as the level of competition in the sector decreases (moves towards monopoly); firms with higher OA and CL tend to a more significant reduction in rela
BBR
15,6
526
Dependent variable: ROIC CA OA NCR PA CL OL LTL NE
Fixed Effects
Constant ,53** -,48* ,82*** 1,92*** 1,00*** ,40* ,79*** 0,28
CA ,21***
OA ,21***
NCR 0,06
PA 0,00
CL ,15***
OL ,64***
LTL ,10***
NE -,04***
HHI -1,35 -0,15 -0,07 -1,97 -0,12 0,47 0,48 0,62
Moderation (HHI) -0,03 -,71** 0,02 0,05 -,22*** -2,99*** -,11*** ,06***
Random effects
Components of variance
Time variation (eijk) 19,09 18,38 19,03 17,79 18,64 17,68 18,33 17,27
Variation between firms (r0jk) 106,57 252,96 168,75 126,08 273,68 273,65 109,57 62,63
Variable 96,80 241,59 157,01 81,03 263,15 265,39 99,97 38,98
Constant 9,77 11,36 11,73 45,05 10,53 8,26 9,60 23,64
Variation between industries (u00k) 5,09 2,67 8,28 19,61 9,95 2,02 6,69 3,91
HHI 4,84 2,28 8,12 17,04 9,69 1,79 6,21 3,44
Constant 0,25 0,39 0,16 2,57 0,26 0,22 0,47 0,47
Decomposition of variance
Level 1: Time 14,6% 6,7% 9,7% 10,9% 6,2% 6,0% 13,6% 20,6%
Level 2: Firm 81,5% 92,3% 86,1% 77,1% 90,5% 93,3% 81,4% 74,7%
Variable 74,0% 88,2% 80,1% 49,6% 87,1% 90,5% 74,3% 46,5%
Constant 7,5% 4,1% 6,0% 27,6% 3,5% 2,8% 7,1% 28,2%
Table 4. Decomposition of the sample’s Variance - Model of linear trend with random effects with moderating herfindahl- hirshmann exo
-genous variable.
BBR
15,6
527
Level 3: Industry 3,9% 1,0% 4,2% 12,0% 3,3% 0,7% 5,0% 4,7%
HHI 3,7% 0,8% 4,1% 10,4% 3,2% 0,6% 4,6% 4,1%
Constant 0,1% 0,1% 0,0% 0,9% 0,0% 0,0% 0,2% 0,3%
Test
Wald chi2 27,55*** 26,25** 2,75 2,54 175,94*** 106,81*** 119,95*** 83,49***
Log likelihood (modelo) -58933,6 -58644,66 -58888,7 -58654,02 -58737,77 -58132,21 -58546,87 -58192,54
Degrees of freedom 9 9 9 9 9 9 9 9
AIC 117885,2 117307,3 117795,4 117326 117493,5 116282,4 117111,7 116403,1
BIC 117956,3 117378,5 117866,5 117397,2 117564,7 116353,6 117182,9 116474,2
Statistics
Number of observations 20,018 20,018 20,018 20,018 20,018 20,018 20,018 20,018
Number of sectors 16 16 16 16 16 16 16 16
Number of firms 481 481 481 481 481 481 481 481
Source: author’s own elaboration. Note: (i) *** p< 1%; ** p< 5%; * p< 10%; (ii) variables endogenous to the firm: Financial Current Assets (CA); Operating Current Assets (OA); Long-Term Asset (NCR); Permanent Assets (PA); Financial Current Liabilities (CL); Operating Current Liabilities (OL); Long-Term Liabilities (LTL); and Net Equity (NE); (iii) Variables Exogenous to the Firm: HHI Level of Competition in the Sector, calculated by the revenue per activity sector for each firm.
BBR
15,6
528
competitive environments, the lower the OL and the LTL, the greater the firm’s operating return. However, as the sector’s level of competition decreases, it increases (moves towards monopoly), firms with higher LTL tend to a more significant reduction in the relationship with returns, when compared to those with lower LTL; and (iii) in competitive environ
-ments, the lower the NE, the firm’s operating return tends to be higher. However, as the sector’s level of competition decreases (moves towards monopoly), firms with higher NE tend to increase more significantly in relation to returns, when compared to those with lo
-wer NE.
The effect of the characteristics of the sector on the relationship between endogenous factors and the firm’s operational performance makes the relation between firm resources and operational performance sensitive to the moderating effects of level of competition. This effect makes the sector moderation relevant to studies of the firm’s operational per
-formance, converging to the arguments and findings by Prescott, Kohli and Venkatraman Graph 1. Moderating effect of the level of competition in the relationship between resources and the firm's operational performance
BBR
15,6
529
(1986), Hansen and Wernerfelt (1989), McGahan and Porter (1997); Castrogiovanni (1991), Dreyer, Grønhaug (2004), Combs, Crook and Shook (2005), Li and Hwang (2011).
8. Conclusions
This study investigates the relationship between the competitive advantage and the firm’s operational performance, from the endogenous origin (firm’s balance sheet composition) or exogenous (sector’s level of concentration), based on metrics contained in the financial statement structure. Additionally, we verify how the exogenous characteristics (sector’s level of concentration) moderate the relation between balance sheet composition (firm’s resources) with the firm’s operating performance.
The idiosyncratic characteristics of the firm presented the balance sheet groups as pro
-xies generated from the accounting model, based on the accounting concept of assets and liabilities, which are assets belonging to the firm, whose measurement is related to the disclosure of performance in a given period in time; and in the fact that the firm’s balance sheet composition is formed from the choice of its managers and the efficiency of its use has consequences in the firm’s results. Thus, it provides, from its relation, a measure of operational performance based on the ability to manage the assets and their conversion into results. Therefore, we have that the relevance of financial statements is that they can be used to help predict and identify the formation of the firm’s results (Barker & McGeachin, 2015). Thus, the profile of the firm’s assets and the adequacy of its use are reflected in the
operational performance.
Furthermore, environmental characteristics may affect the firm’s trading power, influen
-cing the relationship between firms with their suppliers and customers, interfering in the distribution of generated value and in the value appropriated by it. Consequently, the effects of coexistence between the characteristics of the environment and factors of the firm are measured/evidenced in the accounting statement of the firm.
The present study advances in the approximation of the fields of study of the competitive advantage, when proposing proxies contained in the structure of the accounting statement – balance sheet as metrics of the firm’s resources -, and, from these, establish relation with the operational performance of the firm. Thus, it seeks an approximation of the resource theory with the concept of assets and their causal and temporal relationship between resources and firm performance. Therefore, the capacity of the measurement of the resources and the performance of the firm based on the accounting model is limited.
In summary, the results of this research suggest that: (i) The firm’s idiosyncratic capabi
-lities have greater explanatory capability of the operational performance, when compared to characteristics of the environment in which the firm is inserted; and (ii) the relationship between idiosyncratic resources of the firm, captured by the accounting measurement mo
-dels, with operational performance, are sensitive to the characteristics exogenous to the firm, the characteristics of the sector, specifically the level of concentration and the level of unpredictability. The presence of this factor reverses the relationship between the idiosyn
-cratic resources of the firm and the operational performance.
We hope that the evidence found in this research contributes to increase the knowledge about the competitive advantage and its importance in the studies of the decomposition and origin of the firm’s operational performance, from proxies contained in the structure of the financial statements.
BBR
15,6
530
This study has some limitations, which should be considered for a more adequate evalu
-ation of the results we present: the results of the present study are conditioned to the obser
-ved sample - any inference or consideration loses force when the data and periods we are analyzing is extrapolated, and we should conduct it with caution. The study presents all the limitations inherent to the use of proxies and, in particular, the use of accounting metrics as resource proxies based on the theory of competitive advantage; the sample is unbalanced, which may jeopardize or alter the characteristics of the information that is dependent on series; the survival bias is present, since, due to the need of data for a certain amount of years so we can operationalize the models, we left companies that do not present data in consecutive periods out of the sample; the difference between the concepts of accounting profit and economic profit: relate to theories of positioning (fundamentals in economic and administrative theories) from accounting measures generates a limitation from different concepts about the results of the firm.
However, such limitations do not eliminate the possibility of obtaining certain useful evidence as a subsidy for future research. However, by employing such methodology to specific industries, with significant samples, we can obtain greater adherence to the theory of competitive advantage and the relation with the accounting measures in the Brazilian
market.
9. References
Adner, R., & Helfat, C. E. (2003). Corporate Effects and Dynamic Managerial Capabilities. Strategic Mana -gement Journal, 24, 1011-1025.
Almeida, J. E. F. (2010). Qualidade da informação contábil em ambientes competitivos. 188 f. Tese (Douto -rado em Controladoria e Contabilidade) – Universidade de São Paulo.
Bain. J. S. (1964). The Impact on Industrial Organization. The American Economic Review, 54(3), 28-32. Barker, R., & McGeachin, A. (2015). An Analysis of Concepts and Evidence on the Question of Whether
IFRS Should be Conservative. A journal of accounting, finance and business studies. 54, 1-39. Berry, A., & Jarvis, R. (1994). Accounting in a Business Context. 2 ed. Thomson Business.
Besanko, D., Dranove, D., Shanley M., & Schaefer, S. (2006). A economia da estratégia. 3 ed. Porto Alegre, Bookman.
Bickel, R. (2007). Multilevel Analysis for Applied Research: It’s Just Regression. Guilford Press.
Bowman E. H., & Helfat C. E. (2001). Does corporate strategy matter? Strategic Management Journal. 22, 1-23.
Brito, R. P., & Brito, L. A. L. (2012). Vantagem competitiva, criação de valor e seus efeitos sobre o desempe -nho. Revista de Administração de Empresas. 52(1), 70-84.
Brush, T. H., & Bromiley, P. (1997). What does a small corporate effect mean? A variance components simu -lation of corporate and business effects. Strategic Management Journal. 18, 825-835.
Brush, T. H., Bromiley, P., & Hendrickx, M. (1999). The relative influence of industry and corporation on business segment performance: an alternative estimate. Strategic Management Journal. 20, 6, 519-547. Byrns, R., & Stone Junior, G. W. (1996). Microeconomia. São Paulo: Makron Books.
Castro, R. G., & Aguilera, R. V. (2015). Incremental value creation and appropriation in a world with multiple stakeholders. Strategic Management Journal. 36. 137–147.
Castrogiovanni, G. J. (1991). Environmental munificence: A theoretical assessment. Academy of Manage -ment Review, 16, 542–563.
Caves, R. E. (1984). Economic analysis and the quest for competitive advantage. American Economic Re -view, 74(2), 127.
Chang, S. J., & Singh H. (2000). Corporate and industry effects on business unit competitive position. Strate -gic Management Journal. 21(7), 739-752.
Combs, J. G., Crook, T. R., & Shook, C. L. (2005). The dimension of organizational performance and its implications for strategic management research. In: D. J. KETCHEN e D. D. BERGH (Orgs.), Research Methodology in Strategy and Management, San Diego, Elsevier. 259-286.
BBR
15,6
531
Esho, N., Kofman, P., & Sharpe, I. G. (2005). “Diversification, fee income, and credit union risk”. Journal of Financial Services Research, 27, 259-281.
Foss, N. J. (1996). Researching in strategy, economics and Michael Porter. Journal of Management Studies, 33, 1-24.
Goldszmidt, R. G. B., Brito, L. A. L., & Vasconcelos, F. C. (2007). O efeito país sobre o desempenho da firma: uma abordagem multinível. Revista de Administração de Empresas. 47(4), 1–14.
Goldszmidt, R. G. B. (2010). Recessão e desempenho das firmas: uma abordagem multinível de curva de crescimento. 2010. 225f. Tese (Doutorado em Administração de Empresas) – Programa de Pós Graduação em Administração de Empresas, Escola de Administração de Empresas de São Paulo, EAESP.
Goll, I., & Rasheed, A. (1997). Rational decision-making and firm performance. Strategic Management Jour -nal, 18(7), 583–91.
Hair Jr., J. F., William, B., Babin, B., & Anderson, R.E. (2009). Análise multivariada de dados. 6. ed. Porto Alegre: Bookman.
Hansen, G. S., & Wernerfelt, B. (1989). Determinants of firm performance: the relative importance of econo -mic and organizational factors. Strategic Management Journal. 10(5), 399-411.
Healy P. M., & Palepu K. G. (2001). Information asymmetry, corporate disclosure, and the capital markets: A review of the empirical disclosure literature. Journal of Accounting and Economics, 31(3), 405-440. Hough, J. R. (2006). Business segment performance redux: a multilevel approach. Strategic Management
Journal. 27, 45–61.
Kupfer, D., & Hasenclever, L. (2013). Economia industrial: fundamentos teóricos e práticas no Brasil. Rio de Janeiro. 2 ed. Elsevier.
Lawless, M. W., & Finch, L. K. (1989). Choice and determinism: A test of Hrebiniak and Joyce’s framework on strategy-environment fit. Strategic Management Journal, 4, 351-365.
LI, L. M. Y, & Hwang, N. C. R. (2011). Effects of Firm Size, Financial Leverage and R&D Expenditures on Firm Earnings: An Analysis Using Quantile Regression Approach. A journal of accounting, finance and business studies. 47(2), 182-204.
McGahan A. M., & Porter M. E. (2002). What do we know about variance in accounting profitability? Mana -gement Science. 48(7), 834–851.
McGahan, A. M., & Porter, M. E. (1997). How much does industry matter, really? Strategic Management Journal. 18(4), 15-30.
Misangyi, V. F., Elms H., Greckhamer, T., & Lepine, J. A. (2006). A new perspective on a fundamental deba -te: a multilevel approach to industry, corporate, and business unit effects. Strategic Management Journal. 27(6), 571-590.
Nielsen, B. B., & Nielsen S. (2013). Top management team nationality diversity and firm performance: a multilevel study. Strategic Management Journal. 34, 373–382.
Nissan, E. (1990). Changes in the Size Structure of the World’s Largest Banks by Country, Quarterly Journal of Business & Economics, 41(3), 21-48.
O’connor, N. G., DENG F. J., & FEI P. (2015). Observability and Subjective Performance Measurement. A Journal of Accounting, Finance and Business Studies. 51(2), 208-237.
Penman, S. H. (2009). Accounting for Intangible Assets: There is also an Income statement. A Journal of Accounting, Finance and Business Studies. 45(3), 358-371.
Penman, S. H. (2010a). Financial Forecasting, Risk and Valuation: Accounting for the Future. A Journal of Accounting, Finance and Business Studies. 46(2), 211-228.
Penman, S. H. (2010b). Financial Statement analysis and security valuation. McGraw-Hill Companies. Penrose, E. (1959). The Theory of the Growth of the Firm. Oxford, UK: Oxford University Press.
Porter, M. E. (1983). Industrial organization and the evolution of concepts for strategic planning: the new learning. Managerial and Decision Economics. 4(3), 172-180.
Porter, M. E. (1979). The structure within industries and companies’ performance. The Review of Economics and Statistics. 61(2), 214-227.
Powell, T. C. (2003). Varieties of competitive parity. Strategic Management Journal. 24(1), 61-86.
Prescott, J. E., Kohli, A. K., & Venkatraman, N. (1986). The market share-profitability relationship: An empi -rical assessment of major assertions and contradictions. Strategic Management Journal. 7, 377-394. Ranieri, M. J. C. (2011). Regulação, Poder de Mercado e Concorrência dos Bancos no Brasil sob a avaliação
dos Conglomerados Financeiros. Tese (doutorado) - Escola de Economia de São Paulo. São Paulo. Raudenbush, S. W., & Bryk A. S. (2002). Hierarchical linear models. Applications and data analysis methods.
BBR
15,6
532
Ribarczyk, B. G., & Oliveira, J. C. (2013). Análise da concentração bancária brasileira entre 2000-2011: o impacto da fusão do Itaú com o Unibanco. 2011. Revista Estudos do CEPE, Santa Cruz do Sul, 37, 5-26. Roquebert, J. A., Phillips, R. L., & Westfall, P. A. (1996). Markets vs. management: what drives profitability?
Strategic Management Journal. 17(8), 653-664.
Rumelt R. P. (1984). Towards a strategic theory of the firm. Competitive Strategic Management. Prentice --Hall: Englewood Cliffs, N. J.; 556–570.
Rumelt, R. P. (1991). How much does industry matter? Strategic Management Journal. 12(3), 167-185. Rumelt, R. P., Schendel, D. E., & Teece, D. J. (1991). Strategic management and economics. Strategic Mana
-gement Journal, 12 (special issue), 5-29.
Rutherford, B. A. (2013). A Pragmatist Defense of Classical Financial Accounting Research. A journal of accounting, finance and business studies. 49,(2), 197-218.
Schectman, L. (2012). Variabilidade da tendência do desempenho da firma: uma análise multinível. 2012, 80 f. Dissertação (mestrado) – Escola Brasileira de Administração Pública e de Empresas, São Paulo. Schmalensee R. (1985). Do markets differ much? American Economic Review, 341–351.
Scott, W. R. (2009). Financial accounting theory. 5 ed. Toronto: Pearson Education Canada.
Shleifer, A., & Vishny, R. W. (1997). A survey of corporate governance. The journal of finance. V. LII(2). Simerly R., & LI M. (2000). Environmental dynamism, capital structure and performance. Strategic Mana
-gement Journal. 21(1), p.31-49.
Simons, R. (1999). Performance Measurement and Control Systems for Implementing Strategy: text e cases, Hardcover.
South, S. E. (1981). Competitive advantage: the cornerstone of strategic thinking. The Journal of Business Strategy, 1(4), p. 15-36.
Stiglitz, J. E. (2003). Introdução à microeconomia. 3. ed. Americana. Tradução de Helga Hoffmann. Rio de Janeiro: Campus.
Thompson Jr., & Formby, A. A. (2002). Microeconomia da firma: teoria e prática. 6. ed. Rio de Janeiro: Prentice-Hall do Brasil.
Vasconcelos, F. C., & Brito, L. A. L. (2004). Vantagem competitiva: o construto e a métrica. Revista de Ad -ministração de Empresas. 44(2), 70-82.
Venkatraman, N., & Ramanujam, V. (1986). Measurement of business performance in strategy research: a comparison of approaches. The Academy of Management Review. 11(4), 801-814.