Experimental characterization of an earth eco-efficient plastering mortar
1Paulina Faria 1* 2
Tânia Santos 2 3
Jean-Emmanuel Aubert 3 4
5
ABSTRACT
6
Earthen plastering mortars are becoming recognized as highly eco-efficient. The 7
assessment of their technical properties needs to be standardized but only the German 8
standard DIN 18947 exists for the moment. An extended experimental campaign was 9
developed in order to assess multiple properties of a ready-mixed earth plastering 10
mortar and also to increase scientific knowledge of the influence of test procedures on 11
those properties. The experimental campaign showed that some aspects related to the 12
equipment, type of samples and sample preparation can be very important, while 13
others seemed to have less influence on the results and the classification of mortars. It 14
also showed that some complementary tests can easily be performed and considered 15
together with the standardized ones, while others may need to be improved. The 16
plaster satisfied the requirements of the existing German standard but, most 17
importantly, it seemed adequate for application as rehabilitation plaster on historic and 18
modern masonry buildings. Apart from their aesthetic aspect, the contribution of 19
earthen plasters to eco-efficiency and particularly to hygrometric indoor comfort should 20
be highlighted. 21
22
Subject headings from the ASCE's Civil Engineering Database
23
Mortar; Prefabrication; Test procedure; Standardization; Classification 24
1
PhD, CERIS, ICIST, Nova University of Lisbon, Department of Civil Engineering, Caparica Campus, 2829-516 Caparica, Portugal, [email protected]
* corresponding author
2 MSc, Nova University of Lisbon, Department of Civil Engineering, Caparica Campus, 2829-516 Caparica, Portugal, [email protected]
3
Introduction
25Mortars are building products that are widely used in construction, principally being 26
applied as rendering and plastering systems to protect the walls. While renders have to 27
resist the action of rain water, plasters must contribute to the indoor air quality and 28
comfort. Therefore plastering mortars must fulfill predetermined requirements. 29
After being neglected for decades, earth-based plastering mortars are nowadays 30
becoming recognized as highly eco-efficient (Maddison et al., 2009; Darling et al., 31
2012). When compared to other types of mortars the sustainability of earth mortars is 32
well known, mainly in terms of embodied energy (Swan et al., 2011). In fact, this type of 33
mortar does not contain binders that have to be specifically produced and thus involve 34
stone mining, transport and energy consumption. Melià et al. (2014) compared the 35
environmental impacts of earthen plasters with those of conventional plasters based on 36
common binders (like cement or hydraulic lime) using the LCA methodology. Their 37
research showed that earth plasters outperformed the others with respect to all the 38
indicators considered: cumulative energy demand, greenhouse gas protocol, ecological 39
footprint and ReCiPe indicators (Melià et al., 2014). Aesthetic aspects, like color and 40
texture, were also recognized. However, the technical characteristics and efficiency of 41
these mortars has not often been scientifically proved; their technical efficiency needs 42
to be evidenced by testing. 43
Compared to other types of earth-based products, as the case of earth blocks that 44
have been deeply studied (Danso et al., 2014; Cagnon et al., 2014; Silveira et al., 45
2014), and other types of plastering mortars, such as air lime-based products (Veiga et 46
al., 2010; Faria et al., 2008), earth-based mortars have been characterized in very few 47
scientific studies (Pkla et al., 2003; Azeredo et al., 2008; Hamard et al., 2013; Delinière 48
et al., 2014). There are few codes and standards for earth building materials (Swan et 49
al., 2011). The recent German standard DIN 18947 (DIN, 2013) is the first standard 50
specifically devoted to earth mortars. It defines some requirements and test methods. 51
masonry mortars, mainly hydraulic binder-based, while others are specific to the DIN 53
standard (DIN, 2013). Delinière et al. (2014) have recently applied this standard to 54
characterize five ready-mixed earth plasters. 55
The experimental study presented in this paper involved a ready-mixed earth plastering 56
mortar based on natural earth, sand and plant fibers. The dry ready-mixed product was 57
characterized in the laboratory. The same ready-mixed product was used to produce 58
two sets of mortars. The first was prepared in the field with current mechanical 59
equipment while the second was prepared in controlled laboratory conditions. The 60
mortar prepared on site was used to plaster an experimental brick masonry wall that 61
was being non-destructively tested (Faria et al., 2014), and a portion was reserved. 62
Both mortars were characterized in the fresh state and measurements included drying 63
shrinkage. Samples with different dimensions and methods of preparation were 64
produced in the laboratory. The wall plaster and the samples were tested. 65
Characterization of the hardened mortar included visual observation of the plaster 66
applied to the brick masonry test wall and several tests performed on mortar samples 67
to evaluate the mechanical, physical and microstructural properties of the mortar. 68
Hygrothermal properties of the hardened mortars were also studied (sorption– 69
desorption isotherms, vapor diffusion and thermal conductivity). The characterization 70
and the test procedures were based on the German standard (DIN, 2013) but also 71
included other standards and specific test procedures implemented by the authors. 72
The influence of differences in the dimensions of samples and the methods for 73
preparing them were assessed. The characteristics of the plaster are presented and, 74
whenever possible, compared with the DIN (DIN, 2013) requirements and with other 75
studies (Delinière et al., 2014; Gomes et al., 2012; Veiga et al., 2010). The aim is to 76
contribute to the setting up of test procedures, including the validation of existing ones 77
and the development of complementary procedures to characterize earth plasters. 78
These indicative results should be useful for a future international standard for earthen 79
81
Materials and methods
82
Materials 83
The experimental study presented in this paper was carried out with a ready-mixed 84
earth plastering mortar from the Embarro company (Portugal and Spain), based on 85
natural clayish earth and siliceous sand, both from the Algarve region (South Portugal), 86
and cut oat fibers 1-2 cm long. The ready-mixed mortar was mechanically produced on 87
site using a Putzmeister MP25 mixing and pumping equipment. The same equipment 88
was used for the application of mortar as a plaster on an experimental hollow brick 89
masonry wall having a surface area of 2.2 m x 1.8 m with rain protected exposure to 90
the outdoor environment (Fig. 1). A portion of this mortar was transported to the 91
laboratory (30 m distance – 2 minutes), where it was tested in fresh state conditions 92
and samples were prepared: prismatic samples 40 mm x 40 mm x 160 mm were 93
prepared in metallic molds and a 15 mm-thick mortar layer was applied to the surface 94
of ceramic hollow brick of surface area of 29.5 cm x 19.5 cm (Fig. 1). The same ready-95
mixed mortar product was mixed in the laboratory for 5 minutes with a mixer blade 96
(commonly used on site), using the same water content as for the on-site mortar. It, 97
too, was tested in fresh state conditions and samples were prepared: disk samples 90 98
mm in diameter and either 15 mm or 20 mm thick were prepared in PVC molds over a 99
polyethylene base and rectangular samples with 200 mm x 500 mm surface and 15 100
mm thick were prepared in metallic molds (Fig. 1). All the samples were manually 101
compacted and leveled. The prismatic samples were de-molded when hardened and 102
all the samples were allowed to reach equilibrium in controlled environmental 103
conditions at 20±3°C and 65±5% relative humidity (RH). 104
105
Methods 106
The dry ready-mixed mortar product was observed visually and characterized in terms 108
of loose bulk density, based on EN 1097-3 (CEN, 1998c), dry particle size distribution, 109
based on EN 1015-1 (CEN, 1998/2006) and by X-ray diffraction test (XRD). XRD was 110
carried out with a Phillips diffractometer with Co Kα radiation, speed of 0.05 º/s and 2θ
111
ranging from 3 to 74. Two types of fractions were analysed: a fraction designated as 112
fine fraction, which has a higher binder concentration and was obtained from the fines 113
of the ready-mixed product passing a 106 μm sieve and a fraction designated as 114
global, obtained by grinding the ready-mixed product as collected, to pass in the 106 115
μm sieve. 116
The two batches of mortar were tested by: flow table consistency, based on standard 117
EN 1015-3 (CEN, 1999/2004/2006); bulk density, following standard EN 1015-6 (CEN, 118
1999/2006a); air content, according to standard EN 1015-7 (CEN, 1998b); and water 119
content, determined by weight loss after oven drying. 120
The laboratory mortar was also tested for water retention based on draft standard prEN 121
1015-8 (CEN, 1999). To determine water retention, the weight increase of filter papers 122
in contact with the fresh mortar specimen for 5 minutes was considered, in relation to 123
the mortar solid and liquid compositions. Consistency was assessed also by 124
penetrometer, based on standard EN 1015-4 (CEN, 1998a), and by the slump 125
occurring in the flow table test sample. For the latter test, the slump of the mortar 126
specimen was determined by the difference between the height of the mold and that of 127
the highest point of the slumped test specimen. 128
129
Drying shrinkage 130
For the mortar mixed on site, linear drying shrinkage was determined on the basis of 131
standard DIN 18947 (DIN, 2013) by the linear geometrical length reduction due to 132
drying of six mortar samples 40 mm x 40 mm x 160 mm, assessed when they were de-133
reduction of the surface of three 200 mm x 500 mm mortar samples 15 mm thick when 135
hardened on metallic molds, compared with the dimensions of the molds. 136
137
Surface cohesion and dry abrasion resistance 138
The superficial cohesion and dry abrasion resistance were determined to assess the 139
surface resistance and the eventual necessity for surface hardening (Röhlen and 140
Ziegert, 2011). Superficial cohesion was determined by the weight increase of an 141
adhesive tape 70 mm x 50 mm, after it had been pressed with constant intensity on the 142
surface of the samples of mortar layer on ceramic brick, using the method of Drdácký 143
et al. (2014), which expresses the loss of particles from the surface of the mortar. The 144
average and standard deviation of results obtained with six adhesive tapes applied in 145
two bricks was used. 146
Dry abrasion resistance was determined according to DIN 18947 (DIN, 2013), by the 147
weight loss of mortar samples after 20 rotations of three different circular polyethylene 148
brushes 65 mm in diameter, applied to the sample surface with a pressure of 2 kg. 149
Samples with mortar on hollow brick and samples of 90 mm diameter and 20 mm 150
thickness were tested. 151
152
Mechanical characterization 153
The mechanical characteristics were evaluated using the six prismatic, 40 mm x 40 mm 154
x 160 mm samples. The dynamic modulus of elasticity was determined based on 155
standard EN 14146 (CEN, 2004), defined for natural stone, using a Zeus Resonance 156
Meter. The flexural and compressive strengths were determined according to 157
standards DIN 18947 (DIN, 2013) and EN 1015-11 (CEN, 1999/2006c) using a Zwick 158
Rowell Z050 machine, with load cells of 2 kN, for bending loads and 50 kN for 159
The adhesive strength was determined with the pull-off adhesion test equipment 161
PosiTest AT-M and pull-head plates 50 mm in diameter, based on standards DIN 162
18947 (DIN, 2013) and EN 1015-12 (CEN, 2000). 163
164
Sorption–desorption isotherms and vapor diffusion 165
Water vapor permeability of the mortar was determined according to DIN 18947 (DIN, 166
2013), EN 1015-19 (CEN, 1998/2004), EN ISO 12572 (CEN, 2001) and EN 15803 167
(CEN, 2009b) using the 90-mm-diameter, 20-mm-thick laboratory mortar samples. The 168
wet method was used and the mortar specimen systems were placed in a climatic 169
chamber at 23ºC and 40% RH. 170
The sorption of the mortar was determined with the 15 mm x 200 mm x 500 mm 171
rectangular samples in metallic molds initially in equilibrium at 50% RH, according to 172
DIN 18947 (DIN, 2013). A climatic chamber was programmed for 80% RH and the 173
water vapor gain after determined periods of time in the climatic chamber (from 0.5 h 174
up to 12 h) was assessed using a scale of 0.1 g precision. It was also determined by 175
the same method but using a scale of 0.001 g precision with the 90-mm-diameter 176
circular samples with thicknesses of 15 mm and 20 mm. The samples were water-177
vapor proofed with a polyethylene film on all surfaces except the top one. Both types of 178
samples were made with the laboratory mortar. The desorption of the mortars, initially 179
at equilibrium at 80% RH, was also determined. The climatic chamber was 180
programmed for 50% RH and the weight decrease of the same samples after the same 181
defined periods of time (from 0.5 h up to 12 h) were determined. 182
183
Capillary absorption and drying 184
The analysis of capillary rise is not a general requirement for non-stabilized earth 185
mortars because they are intended to be applied for plastering the internal surfaces of 186
walls or as renders but in areas protected from rain. Nevertheless, if the wall where the 187
need to resist capillary absorption. Therefore the capillary absorption of the mortar was 189
assessed, using EN 15801 (CEN, 2009a) and EN 1015-18 (CEN, 2002), by sequential 190
weighing of the samples in contact with water to a height of 5 mm. Cubes 40 mm x 40 191
mm x 40 mm were cut from the prismatic samples, prepared and tested. Three different 192
types of sample preparation were used: waterproofing the lateral faces of the cubic 193
samples with an epoxy resin (resin), waterproofing the lateral faces with a polyethylene 194
film (polyeth.), and without any material to waterproof the lateral faces (simple). A thin 195
cotton cloth was placed on the bottom face of each sample, to avoid loss of fines, and 196
was maintained by a thin elastic band. Each sample was placed inside a net basket 197
and handled in the basket throughout the test (Fig. 2). 198
The capillary curve, with water capillary absorption by contact area with water in 199
ordinate (in kg/m2) and the square root of time in abscissa (in min0.5), was plotted. The
200
capillary coefficient, CC, which represents the initial capillary absorption, was 201
determined by the slope of the most representative initial segment of the capillary 202
curve. 203
The drying capacity of the mortar was assessed after samples had been wetted by the 204
capillary test, as described by EN 16322 (CEN, 2014), but without complete saturation 205
of the samples and in slightly different environmental conditions. The same samples, 206
with the three types of lateral surface treatment mentioned above, were used. The 207
drying curve was plotted with time in abscissa and water content in ordinate (weight / 208
drying surface, in kg/m2) and was used to calculate the drying rate (DR) and the drying 209
index (DI). The DR represented the initial drying of the mortar and was determined by 210
the slope of the initial portion of the drying curve for each type of sample preparation. A 211
higher slope of the curve with respect to the horizontal axis reflected a high drying rate 212
and faster initial drying. The DI represented the difficulty of achieving complete drying, 213
in equilibrium with the environment, and was calculated following the simplified 214
procedure presented by Grilo et al. (2014). It was determined for a period of 137 h. 215
217
Thermal conductivity and microstructure 218
Thermal conductivity was determined using six prismatic samples and the samples with 219
a 15-mm mortar layer on hollow brick, from the mortar mixed on site, and also using 220
the 15 mm and 20 mm thick circular samples with and the 15 mm x 200 mm x 500 mm 221
in metallic molds rectangular samples of the laboratory mixed mortar. Tests were 222
performed after drying of the samples and at equilibrium with the laboratory conditions 223
(20ºC, 65% RH). An Isomet 2104 Heat Transfer Analyzer was used with a 60-mm-224
diameter contact probe, API 210412. The equipment requires a minimum surface of 60 225
mm in diameter and a height of 15 mm. The prismatic sample type did not satisfy the 226
recommendations for using the test equipment as the surface area of the contact probe 227
exceeded the surface area of the sample. 228
The bulk density was geometrically determined according to DIN 18947 (DIN, 2013) 229
and EN 1015-10/A1 (CEN, 1999/2006b) on the same prismatic samples, by means of a 230
digital caliper and a 0.001 g precision digital scale. 231
The open porosity was determined by mercury intrusion porosimetry (MIP) and the 232
same technique was used for the determination of pore size distribution. MIP was 233
applied to specimen taken from among the prismatic samples, without the influence of 234
the substrate, but also to specimen of the mortar layer on hollow brick produced in 235
controlled laboratory conditions and samples of the plastering mortar applied on the 236
experimental hollow brick masonry wall, conditioned in the exterior environment 237
protected from rain. It was determined with a Micromeritics Autopore II mercury 238
porosimeter. The masses of the test specimens were stabilized at 40°C and the mortar 239
specimens were prepared so as to occupy the greater part of the 5 cm3 bulb of the 240
penetrometer volume. Testing began at low pressures ranging from 0.01 MPa to 0.21 241
MPa, followed by high pressure analysis from 0.28 MPa to 206.84 MPa, following a test 242
procedure that is commonly used for lime mortar testing (Grilo et al., 2014). 243
Results and discussion
245
Ready-mixed product and fresh state mortar characterization 246
The average value of loose bulk density and its standard deviation was 1.17±0.01 247
kg/dm3. The ready-mixed product had a reddish color and the dry particle size 248
distribution (average of three samples) is presented in Fig. 3. 249
The results obtained by XRD are shown in Fig. 4. The main minerals detected on 250
ready-mixed product were quartz (SiO2), K-Feldspar (KAlSi3O8), dolomite
251
(CaMg(CO3)2), illite ((K,H3O)Al2Si3AlO10(OH)2) and kaolinite (Al2(Si2O5)(OH)4). Other
252
minerals were detected in low proportions, like calcite (CaCO3) and hematite (Fe2O3).
253
The fine fraction presented an increase of the proportions of clay minerals (illite and 254
kaolinite), which is accompanied by k-feldspar, dolomite, calcite and hematite minerals. 255
The mortar (two batches, produced on site and in the laboratory) showed very good 256
workability when handled. The plaster applied to the brick masonry wall (Faria et al., 257
2014) gave a reddish colored surface without shrinkage cracks. Some dispersed plant 258
fibers could be seen. The average values (and, whenever at least three samples were 259
tested, the standard deviation) of fresh mortar properties are presented in Table 1. 260
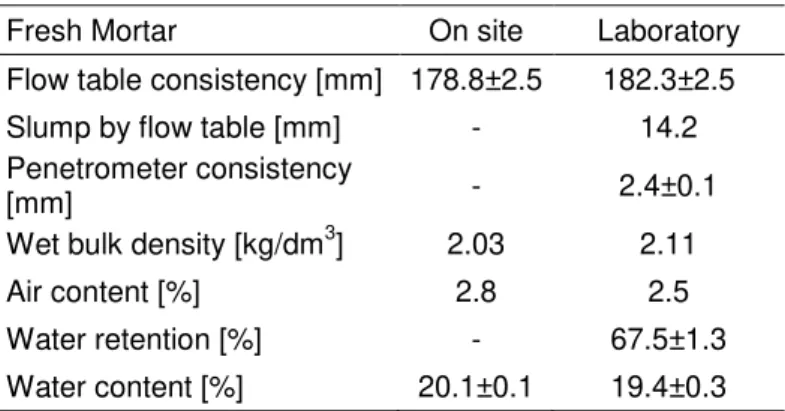
From Table 1, it can be observed that the fresh state characteristics of the mortars 261
mixed on site and in the laboratory were quite similar, namely in terms of flow table 262
consistency, bulk density and water content, despite the different equipment and 263
conditions used for the mortar production. It is probable that the slightly higher air 264
content and lower bulk density of the mortar mixed on site were due to the mechanical 265
equipment that produced (and projected) the mortar. 266
Another fact that could have influenced the fresh state characterization was the time 267
that elapsed between the contact of the clayish mortar product with water and the 268
moment the tests were performed. In fact the mortar mixed on site was prepared and 269
applied as plaster on several walls before being transported to the laboratory and 270
batches did not reveal differences that could be directly attributed to that situation. This 272
is very positive because it indicates good stability of the product when fresh. 273
Compared with earth mortars characterized by Gomes et al. (2012), the mortars 274
considered in the present study had higher bulk density. When the consistency, wet 275
bulk density and water content of the earth mortar tested here were compared with 276
those tested by Delinière et al. (2014), the results were observed to be in the same 277
range. 278
279
Drying shrinkage 280
The average and standard deviation of shrinkage measured on samples 40 mm x 40 281
mm x 160 mm was 0.21±0.08%. In the case of 200 mm x 500 mm laboratory 282
rectangular samples 15 mm thick the average and standard deviation length changes 283
of the shorter and longer sides of the rectangle were 0.32±0.00% and 0.58±0.23%. As 284
these samples were not de-molded, it was harder to measure shrinkage in this case 285
than for prismatic molds. It seemed that shrinkage was proportional to the measured 286
dimension and, for that reason, another mold was filled with laboratory mortar but only 287
one sample was tested, using a film-faced plywood mold 40 mm x 40 mm x 600 mm 288
generally used for testing earth for building purposes and following the Alcock test 289
(Gomes et al., 2014). Drying shrinkage was 0.61% and no crack was observed inside 290
the mold. No cracking due to drying shrinkage was observed on the plaster applied to 291
the experimental wall. The drying shrinkage was very low regardless of the samples 292
used, including the plaster applied to the experimental wall. The shrinkage measured 293
on the prismatic samples, according to DIN 18947 (DIN, 2013), was well beyond the 294
maximum of 3% defined for mortars with fibers. Comparison with the results obtained 295
with samples of other dimensions suggests that the shrinkage increases in direct 296
relation with the length of the sample. 297
298
The cohesion test was easily performed and allowed the superficial loss of material to 300
be assessed quantitatively, by weighing. It was 0.10±0.03 g. 301
It seems that, even if a precision scale is not available, the visual observation of the 302
material sticking to the adhesive tape can be qualitatively compared (Fig. 5). In real 303
conditions, this easy test can, therefore, be used for comparison between plasters and 304
between different areas of the same plaster. Comparing the results obtained by 305
Drdácký et al. (2014) for lime mortars using the same test methods, it is possible to 306
conclude that the loss of material obtained with the clayish plaster is higher, showing a 307
lower surface cohesion. 308
The abrasion relief formed on disk samples with the three brushes can be seen in Fig. 309
6. The soft brush, when pressed, exceeded the diameter of the disc. As the abrasion 310
with that brush was almost inexistent, it could not be measured with the mortar on brick 311
sample because of the scale precision. 312
The average and standard deviation of weight loss by abrasion on circular mortar 313
samples and on mortar-on-brick samples after testing with hard, medium and soft 314
brushes are presented in Table 2. The standard DIN 18947 (DIN, 2013) defines two 315
classes, SI and SII, for mortars considering their weight loss by abrasion and their 316
lower limits are also given in Table 2. 317
The differences of weight loss by abrasion of the mortar obtained with different brushes 318
are noteworthy. With the soft brush, the mortar would be classified in class SII, while 319
with the other two brushes the mortar does not meet the standard requirement. 320
Bearing in mind that DIN 18947 (DIN, 2013) only defines a plastic brush, it seems that 321
the hardness of the brush should be defined with more precision. The DIN standard 322
also defines that, instead of measuring the weight loss, the disaggregated material 323
should be weighed. That procedure would appear to be less accurate because, due to 324
the abrasion of the brush, some of the material would be scattered and, therefore, it 325
would be difficult to gather and weigh the totality. 326
Mechanical characterization 328
The average and standard deviation of the dynamic modulus of elasticity (Ed), flexural 329
and compressive strength (FStr and CStr), and adhesive strength (AStr) of the mortar 330
are presented, together with the lower limits of DIN 18947 (DIN, 2013) strength classes 331
SI and SII, in Table 3. The fracture pattern of the adhesion test was an adhesive 332
rupture at the interface between mortar and brick, effectively representing the adhesive 333
strength. 334
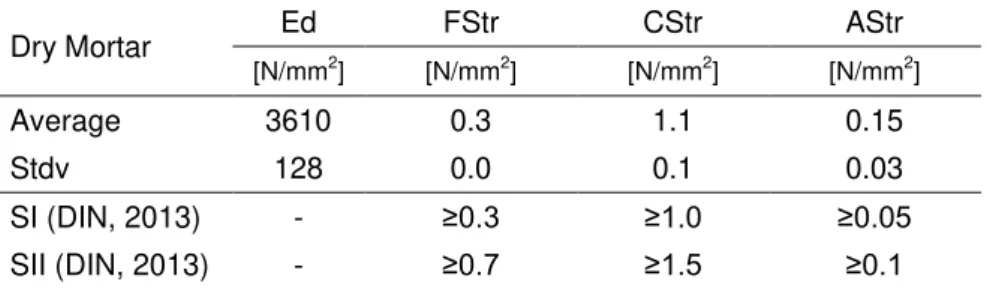
The results presented in Table 3 show that this mortar can be classified as SI because 335
its flexural strength is not less than 0.3 N/mm2, its compressive strength is not less than 336
1.0 N/mm2 and its adhesive strength is not less than 0.05 N/mm2 (DIN, 2013). 337
Compared with earth mortars characterized by Gomes et al. (2014), the mortars 338
analyzed in the present study have higher dynamic modulus of elasticity, flexural 339
strength and compressive strength. Compared with five earth mortars characterized by 340
Delinière et al. (2014) the tested mortar presents flexural and compressive strengths 341
that are lower (though only slightly). Nevertheless the mortar tested has a higher 342
adhesive strength, which may show the influence that different supports can have on 343
this test. In fact, not only the support but also its preparation may have a huge 344
influence on results (Delinière et al., 2014). Different, simple tests may be considered 345
to assess adhesion, such as the one established by Hamard et al. (2013), which can 346
be easily applied on site to evaluate the compatibility of plasters with the substrate. 347
Veiga et al. (2010) suggest a range of mechanical characteristics of plastering mortars 348
to ensure compatibility with historic masonry: dynamic modulus of elasticity 2000-5000 349
N/mm2, flexural strength 0.2-0.7 N/mm2 and compressive strength 0.4-2.5 N/mm2. 350
Although the range was defined for lime-based mortars, it seems acceptable that the 351
same range should be also considered for plastering mortars to be applied to other 352
masonries with similar mechanical characteristics. It can be noted that the mechanical 353
characteristics of the ready-mixed earth mortar are all within the suggested range. 354
Sorption–desorption isotherms and vapor diffusion 356
The water vapor resistance factor, µ, was 8.0±0.3 and the water vapor diffusion 357
equivalent air layer thickness, Sd, was 0.16±0.01 m (average and standard deviation). 358
The DIN 18947 (DIN, 2013) states that a value of 5 - 10 can generally be adopted for 359
the water vapor resistance factor of earth mortars (dry and wet method, respectively). 360
The mortar analyzed confirmed that assumption. 361
Cagnon et al. (2014) obtained values of µ between 3 and 6 with different types of 362
earthen bricks, in a chamber at 50% RH and 20ºC. Although bricks and plasters were 363
applied and tested with different thickness, a comparison of the results stressed the 364
remarkable water vapor permeability of the ready-mixed plaster. 365
The water vapor weight gain and release are presented in Fig. 7. When comparing the 366
adsorption of the mortar by the standardized rectangular sample with 1000 cm2 surface
367
area with the lower limits of classes defined by DIN 18947 (DIN, 2013) (WSI, WSII and 368
WSIII) it can be seen that the mortar can be classified in class WSIII. Nevertheless, 369
and despite the apparently different results obtained with the other samples, for a much 370
smaller surface of 28.3 cm2, the same class would be obtained for both types of 371
samples with 90 mm diameter and 15 mm or 20 mm thickness. Although the 372
rectangular samples show an initial increase on adsorption, their following behavior is 373
parallel to that of the circular samples. There is no difference in sorption between 374
circular samples, regardless of their thickness. 375
Concerning desorption, behavior is similar for the circular and rectangular samples, 376
particularly during the first half of the test. 377
378
Capillary absorption and drying 379
The capillary curves of the mortar tested for each type of sample preparation is 380
presented in Fig. 8, with the most representative segments of capillary absorption and 381
their equations. As explained in Methods the slope of those segments represents the 382
The drying curve of the mortar for each type of sample preparation is presented in Fig. 384
9, with the segments of initial drying for the determination of the drying rate (DR). 385
The average and standard deviation of capillary coefficient, CC, drying rate, DR, and 386
drying index, DI, of the mortar samples prepared in different ways – waterproofing of 387
lateral surfaces with resin or polyethylene film and simple (without waterproofing) - are 388
presented in Table 4. 389
The capillary test showed that the preparation of the samples (without lateral 390
waterproofing or with polyethylene film or with resin) has an important influence on 391
results. For that reason, it seems to be very important to define the sample preparation 392
procedure if capillary requirements are considered. In terms of sample preparation, DR 393
results show the same tendency as CC; simple samples and resin samples show the 394
same tendency for DI and CC, while the samples with polyethylene present a different 395
tendency. 396
The mortars without mineral binder and with resin preparation used by Gomes et al. 397
(2012) presented a CC of 0.14 kg/(m2.s0.5) without fibers and 0.23 kg/(m2.s0.5) with 398
hemp fibers; their DI was 0.11 without fibers and 0.13 with hemp fibers. The period of 399
time for the determination of DI by Gomes et al. (2012) was not the same as that of the 400
present study and, also, the samples of the present study were not totally capillary 401
saturated before starting the drying test (for that reason, DI is not strictly comparable). 402
Nevertheless, when comparing the mortars characterized by Gomes et al. (2012) with 403
the ones of the present study, it can be observed that the latter have a much lower 404
capillary coefficient (0.5 kg/(m2.min0.5) corresponding to 0.06 kg/(m2.s0.5)), meaning that 405
the rising water progresses more slowly, but a higher drying index of 0.18, meaning 406
that total drying is achieved later. 407
408
Thermal conductivity and microstructure 409
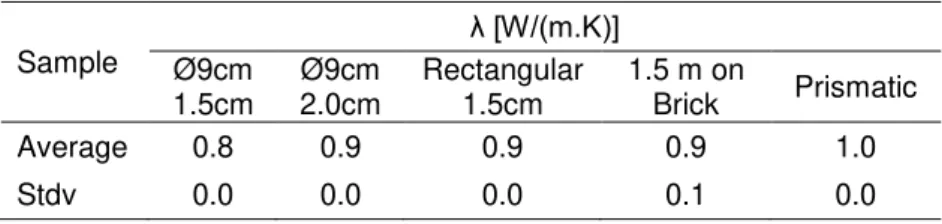
The thermal conductivity results (average and standard deviation for each type of 410
Independently of their type, all the samples had a value close to 0.9 W/(m.K), which 412
seems to be interesting for non-thermal plasters. Considering a 2-cm-thick plaster and 413
comparing it with a plaster with chemical binder (with thermal conductivity around 1.3 414
W/(m.K), the thermal resistance increase due to the earth plaster presented here would 415
be 0.04 (m2.K)/W. 416
Bulk density determined geometrically and from open porosity measured by MIP for the 417
prismatic samples, and MIP determinations for the mortar layer on brick and the plaster 418
on the outdoor protected experimental wall are given in Table 6. 419
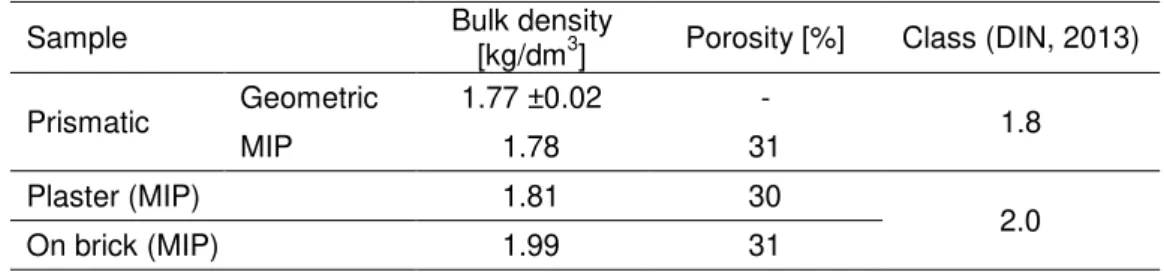
The plastering mortar can be placed in class 1.8 in terms of dry bulk density (DIN, 420
2013) because the bulk density is between 1.61-1.80 kg/dm3. The porosity determined 421
by MIP is quite similar for the different types of samples of the same mortar. 422
Incremental mercury porosimetry curves for specimens of prismatic mortar, mortar on 423
brick, and brick masonry plaster – for the whole range and only the lower part of the 424
range - are plotted in Fig. 10. The pore size diameter is expressed in microns and each 425
step of the mercury intrusion is in ml/g. 426
It can be observed from the curves of Fig. 10 (a) that both the mortar plaster on brick 427
masonry and the mortar on laboratory brick samples present almost the same 428
microstructure in terms of most frequent pore diameter (approximately 40 µm) and 429
differential mercury intrusion (approximately 0.20 ml/g). This shows that the mortar's 430
microstructure is not influenced by the environmental conditioning (in outdoor protected 431
conditions or in laboratory conditions) for the higher range of pores. The mortar 432
specimen from a prismatic sample presents a quite different microstructure, with most 433
frequent pore diameters at around 55 µm and 14 µm, with 0.18 ml/g and 0.12 ml/g 434
respectively. This bi-modal microstructure of the mortar applied without the influence of 435
a porous support, compared with samples of the same mortar but applied in contact 436
with ceramic brick, shows that the support has a notable influence on the mortar’s
437
microstructure. In fact the brick support increases the quantity of pores with larger 438
When the lower range of pores (Fig. 10b) is studied, two peaks can be observed: 440
around 6 µm mainly for the specimen from the prismatic sample and around 0.1 µm for 441
all samples. This is the range commonly recognized to have the most influence on the 442
capillary absorption of building materials (Mindess et al., 1981). However, this 443
statement is based on studies for cement-based materials and not specifically those on 444
earth mortars. For the latter type of mortars, the influence of the microstructure needs 445
to be studied in greater depth. 446
447
Conclusions
448
The workability achieved by both batches of the ready-mixed earth mortar was 449
excellent. Results of flow table consistency, wet bulk density and drying shrinkage 450
satisfied the requirements of DIN 18947 (DIN, 2013) for earth plasters even with 451
different mixing procedures. These tests seem appropriate for fresh state 452
characterization and demonstrate good stability of the characteristics with different 453
types of mixing equipment. 454
The mortar presents good mechanical characteristics when compared to air lime 455
mortars. It seems appropriate for application on historic walls (Veiga et al., 2010). The 456
resistance to abrasion is an issue that it is important to address for this type of mortars 457
but it is necessary to increase the detail of the test procedure mentioned in the DIN 458
18947 (DIN, 2013), namely in terms of the hardness of the brush used and the 459
assessment of the loss of weight, for comparability. 460
The mortar showed a very high adsorption capacity, and also the ability to desorb all 461
the water vapor adsorbed. The hygroscopic behavior of the mortar, and of similar 462
mortars analyzed by other authors, leads to the conclusion that this type of earth 463
mortars can indeed contribute to the hygrometric equilibrium and comfort inside 464
buildings. 465
The capillary absorption measurement is not a common requirement for this type of 466
important for some applications and uses. The definition of the lateral waterproofing of 468
the samples is crucial for comparison, as the results are more favorable when the 469
lateral waterproofing seems more efficient. Drying capacity can also be easily 470
assessed. The thermal conductivity does not seem as important for common plaster, 471
where the layers are not thick. 472
The dry bulk density determined geometrically is quite reliable. The microstructure is 473
also quite stable when the plaster is applied to different substrates (porous or metallic) 474
and under different environmental conditions (protected exterior or laboratory). 475
The ready-mixed mortar tested fulfilled all the DIN 18947 (DIN, 2013) requirements 476
assessed and showed an appropriate behavior when applied to a hollow brick test wall 477
in protected outdoor conditions. 478
It is expected that the results will contribute to a more generalized use of earth mortars 479
as plasters, or as renders in areas protected from rain, on historic but also on modern 480
masonries. The implementation of an international standard, where test procedures 481
and requirements were defined, would also help to achieve this goal. 482
483
Acknowledgements
484
The authors wish to acknowledge the EMBARRO company for supporting the earth 485
plaster workshop where the plaster was produced and are particularly grateful to Vitor 486
Silva for his help throughout the testing campaign. 487
488
References
489Azeredo, G., Morel, J.-C. (2008). “Applicability of rheometers to characterizing earth 490
mortar behavior. Part I: experimental device and validation.” Materials and Structures,
491
41, 1465-1472. Doi: 10.1617/s11527-007-9343-9 492
Cagnon, H., Aubert, J.E., Coutand, M., Magniont, C. (2014). “Hygrothermal properties 493
Danso, H., Martinson, B., Ali, M. & Mant, C. (2014). “Performance characteristics of 495
enhanced soil blocks: a quantitative review.” Building Research & Information. Doi: 496
10.1080/09613218.2014.933293 497
Darling, E., Cros, C., Wargocki, P., Kolarik, J., Morrosin, G., Corsi, R. (2012). “Impacts
498
of clay plaster on indoor air quality assessed using chemical and sensory 499
measurements.” Building and Environment, 57, 370-376. Doi:
500
10.1016/j.buildenv.2012.06.004 501
Delinière, R., Aubert, J.E., Rojat, F., Gasc-Barbier, M. (2014). “Physical, mineralogical 502
and mechanical characterization of ready-mixed clay plaster.“ Building and 503
Environment, 80, 11-17. Doi: 10.1016/j.buildenv.2014.05.012
504
DIN (2013). “DIN 18947 – Earth plasters – Terms and definitions, requirements, test
505
methods (in German)”, Berlin. 506
Drdácký, M., Lesák, J., Niedoba, K., Valach, J. (2014). “Peeling tests for assessing the 507
cohesion and consolidation characteristics of mortar and render surfaces.” Materials 508
and Structures. Doi: 10.1617/s11527-014-0285-8
509
CEN (1998/2006). EN 1015-1/A1. “Methods of test for mortar for masonry. Part 1: 510
Determination of particle size distribution (by sieve analysis)”, Brussels. 511
CEN (1999/2004/2006). EN 1015-3/A1/A2. “Methods of test for mortar for masonry. 512
Part 3: Determination of consistence of fresh mortar (by flow table)”, Brussels. 513
CEN (1998a). EN 1015-4. “Methods of test for mortar for masonry. Part 4: 514
Determination of consistence of fresh mortar (by plunger penetration)”, Brussels. 515
CEN (1999/2006a). EN 1015-6/A1. “Methods of test for mortar for masonry. Part 6: 516
Determination of bulk density of fresh mortar”, Brussels. 517
CEN (1998b). EN 1015-7. “Methods of test for mortar for masonry. Part 7: 518
Determination of air content of fresh mortar”, Brussels.
519
CEN (1999). prEN 1015-8. “Draft European Standard - Methods of test for mortar for 520
CEN (1999/2006b). EN 1015-10/A1. “Methods of test for mortar for masonry. Part 10: 522
Determination of dry bulk density of hardened mortar”, Brussels.
523
CEN (1999/2006c). EN 1015-11/A1. “Methods of test for mortar for masonry. Part 11: 524
Determination of flexural and compressive strength of hardened mortar”,Brussels. 525
CEN (2000). EN 1015-12. “Methods of test for mortar for masonry. Part 12: 526
Determination of adhesive strength of hardened rendering and plastering mortars on 527
substrates”, Brussels.
528
CEN (2002). EN 1015-18. “Methods of test for mortar for masonry. Part 18: 529
Determination of water absorption coefficient due to capillary action of hardened 530
mortar”, Brussels.
531
CEN (1998/2004). EN 1015-19/A1. “Methods of test for mortar for masonry. Part 19: 532
Determination of water vapour permeability of hardened rendering and plastering 533
mortars”, Brussels. 534
CEN (1998c). EN 1097-3. “Tests for mechanical and physical properties of aggregates. 535
Part 3: Determination of loose bulk density and voids”, Brussels. 536
CEN (2001). EN ISO 12572. “Hygrothermal performance of building materials and 537
products. Determination of water vapour transmission properties”, Brussels. 538
CEN (2004). EN 14146. “Natural stone test methods. Determination of the dynamic 539
modulus of elasticity (by measuring the fundamental resonance frequency)”, Brussels. 540
CEN (2009a). EN 15801. “Conservation of cultural property. Test methods. 541
Determination of water absorption by capillarity”, Brussels. 542
CEN (2009b). EN 15803. “Conservation of cultural property. Test methods. 543
Determination of water vapour permeability”, Brussels. 544
CEN (2014). EN 16322. “Conservation of Cultural Heritage. Test methods. 545
Determination of drying properties”, Brussels. 546
Faria, P., Henriques, F., Rato, V. (2008). “Comparative evaluation of aerial lime 547
mortars for architectural conservation”. Journal of Cultural Heritage, 9 (3), 338-346. 548
Faria, P., Santos, T., Silva, V. (2014). “Earth-based mortars for masonry plastering”. In: 550
9th International Masonry Conference (CD). 551
Gomes, M.I., Gonçalves, T.D., Faria, P. (2012). “Earth-based repair mortars: 552
experimental analysis with different binders and natural fibers.” In: Mileto, Vegas &
553
Cristini, editors. Rammed Earth Conservation 2012. London: Taylor & Francis, 661-554
668. 555
Gomes, M.I., Gonçalves, T.D., Faria, P. (2014). “Unstabilised rammed earth: 556
characterization of material collected from old constructions in South Portugal and 557
comparison to normative requirements.”International Journal of Architectural Heritage, 558
8, 185-212. Doi: 10.1080/15583058.2012.683133 559
Grilo, J., Faria, P., Veiga, R., Santos-Silva, A., Silva, V., Velosa, A. (2014). “New 560
natural hydraulic lime mortars. Physical and microstructural properties in different 561
curing conditions.” Construction Building Materials, 54, 378-384. Doi: 562
10.1016/j.conbuildmat.2013.12.078 563
Hamard, E., Morel, J.C., Salgado, F., Marcom, A., Meunier, N. (2013). “A procedure to 564
assess the suitability of plaster to protect vernacular earthen architecture.” Journal of 565
Cultural Heritage, 14, 109-115. Doi: 10.1016/j.culher.2012.04.005
566
Maddison, M., Mauring, T., Kirsimae, K., Mander, U. (2009). “The humidity buffer 567
capacity of clay-sand plaster filled with phytomass from treatment wetlands.” Building 568
and Environment, 44, 1864-1868. Doi: 10.1016/j.buildenv.2008.12.008
569
Melià, P., Ruggieri, G., Sabbadini, S., Dotelli, G. (2014). “Environmental impacts of 570
natural and conventional building materials: a case study on earth plasters.“Journal of 571
Cleaner Production, 80, 179-186. Doi: 10.1016/j.buildenv.2012.06.004
572
Mindess, S., Young, J.F., Darwin, D. Concrete. Englewood Cliffs, N. J.: Prentice-Hall 573
Inc.; 1981. 574
Pkla, A., Mesbah, A., Rigasse, V., Morel, J.-C. (2003). “Empirical comparison of testing 575
methods on measurements of the mechanical characteristics of soil mortars.” Materials
576
Röhlen, E., Ziegert, C. (2011). Earth building practice. 1st ed., Beuth Verlag GmbH, 578
Berlin. 579
Silveira, D., Varum, H., Costa, A., Carvalho, J. (2014). "Mechanical Properties and 580
Behavior of Traditional Adobe Wall Panels of the Aveiro District." Journal of Materials in 581
Civil Engineering. Doi: 10.1061/(ASCE)MT.1943-5533.0001194
582
Swan, A., Rteil, A., Lovegrove, G. (2011). ”Sustainable Earthen and Straw Bale 583
Construction in North American Buildings: Codes and Practice.” Journal of Materials in 584
Civil Engineering, 23(6), 866–872. Doi: 10.1061/(ASCE)MT.1943-5533.0000241
585
Veiga, R., Fragata, A., Velosa, A.L., Magalhães, A.C., Margalha, G. (2010). “Lime -586
based mortars: viability for use as substitution renders in historical buildings.” 587
International Journal of Architectural Heritage, 4, 177-195. Doi:
588
Figure captions
590
Fig. 1. Samples and tests performed. 591
Fig. 2. Capillary samples prepared with resin and cotton cloth (left) and with 592
polyethylene film inside the net basket (right). 593
Fig. 3. Dry particle size distribution of the ready-mixed mortar product. 594
Fig. 4. X-ray diffraction of global and fine samples of the ready-mixed product (Q - 595
quartz, F - K-Feldspar, D - dolomite, M – illite, K – kaolinite, C – calcite, H - hematite). 596
Fig. 5. Visual result of the cohesion test with material sticking to the adhesive tape. 597
Fig. 6. Abrasion relief of the circular mortar samples tested with brushes of different 598
hardness. 599
Fig. 7. Sorption and desorption of mortar samples. 600
Fig. 8. Capillary curves of mortar samples with different preparation, representative 601
segment of capillary absorption, their equation and correlation coefficient. 602
Fig. 9. Drying curves of mortar samples with different preparations, segments of initial 603
drying, their equation and correlation coefficient. 604
Fig. 10. Incremental mercury porosimetry curves – whole range (a) and only lower part 605
of the range (b). 606
Table 1. Characteristics of fresh mortars. 608
Fresh Mortar On site Laboratory
Flow table consistency [mm] 178.8±2.5 182.3±2.5 Slump by flow table [mm] - 14.2 Penetrometer consistency
[mm] - 2.4±0.1
Wet bulk density [kg/dm3] 2.03 2.11
Air content [%] 2.8 2.5
Water retention [%] - 67.5±1.3
Water content [%] 20.1±0.1 19.4±0.3 609
Table 2. Weight loss by abrasion and standard lower limits. 611
∆Wt [g] Ø9cm, 2cm Mortar on brick
Hard Medium Soft Hard Medium Soft
Average 18.1 3.9 0.3 11.2 4.5 -
StDv 3.1 0.5 0.0 2.2 0.5 -
SI (DIN, 2013) ≤1.5
SII (DIN, 2013) ≤0.7
Table 3. Dynamic modulus of elasticity, flexural, compressive and adhesive strength of 614
the mortar (average and standard deviation) and standard lower limits. 615
Dry Mortar Ed FStr CStr AStr
[N/mm2] [N/mm2] [N/mm2] [N/mm2]
Average 3610 0.3 1.1 0.15
Stdv 128 0.0 0.1 0.03
SI (DIN, 2013) - ≥0.3 ≥1.0 ≥0.05
SII (DIN, 2013) - ≥0.7 ≥1.5 ≥0.1
Table 4. Capillary coefficient, CC, drying rate, DR, and drying index, DI, of the mortar 618
(average and standard deviation). 619
Dry
mortar CC [kg/(m 2
.min0,5)] DR [kg/(m2.h)] DI [-]
Prepar. Resin Polyeth. Simple Resin Polyeth. Simple Resin Polyeth. Simple Average 0.50 0.86 1.84 0.30 0.33 0.64 0.18 0.22 0.14 Stdv 0.06 0.04 0.34 0.01 0.02 0.07 0.01 0.02 0.03 620
Table 5. Thermal conductivity of mortars for different types of samples (average and 622
standard deviation). 623
Sample
λ [W/(m.K)] Ø9cm
1.5cm
Ø9cm 2.0cm
Rectangular 1.5cm
1.5 m on
Brick Prismatic
Average 0.8 0.9 0.9 0.9 1.0
Stdv 0.0 0.0 0.0 0.1 0.0
Table 6. Open porosity, bulk density and standard class of mortar on a prismatic 626
sample, a plaster-on-brick sample and from the brick masonry plaster. 627
Sample Bulk density
[kg/dm3] Porosity [%] Class (DIN, 2013)
Prismatic Geometric 1.77 ±0.02 - 1.8
MIP 1.78 31
Plaster (MIP) 1.81 30
2.0
On brick (MIP) 1.99 31