ISSN 1678-6343 Programa de Pós-graduação em Geografia
Caminhos de Geografia Uberlândia v. 18, n. 64 Dezembro/2017 p. 454–471 Página 1 ENVIRONMENTAL MONITORING PLANNING IN RIVER BASINS: THE CASE OF PIG
FARMING IN RIVER PIRANGA BASIN
Marília Carvalho de Melo IGAM, Instituto Mineiro de Gestão das Águas (Minas Gerais Water Management Institute), Belo Horizonte, MG, Brazil marilia.melo@meioambiente.mg.gov.br
Raquel de Souza Mendes SEMAD, Secretaria de Meio Ambiente e Desenvolvimento Sustentável (Secretariat for Environmental and
Sustainable Development in Minas Gerais), Belo Horizonte, MG, Brazil raquel.souza@meioambiente.mg.gov.br
Marcelo da Fonseca SEMAD, Secretaria de Meio Ambiente e Desenvolvimento Sustentável, Belo Horizonte, MG, Brazil marcelo.fonseca@meioambiente.mg.gov.br
Flávio Augusto Aquino SEMAD, Secretaria de Meio Ambiente e Desenvolvimento Sustentável, Belo Horizonte, MG, Brazil flavio.aquino@meioambiente.mg.gov.br
Augusto Figueiredo Rodrigues SEMAD, Secretaria de Meio Ambiente e Desenvolvimento Sustentável, Belo Horizonte, MG, Brazil augusto.figueiredo.rodrigues@gmail.com
ABSTRACT
The integrated vision of the territory and understanding of how the anthropic activities influence the available natural resources is the key point for guiding the execution of inspection and environmental control actions which, when applied to river basins, directly influence the quality and/or quantity of water, thus affecting water availability. In 2013 an environmental inspection project was elaborated for pig farming activity in River Piranga's Planning and Management of Water Resources Unit (Unidade de Planejamento e Gestão de Recursos Hídricos - UPGRH), in which it encompassed the following phases: orientation, field of activity and monitoring of post-fiscal actions. The main objective of this article is to demonstrate the efficacy of the technical planning in river basins for the execution of environmental inspection. This is achieved by evaluating the water quality performance indicators before and after inspection activities, with the application of statistical tests. The continuous inspection reached its objective, which was to increase the environmental regularization in the basin, since 94.11% of the fined enterprises, that is, 16 out of 17, were regularized. The implementation of a directed monitoring network of water quality enabled, on the part of the entrepreneur, the acknowledgment that pig farming contributes to the increase of the thermotolerant coliforms parameter and not only the gap in sewage treatment in the region.
Keywords: Environmental inspection; Planning in river basins, monitoring.
PLANEJAMENTO DE FISCALIZAÇÃO AMBIENTAL EM BACIAS HIDROGRÁFICAS: O CASO DA SUINOCULTURA NA BACIA DO RIO PIRANGA
RESUMO
A visão integrada do território e o entendimento de como as atividades antrópicas influem nos recursos naturais disponíveis é o ponto chave para direcionar a execução das ações de fiscalização e controle ambiental, que aplicados as bacias hidrográficas influenciam diretamente na qualidade e/ou quantidade da água
Caminhos de Geografia Uberlândia v. 18, n. 64 Dezembro/2017 p. 454–471 Página 2 refletindo na disponibilidade hídrica. Foi elaborado, em 2013, um Projeto de fiscalização ambiental para a atividade de Suinocultura na UPGRH do Rio Piranga, o projeto contemplou as etapas de orientação, ação de campo e monitoramento pós ação fiscal. O objetivo geral deste artigo visa demonstrar a eficácia do planejamento técnico em bacias hidrográficas para a execução da fiscalização ambiental, por meio da avaliação de desempenho de indicadores de qualidade das águas antes e depois das ações fiscalizatórias, aplicando testes estatísticos. A fiscalização continuada atingiu seu objetivo de ampliar a regularização ambiental na bacia, uma vez que dos 17 empreendimentos autuados 16, ou seja, 94,11% se regularizaram. A implementação de uma rede de monitoramento dirigida de qualidade da água proporcionou, por parte do próprio empreendedor, o reconhecimento de que a suinocultura contribui com o aumento do parâmetro coliformes termotolerantes e não apenas a lacuna de tratamento de esgoto na região.
Palavras-chave: Fiscalização ambiental; Planejamento em bacias hidrográficas, monitoramento.
INTRODUCTION
The region known as Zona da Mata is among the most influential pig farming centers in the state of Minas Gerais and in Brazil. The realization came after the release of a mapping done by the Brazilian Pig Farmers Association (Associação Brasileira dos Criadores de Suínos - ABCS): the region concentrates 21% of the total number of pigs in Minas (NFTALLIANCE, 2016). This fact highlights the position of the region within the pig meat market, which is an important sector of the regional economy. However, these enterprises' operations generate pressure on the environment, especially regarding water quality, and therefore create the need for an environmental control of the activities (PÉRDOMO et al., 2001; MARQUES, 2001, FEAM, 2010).
Regarding environmental control, the fiscal activity proves to be a highly effective management instrument, examining the companies' operations, keeping track of the environmental performance of the operation, identifying irregularities and providing guidance on the best practices. Therefore, the inspection must be understood as a continuous process that promotes regularization and inhibits irregularities, and which includes guidance activities in the field and post-fiscal monitoring.
Thus, so the objectives can be met, the inspection must be technically planned, and grounded on databases and environment monitoring, which provide subsidies for environmental diagnoses in the territory and which will, in turn, guide the execution of the inspection activities. In this aspect, the integrated vision of the territory and the understanding of how the anthropic activities influence the available natural resources are the key points for the fiscal activity. Specifically for environmental activities, the river basin is the proper planning territorial unit, since it preserves environmental particularities and any anthropic activity in it will directly influence the water quality and/or quantity. This will affect the water availability, therefore representing an important environmental performance indicator in the territory.
That way, the Secretariat for Environmental and Sustainable Development in Minas Gerais (Secretaria de Meio Ambiente e Desenvolvimento Sustentável do Estado de Minas Gerais - SEMAD) has elaborated, since 2012, the Annual Inspection Plan (Plano Anual de Fiscalização - PAF), with its own methodology in which the top priority inspection activities are defined on the basis of Environmental Studies in the state of Minas Gerais. Such studies show the main environmental problems in the state, obtained through the monitoring of the natural resources conducted by the State Environmental System (Sistema Estadual de Meio Ambiente - SISEMA) and by the State Environmental and Water Resources Information System (Sistema Estadual de Informações Ambientais e de Recursos Hídricos - SIAM), in addition to academic data, citizen complaints and others. This practice is already showing positive results when it comes to the environmental inspection general results, such as a 4% decrease in the deforestation of the Atlantic forest biome, maximization of environmental regularization in the inspected types (sand extraction in Belo Horizonte's metropolitan area, quartzite extraction in the south region of
Caminhos de Geografia Uberlândia v. 18, n. 64 Dezembro/2017 p. 454–471 Página 3 Minas Gerais, etc.), decrease in the irregular use of water resources in regions with water shortage, etc.
Based on these premises, in 2013 an environmental inspection project for the pig farming activity in River Piranga's Planning and Management of Water Resources Unit (Unidade de Planejamento e Gestão de Recursos Hídricos - UPGRH) was elaborated, and which was called DO1, tributary of River Doce. The project was approved due to the activities concentrated on the basin and to the results obtained from the execution of PAF 2012, in which significant environmental pressures deriving from the pig farming center in the region were identified. Carvalho (2014) suggests that one of the ways to assess the pressure exerted by pig farming on the environment is to measure the concentration of pigs per area. This method is based on the principle that the pig density per area is directly proportional to the chances of environment contamination happening. Due to this concentration in Piranga valley, pig farming was identified as a strong environmental pressure factor in the UPGRH DO1 when the State Environmental Studies (Estudos Ambientais do Estado de Minas Gerais de 2012 - SEMAD, 2012) was elaborated. Additionally, Pena (2016) states that because of the growth in pig farming in the last decades and the volume of waste generated, the environment agencies consider pig farming as one of the biggest environmental problems, because such effluents do not receive any kind of proper treatment. (BARTHOLOMEU et al., 2006).
The inspection project in pig farming in the River Piranga basin, therefore, encompassed the orientation, field of activity and post-fiscal actions phases, in which the expected result was the improvement of environmental indicators in the basin, specially water quality, which is the kind of natural resource that is most impacted by the disposal of liquid effluents deriving from this activity.
The main innovation in the project object of this article was the implementation of a directed network in the basin to evaluate the performance of these activities during the project's execution period, also allowing that the efficacy of the fiscal action be verified. According to Simenov et. al. (2002) the monitoring of the water quality of a river must be prioritized in environmental policies, because it is through this monitoring that changes in the environment are identified, thus allowing adequacy of management and conservation of ecosystems measures (BARBOSA, 1994). In basins with anthropic activities and great polluting potential, as is the case of the River Piranga basin, that has an intense concentration of pig farming, such instrument is even more relevant, since the improper management of the waste from pig farming and its direct release into bodies of water can generate serious ecological imbalance due to, primarily, the reduction of oxygen dissolved in the water because of the presence of organic matter (PERDOMO et al., 2001).
With this context, the main objective of this paper is to demonstrate the efficacy of the technical planning in river basins for the execution of environmental inspection through performance assessment of water quality indicators, before and after inspection activities.
METHODOLOGY
CHARACTERIZATION OF THE RIVER BASIN
The studied region is located in the larger basin of the River Doce, UPGRH DO1 (Figure 1), River Piranga basin, with 17,571 Km2, 62 offices located totally inside its territory (and 701,842 inhabitants, about 20.5% of the population in Minas Gerais (IGAM, 2010). River Piranga starts in the municipality of Ressaquinha, and runs for 470 kilometers. The urban population is prevalent in the basin, representing 64%. The municipalities that stand out are Viçosa (70,400 inhabitants), Ponte Nova (55,680 inhabitants), Ouro Preto (50,963 inhabitants) and Mariana (50,931 inhabitants), the last two being the ones that only have part of their territory outside UPGRH DO1. It is important to know that for the municipalities that present greater population density the trend is population growth, contrary to other municipalities in the basin, which present a decrease in this density (FEAM, 2015).
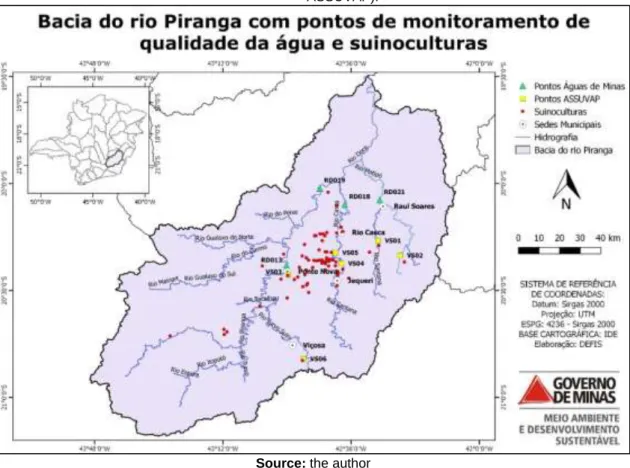
Caminhos de Geografia Uberlândia v. 18, n. 64 Dezembro/2017 p. 454–471 Página 4 Figure 1. Map showing the River Doce basin, highlighting the River Piranga basin.
Source: the author
Economically, the service sector prevails, followed by industry and animal agriculture. The livestock sector occupies 53% of the unit's area, with emphasis on pig farming, the type of activity that demands control actions and waste treatment. Agriculture, on the other hand, occupies 41% of the territory. The region exhibits high erosion susceptibility in 53% of its land, and this situation, together with the improper use of soil and deforesting, leads to a high sediment yield (CBH-Piranga, 2017).
According to the Plan for the Increase of Percentage for Sanitary Sewers Treatment in River Piranga Basin (Plano para Incremento do Percentual de Tratamento de Esgotos Sanitários na Bacia Hidrográfica do Rio Piranga), elaborated in 2015 (FEAM, 2015), most of the municipalities in UPGRH DO1 has less than 10,000 inhabitants, in which more than 90% of the population has no sewage treatment of any kind. Still according to this Plan, 69 municipalities release, partially or fully, treated or not, their generated waste in the basin's bodies of water.
It should be highlighted that River Piranga, as the river that forms River Doce, together with River do Carmo, has gained more importance in maintaining good quality of the waters for the entire River Doce basin due to the accident in 2015, when a tailings dam collapsed in the municipality of Mariana. Even with the confluence located 58 kilometers away from where the accident happened, River Piranga contributes with a significant flow rate input, allowing for the dilution of sediments released in the River do Carmo and originated from the collapsed dam. With respect to the water quality in the studied basin, Igam, in its monitoring program called Águas de Minas, operates 15 sampling stations, with a historic series available since 1997. As shown by the analysis of the results from the Quality of Waters Index (Índice de Qualidade das Águas – IQA) in these stations in the 2012-2015 period, which reflect the contamination of the waters due to organic and fecal matters, solids and nutrients, an increase in the Good class from 2013 on (Figure 2) can be noticed. It should be stressed that the occurrence of Very Bad quality has not been observed since 2012, and the condition Excellent was registered in 1% of the samples in 2014 (IGAM, 2016).
Caminhos de Geografia Uberlândia v. 18, n. 64 Dezembro/2017 p. 454–471 Página 5 Figure 2. Percentage distribution of IQA's range in UPGRH DO1, 2012 to 2015.
Source: IGAM (2016).
IQA's evaluation is justified by the fact that the effluents of a pig farm basically consist of feces, urine, water, food residue, etc. (CARVALHO, 2014), which contain high deposits of organic matter, nitrogen, phosphorus, potassium, calcium, sodium, magnesium, manganese, iron, zinc, copper and other elements, and which are included in the animals' diet (LUDKE; LUDKE, 2002). This can be proved by the fact that the average farms' effluent population, in terms of DBO, is 3.5 inhabitants per pig (LINDNER, 1999, apud MIRANDA, 2005). Moreover, the volume of waste produced is high and is due to the fact that, on average, for each liter of water that is consumed by one pig, 0.6 liters of waste is generated (SOUZA et al., 2008 apud CARVALHO, 2014).
INSPECTION PROJECT
Because pig farming appeared as a pressure point, PAF 2012 considered the Special Environmental Inspection Operation in Pig Farming (Operação Especial de Fiscalização Ambiental Suinocultura) in river Piranga's basin, as a mechanism to reverse the situation. The operation's planning took into consideration preventive actions whose purpose were to provide guidance to pig farmers on how important it is to develop the activity in a way that is environmentally adequate, thus giving them opportunities to become regularized. Public meetings were held and coordinated by the Secretariat, in Ubá, with the Zona da Mata Regional Collegiate Unit (Unidade Regional Colegiada Zona da Mata - URC-ZM), in Ponte Nova, with the Water Basin Committee (Comitê de Bacia Hidrográfica - CBH-Piranga) and with entrepreneurs from the region through agencies such as the Minas Gerais State Industry Federation (Federação das Indústrias do Estado de Minas Gerais - FIEMG) and pig farmers associations. Thus, in 2012, after guidance and awareness activities, an inspection called Special Inspection Operation in Pig Farming (Operação Especial de Fiscalização Suinocultura) was performed, in which it was possible to determine that most of the inspected pig farmers were in an irregular situation and contributed to the environmental pollution of the bodies of water in the region. In this context, the Secretariat structured, in 2013, a continuous and preventive inspection project together with the Piranga Valley Pig Farmers Association (Associação dos Suinocultores do Vale do Piranga - ASSUVAP), which has 73 registered pig farmers, enabling a differentiated action based on providing guidance to entrepreneurs and monitoring of the water and effluents quality, for the assessment of environmental performance of field inspections activities.
This project started with the monitoring of the results from this 2012 Special Operation, and culminated in a four-year planning, whose final objective was the improvement of the environmental quality through the implementation of sustainable practices in pig farming.
13% 20% 1% 5% 78% 51% 58% 56% 8% 30% 40% 40% 1% 0% 100% 2012 2013 2014 2015
Caminhos de Geografia Uberlândia v. 18, n. 64 Dezembro/2017 p. 454–471 Página 6 The projects' phases are described as follows:
Environmental Inspection Operations and access to pig farmers
As mentioned before, the first inspection was conducted in 2012, with 13 inspected enterprises, when a great number of irregularities were observed, so these enterprises were monitored regarding their regularization until the end of the project.
Due to this scenario, it was decided that annual operations and periodic meetings with ASSUVAP would take place in the region so as to strengthen the partnership between the environmental agency and the sector. During the project five environmental inspection operations were conducted in the basin. The inspected enterprises were selected according to the identified pressure areas and also according to requirements from the Public Prosecutor's Office and the Judiciary, demands made by the Zona da Mata Regional Environment Superintendence (Superintendência Regional de Meio Ambiente da Zona da Mata), environmental reports and irregular enterprises identified by means of overflight.
Qualifications
One of the identified issues, while monitoring the region, was the lack of knowledge, on the part of the entrepreneurs, of environmental control techniques, especially the ones regarding management of residues, as well as the need for a qualified team involved in the execution of the project. In order to solve this problem, a partnership with the Preventive Veterinary Medicine Department (environmental control and sanitation) of UFMG Veterinary School (Departamento de Medicina Veterinária Preventiva [controle ambiental e saneamento] da Escola de Veterinária da Universidade Federal de Minas Gerais - UFMG) was established, so that speeches and qualification courses could be held. The following qualification courses were conducted:
Extension course for environmental inspectors in 2014, in partnership with UFMG - “Treatment of wastewater in pig farming (Tratamento de águas residuárias de suinocultura)”. The course promoted better technical performance on the inspectors' part throughout the project, both identifying irregularities and providing guidance to pig farmers.
Environmental workshop held by SEMAD, UFMG and ASSUVAP in 2015 in the city of Ponte Nova - “Searching for sustainable development in Piranga Valley” (Em busca do desenvolvimento sustentável no Vale do Piranga), whose objective was to discuss alternatives and new technologies regarding the treatment and disposal of liquid effluents and solid residues from pig farming and a way to improve producers' concepts and techniques to reduce environmental impact. The event enabled a dialogue between entrepreneurs, the community, SEMAD environmental analysts and managers, and the academic community on the problems and solutions connected to pig farming.
Monitoring of enterprises that were fined in the 2012 Pig Farming Operation One indicator of the effectiveness of a fiscal action is the maximization of regularization, which can be assessed when we evaluate the percentage of irregular enterprises, the percentage of the ones that were fined and which, after that, formalized the request for environmental licensing. In this sense, the enterprises that had notices of infraction issued in 2012 were monitored, through SIAM, with the objective of verifying if the enterprise regularized its activity.
Control and self-monitoring systems evaluation (2012)
During an operation conducted in 2012, inspectors identified some enterprises whose effluents showed organoleptic characteristics that raised doubts regarding minimum efficacy of the treatment system.
Due to this, requests were made to the Technological Center Foundation of the State of Minas Gerais (Fundação Centro Tecnológico de Minas Gerais - Cetec/MG) for analysis of water samples from bodies of water that receive these effluents. Samples were taken from 22 points, between August 7th and 10th, 2012, and the analyzed parameters were the following: calcium, copper, potassium, magnesium, sodium, total zinc, total phosphorus, total Kjeldahl nitrogen, Biochemical Oxygen Demand (Demanda Bioquímica de Oxigênio - DBO), Chemical Oxygen Demand (Demanda Química de Oxigênio - DQO), dissolved oxygen (oxigênio dissolvido - OD),
Caminhos de Geografia Uberlândia v. 18, n. 64 Dezembro/2017 p. 454–471 Página 7 oils and grease, pH, total of dissolved solids, total of suspended solids and settleable solids. The results were compared with the limits established in the Joint Regulatory Deliberation (Deliberação Normativa Conjunta COPAM/CERH 01/08 - MINAS GERAIS, 2008) for Class 2, and compared to minimum, medium and maximum values of the historical series monitoring of Águas de Minas Project/IGAM in 14 UPGRH DO1 sampling stations.
The results of water quality parameters, in a sampling conducted by CETEC/MG in 22 points, were non-compliant with the legislation regarding total phosphorus, OD, DBO, total zinc, SDT and SST. Fail to comply with the Regulatory Deliberation (Deliberação Normativa COPAM/CERH 01/08 - MINAS GERAIS, 2008), occurred in 13 enterprises out of the 22 that were evaluated. The most critical points for DBO and OD are located near Sítio Boa Vista/Piglândia and Granja Soares. In addition to that, 3 enterprises exceeded the maximum value for DBO seen in the historical series available in UPGRH DO1. The SST and SDT showed high values, exceeding the legal limits, as well as the maximum value in IGAM's monitoring period in the basin, in the sampling points located near the enterprises called Granja Soares and Sítio Boa Vista/Piglândia, respectively. The same way, the values for total zinc found in these two sampling points exceeded the legal limit. And, in one of the points, the concentration exceeded the maximum.
During inspection reports regarding self-monitoring in three enterprises were analyzed, and the monitoring results in these reports showed no irregularities. Contrary to what was suggested by the results obtained from the sampling conducted by CETEC/MG. As part of their defense process after inspection, one enterprise presented counter proof in which it was verified that six, out of the nine evaluated parameters, were in compliance with the legislation: total ammoniacal nitrogen, total settleable solids and suspended solids, DBO, soluble copper and total phosphorus. It was verified that five out of the nine evaluated parameters were in compliance with the legislation, and it was recommended that the next parameter results should be monitored as follows: total ammoniacal nitrogen, total settleable solids and suspended solids, DBO, soluble copper and total phosphorus.
Water quality monitoring
Based on the results exhibited by the 2012 monitoring campaign conducted by CETEC, in IGAM's basic network monitoring evaluation, and on the discrepancies observed in some of the data from enterprises' self-monitoring, it was decided that a water quality control network should be established in the region so as to give continuity to the monitoring process regarding the impact of pig farming on bodies of water, and to evaluate the effectiveness of inspection and control actions performed in the region. Thus, the implementation of a network directed at monitoring the basin was proposed to ASSUVAP.
The first proposed network would rely on collections and analysis performed in raw and treated effluents of seventy-four enterprises, in addition to six sampling points located in five bodies of water in the region. However, due to budget restrictions made by the Association, it was decided the control would be performed only in the bodies of water. Thus the directed monitoring network was planned by the Secretariat, kept by ASSUVAP and executed by a laboratory recognized/approved by the Metrology Network of Minas Gerais (Rede Metrológica de Minas Gerais).
MONITORING AND ENVIRONMENTAL INDICATORS
Of the described phases, the current paper focus on the evaluation of the monitoring results, with project performance indicator, since the water quality is the main factor of environmental pressure exerted by the activity.
It is important to highlight that the Regulatory Deliberation (Deliberação Normativa COPAM nº 74/2004 - MINAS GERAIS, 2004), which establishes criteria for the classification of enterprises and activities that modify the environment, lays down that the pig farming activity has great potential for polluting/degrading the water. In this deliberation the activity is divided in: complete cycle (G-02-04-6), growth and termination (G-02-05-4), and pig production unit (G-02-06-2). So, the water quality was established as an indicator of effectiveness of the project, and the results
Caminhos de Geografia Uberlândia v. 18, n. 64 Dezembro/2017 p. 454–471 Página 8 were compared to the legal limits established in the Regulatory Deliberation (Deliberação Normativa COPAM/CERH 01/08 - MINAS GERAIS, 2008), for the classes.
The directed monitoring network implemented in the project had 6 sampling points in 5 water courses (Table 1 and Figure 3), using as selection criterion their proximity to the pig farms.
Table 1. Coordinates of ASSUVAP's monitoring network.
Code Description LAT LONG
VS01 River Santana, downstream Abre Campo 20016’02.12” 42028’25.24”
VS02 River Matipó, upstream Matipó 20020’10.87” 42022’15.00”
VS03 Stream near BR120, upstream Ponte Nova 20025’34.09” 42053’37.57” VS04 Rio Casca, between Santo Antônio do Grama and Jequeri 20022’25.25” 42038’45.00” VS05 Rio Casca, between Santo Antônio do Grama, Jequeri and
Urucânia 20
019’23.02”
42040’22.84” VS06 Stream near Sítio Boa Vista/Piglândia 20049’11.55” 42049’20.07”
Figure 3. ASSUVAP, Igam and pig farmers network monitoring points in the region (registered in ASSUVAP).
Source: the author
In order to promote the control of the activity, the following parameters were analyzed: temperature, pH, OD, DBO, DQO, total phosphorus, total ammoniacal nitrogen, SDT, SST, settleable solids (materials), dissolved copper and total zinc (indicators of possible pig food residue) in 12 campaigns. Four quarterly samplings were performed, representing the rainy, dry and intermediary seasons, for three years in a row (Table 2).
Table 2. Period and frequency of samplings.
Sampling Between the following months Year
1 January, February and March 2014, 2015 and 2016
2 April, May and June 2014, 2015 and 2016
Caminhos de Geografia Uberlândia v. 18, n. 64 Dezembro/2017 p. 454–471 Página 9
4 October, November and December 2014, 2015 and 2016
In order to guarantee an integrated vision of the Piranga Valley, and promote the evaluation of other types of pressure that may intervene with the waters, mainly between the municipalities of Jequeri, Ponte Nova and Rio Casca (Figure 2), the results obtained in ASSUVAP's directed monitoring network were compared to those obtained in four water quality monitoring stations from the network that is part of the Águas de Minas Program/IGAM (Table 3). These points were selected because they are the ones closest to ASSUVAP's monitoring points (Figure 2).
Table 3. IGAM's monitoring network sampling stations.
Code Description LAT LONG
RD013 River Piranga, downstream Ponte Nova 20°22'59.00" 42°54'08.00" RD018 Rio Casca, in the district of Águas Férreas 20°05'53.00" 42°37'47.00" RD019 River Doce, downstream Rio Casca's mouth 20°01'18.00" 42°44'45.08" RD021 River Matipó, downstream the city of Raul Soares 20°04'35.00" 42°27'58.00" In addition, aiming at making sure there is a reduction in pig farming as contributor to the punctual pollution of Rivers Piranga and Casca, statistical tests were applied to the results from points located in the rivers Piranga, downstream Ponte Nova, and Casca, in the district of Águas Férreas. Since thermotolerant coliforms/Escherichia Coli and total phosphorus were the parameters that showed more divergent values in both monitoring networks (IGAM and directed network), we opted for applying the nonparametric test Mann-Whitney on the results of these parameters. Therefore, a comparison between results obtained for five years prior to the first SEMAD's actions, from 2007 to 2011, and those obtained for 5 years after that, that is, from 2012 to 2016, in sampling points RD013 and RD018 from IGAM's network, was performed. For the hypothesis test the samples were divided into two groups, in which the median η₁ of the data from 2007 to 2011 was tested in comparison to the median η₂ of the data from 2012 to 2016. In case of improvement of water quality levels, the median η₂ should be lower than the median η₁, that is, η₁ - η₂ should be higher than 0.
For the tests were defined levels of significance of 95%, thus the test value should be lower than 0.05 so we can establish the null hypothesis, otherwise the alternative hypothesis that indicates some improvement in the levels of water quality in the analysis periods could be accepted.
RESULTS AND DISCUSSION
ENVIRONMENTAL INSPECTION OPERATIONS
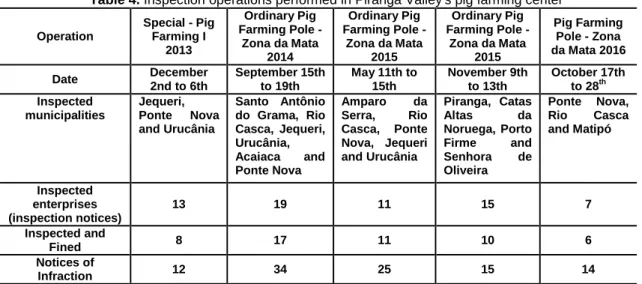
The inspection operations executed in the project are shown in Table 4. The main irregularities identified throughout the operations were of enterprises operating with authorization documents incompatible with their size or documents without environmental licensing, irregular use of water resources, release of liquid effluents with no adequate treatment in a body of water or disposal in lagoons (or tanks) without waterproofing work, non-compliance to environmental licensing constraints, inadequate disposal of solid residues and failure in regularize the activities associated with the pig farming activity (sawmills and food manufacturers).
Caminhos de Geografia Uberlândia v. 18, n. 64 Dezembro/2017 p. 454–471 Página 10 Table 4. Inspection operations performed in Piranga Valley's pig farming center
Operation Special - Pig Farming I 2013 Ordinary Pig Farming Pole - Zona da Mata 2014 Ordinary Pig Farming Pole - Zona da Mata 2015 Ordinary Pig Farming Pole - Zona da Mata 2015 Pig Farming Pole - Zona da Mata 2016 Date December 2nd to 6th September 15th to 19th May 11th to 15th November 9th to 13th October 17th to 28th Inspected municipalities Jequeri, Ponte Nova and Urucânia Santo Antônio do Grama, Rio Casca, Jequeri, Urucânia, Acaiaca and Ponte Nova Amparo da Serra, Rio Casca, Ponte Nova, Jequeri and Urucânia Piranga, Catas Altas da Noruega, Porto Firme and Senhora de Oliveira Ponte Nova, Rio Casca and Matipó Inspected enterprises (inspection notices) 13 19 11 15 7 Inspected and Fined 8 17 11 10 6 Notices of Infraction 12 34 25 15 14
According to SIAM, with the monitoring of the enterprises that were inspected in 2012, it was observed that out of 17 fined enterprises in 2012, 16 enterprises obtained their activity environmental regularization as far as May 2017, that is, 94.11% regularized their activities before the competent environmental agency. This result demonstrates that the fiscal action has a boosting effect in environmental regularization, as observed by Fonseca (2008).
Out of the 16 enterprises that regularized their activities, only 3 were fined again during the inspection activities conducted in 2014 and 2015. These are examples that demonstrate the need for the development of continuous inspection activities. On the other hand, we noticed that one enterprise initiated the regularization process before being inspected in 2012, which suggests that previous knowledge of the inspection action, as well as educational actions, can promote environmental regularization.
Another result observed in field actions conducted by SEMAD's agents was that, with the development of the project, it was possible to perceive a reduction in effluents' disposal in the bodies of water in the region, in which fertigation is used as an alternative for effluents management. This fertilization technique uses pig wastewaters to apply nutrients to cultivated soil, aiming at reducing the use of synthetic agricultural fertilizers. In addition, this reuse technique also promotes the decomposition/inactivation of materials potentially harmful to the environment during percolation on the soil (EPA, 2012). However, due control must be established, and it must be performed following technical guidelines so as to avoid environment contamination, which can cause alterations in the soil and groundwater.
WATER QUALITY MONITORING
The non-compliant parameters shown in ASSUVAP's Reports (2014, 2015 and 2016) are presented in Table 5.
Table 5. Non-compliant parameters in 2014, 2015 and 2016, according to reports from ASSUVAP; dry season (D*), rainy season (R*) and intermediary season (I*), according to reports from ASSUVAP.
Sampling Parameter VS01 VS02 VS03 VS04 VS05 VS06 TOTAL of Violation s per Quarter TOTAL of Violation s per Year Jan/14 Phosphorus - Total
Limit Class 2 mg / L P (up to 0.03 for lentic surroundings, up to 0.05 for intermediary surroundings and up to 0.1 for lotic 0.12 0.13 0.17 0.17 0.25 0.45 6 2014 = 14 Apr/14 0.11 - - - - 5.58 2 Oct/14 0.26 0.13 0.2 0.2 0.14 0.46 6 Jan/15 0.17 0.14 0.18 0.2 0.24 0.41 6 2015 = 19 Apr/15 0.13 - 0.24 0.19 0.14 0.31 5
Caminhos de Geografia Uberlândia v. 18, n. 64 Dezembro/2017 p. 454–471 Página 11 Jul/15 surroundings) 0.21 0.18 0.29 0.15 0.24 0.28 6 Oct/15 - - - - 0.12 0.16 2 Jan/16 - 0.31 0.36 0.21 0.29 3.08 5 2016 = 21 Apr/16 0.15 0.55 0.42 0.12 0.31 1.20 6 Jul/16 0.18 0.14 - - 0.13 0.33 4 Oct/16 0.32 0.29 0.72 0.13 0.11 0.12 6 TOTAL 9 8 8 8 10 11 54 C*= 17 S*= 10 I*= 27 Jan/14 DBO Limit Class 2 Up to 5 mg / L O2 - - - 8.46 1 2014 = 3 Apr/14 - - - 9.87 1 Jul/14 - - - 13.6 1 Jan/16 - - - 27.66 1 2016 = 6 Apr/16 - 5.55 - - - - 1 Jul/16 5.49 - - - 1 Oct/16 5.28 5.07 6.90 - - - 3 TOTAL 2 2 1 0 0 4 9 C*= 2 S*= 2 I*= 5 Apr/14 Ammoniacal nitrogen Limit Class 2 mg / L N (3.7 p/ pH <= 7.5 2.0 p/ 7.5<pH<=8.0 1.0 p/ 8.0<pH<=8.5 0.5 p/ pH>8.5) - - - 23.28 1 2014 = 1 Oct/15 - - - 3.75 1 2015 = 1 Jan/16 - - 2.68 - - 3.28 2 2016 = 2 TOTAL 0 0 1 0 0 3 4 C*= 2 S*= 0 I*= 2 Jan/14 OD Limit Class 2 Minimum 5 mg / L O2 - - - 1.25 1 2014 = 5 Apr/14 - - - 0.29 1 Jul/14 - - - 3.15 1 Oct/14 - 4.28 1.52 - - - 2 Jan/15 - - - 0.91 1 2015 = 2 Jul/15 - - - 2.5 1 TOTAL 0 1 1 0 0 5 7 C*= 2 S*= 2 I*= 3 Jan/14 Suspended Solids Limit Class 2 Up to 100 mg / L - - - 335 1 2014 = 3 Apr/14 - - - 205 1 Oct/14 - - - 352 1 Jan/15 - - - 118 1 2015 = 1 Jan/16 - - 270 - - - 1 2016 = 1 TOTAL 0 0 1 0 0 4 5 C*= 3 S*= 0 I*= 2 Jan/14 Turbidity Limit Class 2 Up to 100 UNT - - - 444 1 2014 = 2 Apr/14 - - - 201 1 Jan/16 - - 359 - - - 1 2016 = 2 Apr/16 - 203 - - - - 1 TOTAL 0 1 1 0 0 2 4 C*= 2 S*= 0 I*= 2 Jan/14 Zinc - - - 0.59 1 2014 = 5
Caminhos de Geografia Uberlândia v. 18, n. 64 Dezembro/2017 p. 454–471 Página 12 Apr/14 Limit Class 2
Up to 0.18 mg / L Zn - - - 2.58 1 Jul/14 0.194 0.201 - - - 0.50 3 TOTAL 1 1 0 0 0 3 5 C*= 1 S*= 3 I*= 1 Jan/14 Soluble copper Limit Class 2 Up to 0.009 mg / L Cu 0.054 - 0.055 - - 0.12 3 2014 = 15 Apr/14 0.012 - - 0.011 0.022 0.16 4 Jul/14 0.021 0.025 - - 0.029 0.26 4 Oct/14 - - 0.051 0.024 0.016 0.06 4 Jan/15 - - - 0.02 1 2015 = 4 Apr/15 - - - 0.02 1 Jul/15 - - - 0.01 1 Oct/15 - - - 0.012 1 Jan/16 - - 0.025 - - - 1 2016 = 3 Apr/16 - 0.025 - - - 0.014 2 TOTAL 3 2 3 2 3 9 22 C*= 5 S*= 5 I*= 12 Apr/14 Total nitrogen Limit Class 2 mg / L (up to 1.27 for lentic surroundings and 2.18 for lotic
surroundings) - - - 25.06 1 2014 = 1 TOTAL 0 0 0 0 0 1 1 C*= 0 S*= 0 I*= 1 Oct/14 pH Limit Class 2 6 to 9 range - - 5.97 - - - 1 2014 = 1 TOTAL 0 0 1 0 0 0 1 C*= 0 S*= 0 I*= 1 Jan/14 Therm. Coliforms/Escherichi a Coli Limit Class 2 Up to 1000 NMP / 100 ml 4100 3200 6500 - 3500 6900 5 2014 = 23 Apr/14 13400 6300 1260 0 1600 8900 1980 6 Jul/14 31200 3000 1245 0 7410 1600 20500 6 Oct/14 8000 7100 1600 0 4900 2800 3500 6 Jan/15 9500 15000 - - 6400 - 3 2015 = 17 Apr/15 5300 10000 1500 1200 3400 - 5 Jul/15 34000 13000 7000 - 2000 1700 5 Oct/15 250000 28400 1400 - - 1300 4 Jan/16 62000 6400 4800 0 1500 2300 140000 0 6 2016 = 17 Apr/16 280000 110000 4200 - 4300 - 4 Jul/16 360000 95000 4500 1000 - - 4 Oct/16 200000 38000 2000 - - - 3 TOTAL 12 12 11 6 9 7 57 C*= 14 S*= 15 I*= 28 TOTAL Violations per point 27 27 28 16 22 49 169 2014 = 73, 2015 = 44 and 2016 = 52 C*= 48 S*= 37 I*= 84 It is possible to see in Table 5 that all the monitoring points showed at least one parameter with value above the legal limit. We have thermotolerant coliforms/Escherichia Coli with the highest
Caminhos de Geografia Uberlândia v. 18, n. 64 Dezembro/2017 p. 454–471 Página 13 number of violations (57 violations), followed by total phosphorus (54 violations) and the soluble copper parameter (22 violations). Regarding the sampling stations, we have the following, in descending order: VS06 (49), VS03 (28), VS01 and VS02 (both with 27), VS05 (22) and VS04 (16).
Overall, we can notice fewer violations in 2015 (44) and 2016 (52) in comparison with 2014 (73), a result that can be associated with the continuity of inspection activities in the region. It can also be observed greater contribution from diffuse pollution when we compare the amount of violations in January, February and March (48), in rainy season, with the amount of violations in periods of drought: July, August and September (37). It is important to know that in October, when it is possible to notice the maximum effect of the dry season on the waters, 40 violations were issued. Again, it is possible to see from the results that there is a tendency for improvement of the punctual pollution in the dry season (third quarter) during the execution of the project: violations per year - 2014 (20), 2015 (8) and 2016 (12).
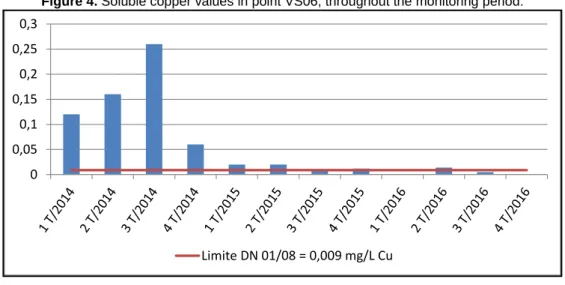
It should be highlighted that soluble copper (Figure 4) and zinc, possible indicators of pig food residue, showed, together, 20 violations in 2014, 4 in 2015 and only 3 violations in 2016. In this case, the reduction in the environmental pressure exerted by pig farming activities in the degradation of water quality throughout the monitoring becomes clearer.
Figure 4. Soluble copper values in point VS06, throughout the monitoring period.
A comparison of the results of non-compliant variables, in the directed monitoring network (Table 5) was conducted against the ones from four IGAM's monitoring stations. The unifilar diagram in Figure 5 shows IGAM's monitoring points, the directed network, the water courses in the analyzed basin and the municipal head offices.
Figure 5. Diagram with the location of the sampling points
Source: SEMAD (2014). 0 0,05 0,1 0,15 0,2 0,25 0,3
Cobre solúvel no VS06
Limite DN 01/08 = 0,009 mg/L Cu Rio Casca RD018 RD021 Rio Piranga/Doce RD019 VS04 VS02 Ponte Nova RD013 VS03 VS05 VS01 Jequeri Raul Soares Rio MatipóRio Turvo Limpo
VS06
Rio Turvo Rio Turvo Sujo
Rio do Paraíso Viçosa Piglândia Rio Casca Rio Santana Monitoring points Head offices
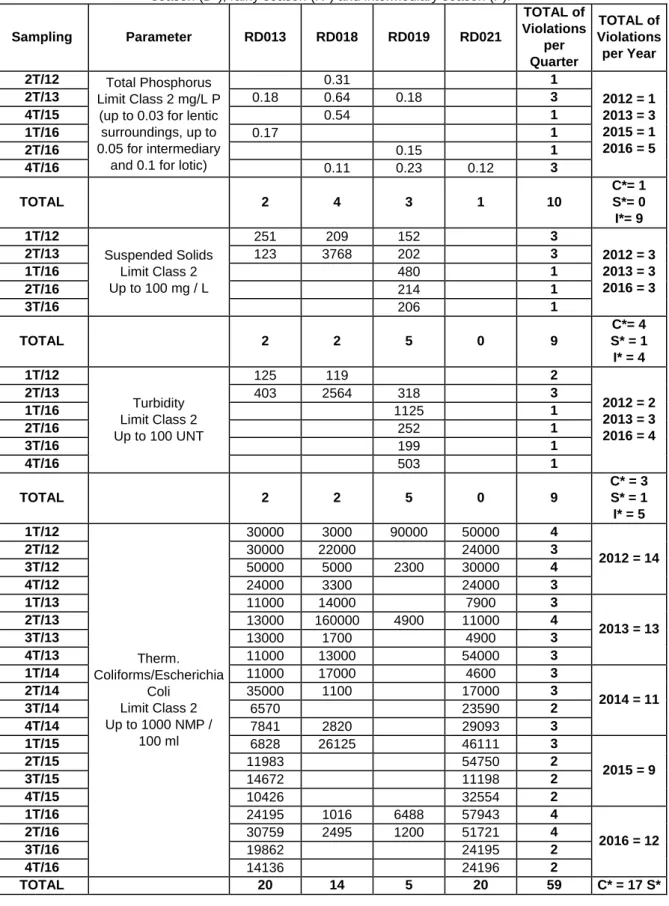
Caminhos de Geografia Uberlândia v. 18, n. 64 Dezembro/2017 p. 454–471 Página 14 IGAM's monitoring network is operated since 1997, however, taking into consideration the objectives of this paper, the years of 2012 (when the first Special Operation took place), 2013, 2014, 2015 and 2016 (Table 6) were evaluated.
Table 6. Non-compliant parameters in Águas de Minas Program/IGAM stations evaluated in this study. Dry season (D*), rainy season (R*) and intermediary season (I*).
Sampling Parameter RD013 RD018 RD019 RD021 TOTAL of Violations per Quarter TOTAL of Violations per Year 2T/12 Total Phosphorus Limit Class 2 mg/L P (up to 0.03 for lentic
surroundings, up to 0.05 for intermediary
and 0.1 for lotic)
0.31 1 2012 = 1 2013 = 3 2015 = 1 2016 = 5 2T/13 0.18 0.64 0.18 3 4T/15 0.54 1 1T/16 0.17 1 2T/16 0.15 1 4T/16 0.11 0.23 0.12 3 TOTAL 2 4 3 1 10 C*= 1 S*= 0 I*= 9 1T/12 Suspended Solids Limit Class 2 Up to 100 mg / L 251 209 152 3 2012 = 3 2013 = 3 2016 = 3 2T/13 123 3768 202 3 1T/16 480 1 2T/16 214 1 3T/16 206 1 TOTAL 2 2 5 0 9 C*= 4 S* = 1 I* = 4 1T/12 Turbidity Limit Class 2 Up to 100 UNT 125 119 2 2012 = 2 2013 = 3 2016 = 4 2T/13 403 2564 318 3 1T/16 1125 1 2T/16 252 1 3T/16 199 1 4T/16 503 1 TOTAL 2 2 5 0 9 C* = 3 S* = 1 I* = 5 1T/12 Therm. Coliforms/Escherichia Coli Limit Class 2 Up to 1000 NMP / 100 ml 30000 3000 90000 50000 4 2012 = 14 2T/12 30000 22000 24000 3 3T/12 50000 5000 2300 30000 4 4T/12 24000 3300 24000 3 1T/13 11000 14000 7900 3 2013 = 13 2T/13 13000 160000 4900 11000 4 3T/13 13000 1700 4900 3 4T/13 11000 13000 54000 3 1T/14 11000 17000 4600 3 2014 = 11 2T/14 35000 1100 17000 3 3T/14 6570 23590 2 4T/14 7841 2820 29093 3 1T/15 6828 26125 46111 3 2015 = 9 2T/15 11983 54750 2 3T/15 14672 11198 2 4T/15 10426 32554 2 1T/16 24195 1016 6488 57943 4 2016 = 12 2T/16 30759 2495 1200 51721 4 3T/16 19862 24195 2 4T/16 14136 24196 2 TOTAL 20 14 5 20 59 C* = 17 S*
Caminhos de Geografia Uberlândia v. 18, n. 64 Dezembro/2017 p. 454–471 Página 15 = 13 I* = 29 TOTAL OF VIOLATIONS 26 22 18 21 87 2012 = 20 2013 = 22 2014 = 11 2015 = 10 2016 = 24 C* = 25 S* = 11 I* = 29 Source: IGAM (2016).
Analyzing Table 6, we observe that thermotolerant coliforms/Escherichia Coli was the parameter that presented more non-compliant values (59 violations), followed by total phosphorus (10 violations), suspended solids and turbidity (both with 9 violations). Regarding the sampling stations, we have the following, in descending order: RD013 (26), RD018 (22), RD021 (21) and RD019 (18). That is, rivers Piranga, Casca and Matipó.
Overall, there were fewer violations in 2014 (11) and 2015 (10) than in 2012 (20), 2013 (22) and 2016 (24). Just like ASSUVAP's monitoring, it is possible to notice that the rainy season has more violations (25) than dry season (11); therefore, there is a suggestion of a bigger influence from diffuse pollution for water quality in the region.
One can see, thus, the importance of the refinement of the monitoring network for further analysis because, in three years of sampling, with 6 sampling points, the directed network had 169 violations, and IGAM's biased network, with 4 points in the same period, had 45 violations. Furthermore, the amount of violations in the rainy season (25) in IGAM's network, which more than doubled in the dry season (11), indicates prevalence of diffuse pollution (21% of violations are of suspended solids and turbidity). Even though the directed network shows the same tendency, the violation rate in rainy and dry season is lower (48 violations in rainy season and 37 in dry season, in which suspended solids and turbidity, together, represented only 5.3% of violations). This observation is confirmed when we compare the dry seasons (third quarter) in the two monitorings: 2014 (15), 2015 (13) and 2016 (9) in ASSUVAP's network, and 2014 (2), 2015 (2) and 2016 (4) in the basic network operated by IGAM. Soluble copper, indicator of pig food residue, is another highlight, which showed no violations in IGAM's monitoring, but represented 16% of violations from ASSUVAP's monitoring. These facts suggest that, despite the efficiency of the basic network operated by IGAM, which initially subsidized the diagnosis for the planning of the fiscal action in the region, the implementation of a directed network is recommended, so as to enable a more precise vision of local environmental impacts and the investigation of specific activities.
From the statistical test applied in sampling points RD013 and RD018 in IGAM's network for the parameters thermotolerant coliforms/Escherichia Coli and phosphorus, it was possible to verify, with the significance level (α) of 95%, that there were relevant differences for the sampling points RD013 and RD018 in IGAM's network.
The evaluations' results of the medians difference in the two periods established in the tests were the following:
Coliforms RD013: 0.15 - RD018: 0.10 Phosphorus RD013: 0.13 - RD018: 0.01
The alternative hypothesis, which demonstrates that the values for the sample before are larger than after, was accepted for thermotolerant coliforms (E. Coli) in the two evaluated points, and for total phosphorus only in point RD013.
Caminhos de Geografia Uberlândia v. 18, n. 64 Dezembro/2017 p. 454–471 Página 16 FINAL CONSIDERATIONS
The main conclusions deriving from the execution of the Inspection Project - Pig Farming for four years are the following:
The continuous inspection reached its objective, which was to increase the environmental regularization in the basin, since 94.11% of the fined enterprises, that is, 16 out of 17, were regularized.
The maintenance of inspection actions in the region caused the anticipation, as well as the continuity along the time, of the environmental regularization of enterprises, inspected or not, once the constant presence of the government motivates regularity. This demonstrated, again, how effective continuous inspection is, when founded on technical basis.
The implementation of a directed monitoring network of water quality (primary resource that was impacted by the pig farming activity) enabled, on the part of the entrepreneur, the acknowledgment that pig farming contributes to the increase of the thermotolerant coliforms parameter, and not only the gap in sewage treatment in the region, as previously alleged by the sector.
Through reports from ASSUVAP's monitoring network it was possible to notice how pig farming contributes to the worsening of water quality of some of UPGRH DO1's bodies of water, but the network also allowed that the general improvements in water quality after inspection actions in the region were followed up close, which induced a better control of the activity. The evaluation of the obtained results in the Águas de Minas Program/IGAM strategic points of the water quality monitoring network confirmed the above mentioned conclusion: improvement in some of UPGRH DO1's bodies of water, mainly in the rivers Piranga and Casca (where there were significant differences in the quality of the water), after the inspection activities implemented in the region.
From the comparison between ASSUVAP's water quality monitoring points VS03 and IGAM's RD013, it was possible to identify the contributions of water pollution caused by Ponte Nova's sewer and by the pig farming activity in river Piranga. And it was also possible to prove the self-depuration that this river can still do (ASSUVAP's point VS03 X IGAM's points RD013 and RD019).
Analysis of self-monitoring results from some pig farms proved the complexities of this activity. As an example we can mention a situation in which, even though the contribution of some enterprises to the increase of variables such as total phosphorus and DBO in the recipient body of water can be demonstrated, the treatment they use shows efficiency in compliance with the legislation.
The qualifying process through courses, workshops and meetings within the project enable better alignment, resolution of doubts and dialogue between entrepreneurs, environmental agencies, consultants, community, Environmental Military Police and academy, about problems and solutions connected to the pig farming activity.
REFERENCES
AQUINO, A. F.; HERZOG, L. R.; FERREIRA, R. S.; FONSECA, M.; RODRIGUES, M. G. Pereira. Fiscalização Ambiental Integrada: Uma Nova Ferramenta na Gestão de Recursos
Hídricos. IX Simpósio de Recursos Hídricos do Nordeste, Salvador – BA, 2008.
ASSUVAP- Associação dos suinocultores do Vale do Piranga. Monitoramento da Qualidade
de Águas Superficiais- Demanda Semad.Relatório Técnico. Ponte Nova. 2014
BARBOSA, F. A. R. Programa brasileiro para conservação e manejo de águas interiores:
síntese das discussões. Acta Limnologica Brasiliensia, Botucatu, v. 5, n. 1, p. 211-222, jun.
Caminhos de Geografia Uberlândia v. 18, n. 64 Dezembro/2017 p. 454–471 Página 17
BARTHOLOMEU, D. B.; BARTHOLOMEU, M. B.; MIRANDA, S. G. H.; CARVALHO, T. B.
Legislação de recursos hídricos e o tratamento de dejetos na suinocultura paulista.
Congresso Brasileiro de Economia e Sociologia Rural (SOBER). Fortaleza, 2006.
CARVALHO, T. M. Diagnóstico dos Empreendimentos Suinícolas na Bacia do Rio Piranga
e o Índice de Qualidade de Águas Superficiais – IQA. Universidade Federal de Ouro Preto,
Programa de Pós-Graduação em Sustentabilidade Socioeconômica e Ambiental. Ouro Preto, 2014.
CBH - Comitê de Bacia Hidrográfica-Piranga. A Bacia. Available in:
<http://www.cbhpiranga.org.br/a-bacia>. Accessed on: June 19th, 2017.
EPA – United States Environmental Protection Agency. Guidelines for Water Reuse. U.S.
Environmental Protection Agency. Manual. 2012. Available in:
<https://nepis.epa.gov/Exe/ZyPDF.cgi/P100FS7K.PDF?Dockey=P100FS7K.PDF>. Accessed on: June 15th, 2017.
FEAM - Fundação Estadual do Meio Ambiente. Diagnóstico ambiental das indústrias de abate do Estado de Minas Gerais - atualização / Gerência de Desenvolvimento e Apoio Técnico às Atividades Industriais. Belo Horizonte: Fundação Estadual do Meio Ambiente, 2010. 122 p.
FEAM - Fundação Estadual do Meio Ambiente. Plano para Incremento do Percentual de Tratamento de Esgotos Sanitários na Bacia Hidrográfica do Rio Piranga, 2015. Available in:<http://www.feam.br/images/stories/2016/MONITORAMENTO_EFLUENTES/Piranga/Anexo_ 1_-_PITE_Piranga_-_Volume_I.pdf >. Accessed on: June 19th, 2017.
IGAM - Instituto Mineiro de Gestão das Águas. Plano de Ação de Recursos Hídricos da
Unidade de Planejamento e Gestão dos Recursos Hídricos Piranga. 2010. PARH Piranga.
Available in: <http://www.cbhdoce.org.br/wp-content/uploads/2014/10/PARH_Piranga.pdf>. Accessed on: March 29th, 2017.
IGAM - Instituto Mineiro de Gestão das Águas.
Boletim Anual de Qualidade das Águas na
Bacia Hidrográfica do Rio Piranga. 2016. Available in:
<http://portalinfohidro.igam.mg.gov.br/publicacoes-tecnicas/qualidade-das-aguas/qualidade- das-aguas-superficiais/boletins-de-qualidade-das-guas-superficiais/boletim-anual-de-qualidade-das-aguas-superficiais/bacia-hidrografica-do-rio-doce/11950-2015>. Accessed on: June 19th, 2017.
LUDKE, J.V.; LUDKE, M.C.M.M. Preservação ambiental. Suinocultura Industrial, São Paulo, v. 25, n. 2, p. 10-14, 2002
MARQUES, A. C. 9º Seminário Nacional de Desenvolvimento da Suinocultura. Embrapa – Suínos e Aves. Gramado, RS. 2001, f.98.
MIRANDA, C.R. de. Avaliação de estratégias para sustentabilidade da suinocultura. 2005. 264. Tese (Doutorado em Engenharia Ambiental) – Universidade Federal de Santa Catarina, Florianópolis, 2005.
MINAS GERAIS. Deliberação Normativa COPAM nº 74/2004, 2004. MINAS GERAIS. Deliberação Normativa COPAM/CERH nº 01/2008, 2008.
NFTALLIANCE. Suinocultura da Zona da Mata Corresponde a 21% do Plantel Mineiro. Published in 12/23/2016. Available in: <http://nftalliance.com.br/noticias/suinos/suinocultura-da-zona-da-mata-corresponde-a-21-do-plantel-mineiro>. Accessed on: March 29th, 2017.
PENA, A. P. D. Avaliação da Influência da “Operação Especial de Fiscalização Ambiental – Suinocultura” na qualidade da água na bacia do Rio Piranga. Trabalho de Conclusão de Curso – Universidade Federal de Minas Gerais, Belo Horizonte, 2016.
PÉRDOMO, C. C.; LIMA, G.J.M.M; NONES, K. 9º Seminário Nacional de Desenvolvimento da Suinocultura. Embrapa – Suínos e Aves. Gramado, RS. 2001, p. 8/24.
SEMAD. Secretaria de Meio Ambiente e Desenvolvimento Sustentável. Estudos Ambientais do Estado de Minas Gerais de 2012. Minas Gerais, 2012.
Caminhos de Geografia Uberlândia v. 18, n. 64 Dezembro/2017 p. 454–471 Página 18 SEMAD. Secretaria de Meio Ambiente e Desenvolvimento Sustentável. Monitoramento – Operação Especial Suinocultura – 2012, 2013 e 2014. Minas Gerais, 2014.
SIMEONOV, V.; EINAX, J.; STANIMIROVA, I.; KRAF, J. Environmental modeling and interpretation of river water monitoring data. Anal. Bioanal. Chem. v.374, p.898–905, 2002.