Caminhos de Geografia Uberlândia v. 20, n. 72 Dez/2019 p. 360–374 Página 360 RIVER AND ITS TRIBUTARIESi
Maria do Socorro Rochada Silva Instituto Nacional de Pesquisas da Amazônia - INPA Coordenação de Pesquisas em Dinâmica Ambiental - CODAM
[email protected] Eduardo AntonioRíos-Villamizar Instituto Nacional de Pesquisas da Amazônia - INPA Coordenação de Pesquisas em Dinâmica Ambiental - CODAM
[email protected] Sebastião Átila FonsecaMiranda Instituto Nacional de Pesquisas da Amazônia - INPA Coordenação de Pesquisas em Dinâmica Ambiental - CODAM
[email protected] Sávio José FilgueirasFerreira Instituto Nacional de Pesquisas da Amazônia - INPA Coordenação de Pesquisas em Dinâmica Ambiental - CODAM
[email protected] Sergio R. BulcãoBringel Instituto Nacional de Pesquisas da Amazônia - INPA Coordenação de Pesquisas em Dinâmica Ambiental - CODAM
[email protected] Núbia AbrantesGomes Universidade Federal de Roraima – UFRR [email protected]
Luana MonteiroSilva Universidade Federal do Amazonas - UFAM Coordenação de Pós-Graduação em Química - CPGQ [email protected]
DomitilaPascoaloto Instituto Nacional de Pesquisas da Amazônia - INPA Coordenação de Pesquisas em Dinâmica Ambiental - CODAM
[email protected] Genilson PereiraSantana Universidade Federal do Amazonas - UFAM Coordenação de Pós-Graduação em Química - CPGQ [email protected] Hillândia BrandãoCunha Instituto Nacional de Pesquisas da Amazônia - INPA Coordenação de Pesquisas em Dinâmica Ambiental - CODAM
ABSTRACT
The geological diversity of the Amazon Basin, as well as the pluvial regime, influences the characteristics of the waters. To know the water types of the rivers of the Amazon basin, 288 superficial water samples were collected, 94 of them along the Amazon River and 194 in their tributaries, from March 2009 to September 2012. The physical, chemical, and physicochemical properties were analyzed. Rivers with pH between 6.5 and 7.6 and electrical conductivity (40.00 - 80.00 μS cm-1) are water bodies that are influenced by the
Andean region (e.g., the Amazon River and some of its right bank tributaries). On the other hand, the rivers with pH in the range of 3.5 to 5.5 and conductivity <30.00 μS cm-1, which
Caminhos de Geografia Uberlândia v. 20, n. 72 Dez/2019 p. 360–374 Página 361 rivers with pH (6.0 to 7.0), low ionic charge, and conductivity <40.0 μS cm-1, such as the
lower Amazon River’s right bank tributaries (Tapajos and Xingu) which are influenced by the Central Brazilian Shield, and also the middle/upper Amazon River’s right bank tributaries (Tefé, Coari and Jutaí).
Keywords: Amazon basin. Amazonian Rivers. Water chemistry. Water typology.
UMA CONTRIBUIÇÃO PARA A HIDROQUÍMICA E TIPOLOGIA DAS ÁGUAS DO RIO AMAZONAS E SEUS TRIBUTÁRIOS
RESUMO
A diversidade geológica da Bacia Amazônica, bem como o regime pluvial, determina as características de suas águas que, em consequência, se classificam em vários tipos. Para conhecer esses vários tipos de água, coletaram-se 288 amostras de água superficial, sendo 94 ao longo do rio Amazonas e 194 em seus tributários, no período de março de 2009 a setembro de 2012. Foram avaliadas as características físicas, químicas e físico-químicas, em cujos resultados observaram-se águas com pH entre 6,5 e 7,6; e condutividade elétrica oscilando de 40,00 a 80,00 µS cm-1. Esses corpos hídricos (rio Amazonas e alguns dos seus tributários da margem direita) têm influência da região Andina. Por outro lado, os rios com pH na faixa de 3,5 a 5,5 e condutividade < 30,00 µS cm-1, que são tributários da margem esquerda, refletem as características do Escudo das Guianas. Há ainda os rios com pH entre 6,0 e 7,0; baixa carga iônica e condutividade < 40,0 µS cm-1, representados pelos tributários da margem direita do baixo Amazonas (Tapajós e Xingu) que são influenciados pelo Escudo Cristalino do Brasil Central, além dos tributários da margem direita do médio/alto rio Amazonas (Tefé, Coari e Jutaí).
Palavras-chave: Bacia Amazônica. Rios da Amazônia. Química da água. Tipos de água.
INTRODUCTION
The Amazon basin is the world’s largest hydrographical network. The Amazon River springs up in Peru with the name of Vilcanota. When it reaches the Brazilian territory, it is known as Solimões, after flowing together with the Negro River near Manaus, it becomes known as the Amazon River. Its major right-bank tributaries are Javari, Juruá, Jutaí, Madeira, Tapajós and Xingu rivers; its major left bank tributaries are Içá, Japurá, Negro, Uatumã, Nhamundá, Trombetas, and Jari rivers (OTCA/PNUMA/OEA, 2006).
The Negro River stands out among the Amazon River’s left bank tributaries due to being one of the three longest Amazonian black water rivers flowing for 1700 km with a mean discharge of 30.000 m3 s -1(SIOLI, 1968; JUNK, 1983). This river drains three main Amazonian geological formations such as
the Guiana Shield and the Tertiary and Quaternary sediment regions (JUNK, 1983). The black water rivers are characterized by the dark brown color, produced by the allochthonous matter from the forest in decomposition (LEENHEER and SANTOS, 1980) or leached in podzolic and sandy soils along their courses (CHAAR, 1995).
The Amazon River’s major right-bank tributaries are long and are mostly draining the Amazonian Craton rocks (Cráton Amazônico). Among these tributaries, the Madeira River stands out with approximately 1450 km long, its headwaters, and some of its branches are from Andean origin
(HORBE et al., 2013).
The drainages of the east region have their origins in the Central Brazilian and Guianas Shields (GOULDING et al., 2003). The territorial dimension of the basin and the environmental factors such as relief, soil, climate, vegetation and biodiversity are primarily responsible for the remarkable differences in color of the waters and occurrence of different water types (FITTKAU, 1964; JUNK, 1983; STALLARD and EDMOND, 1983). Among the numerous works already done in the Amazonian basin, we highlight those relating to the origin of the acidity (pH 4.7 to 6.3) and dark color, which reflects the
Caminhos de Geografia Uberlândia v. 20, n. 72 Dez/2019 p. 360–374 Página 362 humic and fulvic substances content (LEENHER and SANTOS, 1980) and water geochemistry (DE PAULA, 1990).
This work aims to characterize and evaluate, under the physical and chemical aspects, the water typologies of the Amazon River and its major tributaries, in a flood and drought periods.
MATERIAL AND METHODS STUDY AREA
Samples were collected in the period from March 2009 to December 2012, according to the hydrological regime, which showed a clear distinction between high and low water periods. The field expeditions took place for 24 months, at irregular intervals, getting a total of 288 samples. Among them, 94 along the Amazon River, and 194 on its tributaries (Figure 1).
Figure 1 - Sampling sites along the Amazon River and its tributaries from March 2009 to July 2012.
Source - Adapted from SILVA (2013).
ENVIRONMENTAL VARIABLES
The following variables were analyzed: Hydrogenionic potential (pH) and electric conductivity using portable instruments. The real color was determined by spectrophotometry (450 nm) in filtered samples using a FEMTO 700 PLUS. The turbidity was determined using a Micronal turbidimeter. For dissolved oxygen (DO) the Winkler method was used (GOLTERMAN et al., 1978). The total suspended solids (TSS) were determined by the gravimetry method using the dry weight of the material in 0.7 µm glass fiber filters. Ammonium, nitrate, and silica ions were determined by spectrophotometry method with the aid of the flow injection analysis techniques (FIA). Nitrate was established by the reduction of nitrate to nitrite by passing the water sample through a cadmium
Caminhos de Geografia Uberlândia v. 20, n. 72 Dez/2019 p. 360–374 Página 363 column (APHA, 2005). The dissolved iron (Fe+2) was determined by phenanthroline method (APHA,
2005).
Chloride (Cl-), sulfate (SO4-2), calcium (Ca2+), magnesium (Mg2+), sodium (Na+) and potassium (K+)
ions concentrations were determined by high-performance liquid chromatography by using DIONEX chromatographer (model ICS1000) with an automatic analyzer software (Peaknet 6,7). The samples were filtered and preserved with Thymol at the sampling time, and certified Troi-94 was used as standard.
STATISTICAL ANALYSIS
To assess the composition of the Amazonian river waters, the results were organized in descriptive boxplot graphs which displayed the mean and standard deviation of the data and these were sufficient to check differences amongst regions in the Amazon basin, based on the different water types that represent the diverse sites sampled and analyzed in this work. A statistical program, R Development Core Team (2011), was used for this purpose.
RESULTS
To better evaluate the levels of cations and anions, the Amazon River was divided into sections with familiar nomenclature in the region taking as a reference the municipalities that are drained by this river. The sections in this study were determined as follows: the first section, called the “Alto Amazonas” (ALTO-AM) covers the upper course of the Amazon River, which crosses the municipalities from Tabatinga to Codajás. In the second section called “Médio Amazonas” (MÉDIO-AM) the Amazon River crosses the cities from Manacapuru until Itacoatiara. The third section covered the cities of the Amazon River’s lower course, from Parintins to Santarém and is called “Baixo Amazonas” (BAIXO-AM). More two parts took into account the tributaries of the right bank (TRIB-MD) and the left bank (TRIB-ME) of the Amazon River.
In the main channel, all parameters presented a full amplitude of variation, both in the dry and rainy periods. In some of them, the difference between the highest and the lowest values was more than ten times (Table 1). The physical and chemical variables showed significant variations between the Amazon River’s right bank tributaries and those of the left bank.
Among the environmental variables, the pH ranged from acid 3.96 (in the Cubati River) to near neutral condition 6.98 (in the Xingu River,) and then it reached 7.86 (in the Solimões River, near Manaus) (Tables 1, 2 and 3). This variation of pH shows the existence of geological heterogeneity. The low pH values typically occur in blackwater rivers and are related to humic and fulvic substances (LEENHER and SANTOS, 1980).
The highest values of conductivity observed in the Upper part of the Amazon River (Tabatinga) are due to the great transport of suspended and dissolved solids coming from the Andean region, as well as the relatively high dissolved load in the water column (Table 1). Similar values were observed by Duque et al. (1997). Both pH and conductivity along the Amazon River, upstream from Tabatinga and downstream from Santarém, showed significant variations during the rainy (pH: 5.74 - 7.41 and E.C:
49.80 - 143.27 µS cm-1) and dry (pH: 6.25 - 7.86 and E.C: 22.40 - 153.20 µS cm-1) seasons. The
turbidity in the Amazon River ranged from 2.08 to 73.58 NTU (dry season) and from 10.27 to 173.94 NTU (rainy season). The highest values were found on the Madeira river in front of the Humaitá city in the dry (262.60 NTU) and rainy (280.67 NTU) seasons. High turbidity values were also observed in studies conducted by Hibam project at various locations of the Madeira River, with measures of 80 NTU (dry season) and 998 NTU (rainy season) (HIBAM, 1998). It also was found a turbidity of 257 NTU in the Amazon River at Itacoatiara (HIBAM, 1995). The lowest values were observed in rivers from the right bank of the lower Amazon River ("baixo Amazonas") such as Curuá-Una (0.78 NTU), Arapiuns (1.04 NTU) and Tapajos (1.34 NTU), showing little variation between the two seasonal periods (Table 3).
The water color reflects the presence of dissolved and suspended substances coming from the decomposition of organic matter from the forest (FAY and SILVA, 2006). The real color (i.e., suspended solids-free) of the black water rivers ranged between 3.47 and 178.97 mg Pt L-1 (Table 2).
Caminhos de Geografia Uberlândia v. 20, n. 72 Dez/2019 p. 360–374 Página 364 The DO variations were very heterogeneous, from 1.86-10.45 mg L-1 (Table 3). In many stretches of
the Amazon River basin, the contents of DO are low, reaching 1.83 mg L-1 in the Purus river (July
2012). The low values of this gas in the Amazonian rivers are considered natural, and the organisms of this environment are well adapted to this condition. The highest DO concentrations were found in the dry period in the Xingu river (July 2009) and in the Madeira river (November 2009). The presence of large amounts of organic matter in the aquatic environment may contribute to decrease the dissolved oxygen concentrations due to the natural oxidation process of organic matter (SPERLING, 2007; KRISTENSEN et al., 2008). Similar values of low dissolved oxygen concentrations, in natural environments of the Amazonian rivers, were also observed by Shánchez-Botero et al. (2001; 2003) and Aprile and Darwich (2009).
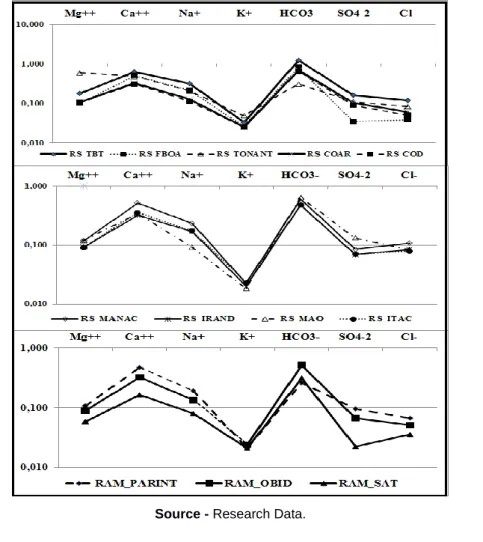
Calcium was predominant among cations, followed by sodium, magnesium, and potassium. Among the anions, bicarbonate predominated. These values are represented in milliequivalents (meq L-1). The
cations (Ca2+, Mg2+, Na+, K+) and anions (HCO3-, Cl-, SO4-2) concentrations of these rivers were plotted
in the Schoeller diagram (Figure 2). It was observed that the highest concentrations were found during the rainy season in the tributaries of the upper part of the Amazon River “alto Rio Amazonas” (Figure 3 and Table 3). Other authors also observed in the Madeira River waters, which are comparable to those of the Amazon River, a similar pattern for these ions (LEITE et al., 2011). This is probably due to the massive amounts of suspended and dissolved solids which are carried by these rivers from their Andean headwaters (FILIZOLA e GUYOT, 2011). These processes release, into the aquatic environment, electrolytes that elevate the electrical conductivity (153.20 µS cm-1), substances that
raise the color values, as well as suspended solids that may become to 247.50 mg L-1 (Table 1 and 3).
Figure 2 - Distribution of the cations (Ca2+, Mg2+, Na+, K+ in meq L-1) and anions (HCO3-, Cl-, SO4-2 in
meq L-1), according to the Schoeller diagram, along the main channel of the SolimõesAmazon River.
RS: Solimões River; RAM: Amazon River.
Caminhos de Geografia Uberlândia v. 20, n. 72 Dez/2019 p. 360–374 Página 365
The highest levels of dissolved oxygen (10.27 mg L-1) and the lowest turbidity values (0.78 NTU)
were observed in the Tapajos River and the right bank tributaries of the Amazon River’s lower course (TRIB-MD-AM), respectively (Table 3). The waters of these tributaries, whose headwaters are in the Central Brazilian Shield, have conductivity values less than 36.48 µS cm-1 and turbidity
values with a maximum of 37.70 NTU (Figure 3).
The highest recorded value for total iron was 7.332 mg L-1 on the Madeira River, an Amazon
River’s right bank tributary. High values were also observed in the upper part of the Amazon River at Tabatinga (6.19 mg L-1). Horbe et al. (2005) reported similar values and predominance of iron
in the waters of some Amazonian rivers, which was attributed to the weathering of sedimentary rocks at the Alter do Chão Formation.
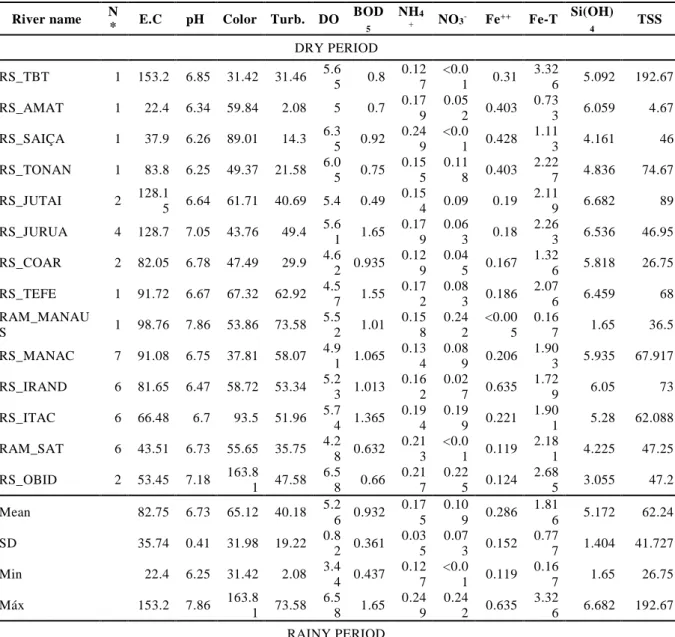
Table 1 - Results of electrical conductivity - E.C (µS cm-1), pH, color (mg Pt L-1), turbidity - Turb.
(NTU), dissolved oxygen (DO), biochemical oxygen demand (BOD5), ammonium (NH4+), nitrate
(NO3-), dissolved and total iron (Fe), silicate (Si(OH)4)and total suspended solids (TSS), in mg L-1,
in the SolimõesAmazon River, between Tabatinga and Santarém cities, from March 2009 to December 2012, in both dry and rainy periods. *The total N were 41 (Dry Period) and 50 (Rainy period); RAM: Amazon River; RS: Solimões River; RPUR: Purus River; ND: not determined; SD:
Standard deviation; Min: Minimum value; Max: Maximum value.
River name N
* E.C pH Color Turb. DO
BOD 5 NH4 + NO3- Fe++ Fe-T Si(OH) 4 TSS DRY PERIOD RS_TBT 1 153.2 6.85 31.42 31.46 5.6 5 0.8 0.12 7 <0.0 1 0.31 3.32 6 5.092 192.67 RS_AMAT 1 22.4 6.34 59.84 2.08 5 0.7 0.17 9 0.05 2 0.403 0.73 3 6.059 4.67 RS_SAIÇA 1 37.9 6.26 89.01 14.3 6.3 5 0.92 0.24 9 <0.0 1 0.428 1.11 3 4.161 46 RS_TONAN 1 83.8 6.25 49.37 21.58 6.0 5 0.75 0.15 5 0.11 8 0.403 2.22 7 4.836 74.67 RS_JUTAI 2 128.1 5 6.64 61.71 40.69 5.4 0.49 0.15 4 0.09 0.19 2.11 9 6.682 89 RS_JURUA 4 128.7 7.05 43.76 49.4 5.6 1 1.65 0.17 9 0.06 3 0.18 2.26 3 6.536 46.95 RS_COAR 2 82.05 6.78 47.49 29.9 4.6 2 0.935 0.12 9 0.04 5 0.167 1.32 6 5.818 26.75 RS_TEFE 1 91.72 6.67 67.32 62.92 4.5 7 1.55 0.17 2 0.08 3 0.186 2.07 6 6.459 68 RAM_MANAU S 1 98.76 7.86 53.86 73.58 5.5 2 1.01 0.15 8 0.24 2 <0.00 5 0.16 7 1.65 36.5 RS_MANAC 7 91.08 6.75 37.81 58.07 4.9 1 1.065 0.13 4 0.08 9 0.206 1.90 3 5.935 67.917 RS_IRAND 6 81.65 6.47 58.72 53.34 5.2 3 1.013 0.16 2 0.02 7 0.635 1.72 9 6.05 73 RS_ITAC 6 66.48 6.7 93.5 51.96 5.7 4 1.365 0.19 4 0.19 9 0.221 1.90 1 5.28 62.088 RAM_SAT 6 43.51 6.73 55.65 35.75 4.2 8 0.632 0.21 3 <0.0 1 0.119 2.18 1 4.225 47.25 RS_OBID 2 53.45 7.18 163.8 1 47.58 6.5 8 0.66 0.21 7 0.22 5 0.124 2.68 5 3.055 47.2 Mean 82.75 6.73 65.12 40.18 5.2 6 0.932 0.17 5 0.10 9 0.286 1.81 6 5.172 62.24 SD 35.74 0.41 31.98 19.22 0.8 2 0.361 0.03 5 0.07 3 0.152 0.77 7 1.404 41.727 Min 22.4 6.25 31.42 2.08 3.4 4 0.437 0.12 7 <0.0 1 0.119 0.16 7 1.65 26.75 Máx 153.2 7.86 163.8 1 73.58 6.5 8 1.65 0.24 9 0.24 2 0.635 3.32 6 6.682 192.67 RAINY PERIOD
Caminhos de Geografia Uberlândia v. 20, n. 72 Dez/2019 p. 360–374 Página 366 RS_TBT 3 143.2 7 7.41 40.39 159.2 9 4.0 5 0.73 0.13 3 0.52 2 0.118 6.19 4.74 172.93 RS_AMAT 1 65.77 6.32 45.63 14.82 2.6 3 0.5 0.22 9 ND 0.72 4.43 3.99 37.82 RS_SAIÇA 1 49.8 6.32 42.64 17.68 2.1 7 ND 0.01 2 0.28 7 <0.1 0.97 3.52 26.2 RS_TONAN 1 60.75 7.1 41.89 10.4 3.8 6 ND 0.03 6 0.26 1 <0.1 0.97 3.52 15.4 RS_JUTAI 1 111.5 6.26 91.26 37.96 2.5 0.32 0.21 5 0.15 4 0.9 1.86 8 6.025 65.33 RS_FBOA 2 85.6 6.53 47.87 39.52 2.3 4 0.15 0.01 6 0.20 4 0.1 2.47 3.65 55.5 RS_COARI 8 78.21 6.74 69.71 54.96 3.4 3 0.429 0.14 9 0.19 8 0.548 2.26 5 5.16 36.791 RS_COD 4 81.35 7.17 69.37 42.12 3.0 7 0.535 0.11 1 0.17 4 0.468 2.60 6 5.846 32.27 RS_JURUÁ 2 108.1 5 6.41 106.2 1 10.27 2.3 4 0.86 0.18 5 0.02 9 0.214 2.12 6 5.653 16.1 RS_TEFE 1 83.8 6.24 74.05 13.78 2.8 5 0.76 0.18 6 <0.0 1 0.727 0.94 1 4.001 44.33 RS_PURUS 1 71.4 5.74 85.27 24.96 1.4 1 0.51 0.22 7 <0.0 1 0.962 1.56 2 5.603 57 RS_MANAC 5 66.57 6.54 70.76 32.34 2.9 0.385 0.2 0.09 3 0.552 1.81 4 4.911 36.3 RAM_MAO 3 72.9 6.47 63.95 16.12 2.3 7 1.428 0.20 1 0.04 1 0.489 0.84 5 4.988 18.6 RAM_IRAND 2 68 6.89 65.08 27.82 1.6 9 0.23 ND ND 0.1 1.09 4 4.655 36 RAM_ITAC 5 55.51 6.53 138.5 3 93.49 5.7 7 2.13 0.13 6 0.33 0.148 2.27 7 4.23 78.808 RAM_PARIN 4 83.2 7.22 261.2 9 101.1 4 6.4 5 2.447 0.26 1 0.1 0.194 3.50 8 4.159 92.667 RAM_OBID 2 75.1 7.21 181.7 6 81.12 5.6 3 0.87 0.14 3 0.17 3 0.188 3.13 4.016 78.5 RAM_SAT 4 63.78 6.5 90.51 140.4 4.7 0.653 0.23 6 0.17 0.114 5.09 3 5.276 174.5 Mean 83.59 6.74 83.05 60.26 3.3 1 0.785 0.14 8 0.21 6 0.383 2.76 4 4.895 71.225 SD 44.65 53.5 3 54.33 45.97 1.6 5 0.487 0.13 6 0.16 1.642 1.73 8 49.093 41.216 Min 49.8 5.74 40.39 10.27 1.4 1 0.15 0.01 0.02 9 0.1 0.84 5 3.52 15.4 Max 155.5 5 7.56 261.2 9 177.0 6 6.4 4 2.447 0.26 1 0.56 4 0.962 6.44 6.9 195.075
It was observed in the Arapiuns river close to its headwaters, pH of 5.05 , and low electrical conductivity (10.32 µS cm-1). However, near its confluence with the Tapajos river, the chemical
characteristics of its water change (pH 6.79 and E.C of 8.90 µS cm-1, respectively). A similar pattern was observed in the Jutaí River, a right-bank tributary of the Amazon River, with features of black water rivers (pH 5.84) and low electrical conductivity (11.70 µS cm-1). Along its course,
this river receives different contributions that may alter the physical and chemical characteristics when approaching to its mouth, near the Solimões River (SILVA, 2013).
The Upper and Middle Amazon River as well as its right bank tributaries showed higher ionic load with mean conductivity above 60 μS cm-1, pH (6.5-7.6) and total iron above 2 mg L-1. These
characteristics show the strong influence of the Andean and Pre-Andean regions. The Lower Amazon River’s right bank tributaries (Tapajos and Xingu), which are influenced by the Central Brazilian Shield, showed pH (6.0-7.0) and conductivity lower than 40.0 μS cm-1. The Amazon
River’s left bank tributaries displayed pH values in the range of 3.5 to 5.5 and conductivity <30.00 μS cm-1, reflecting the characteristics of the Guiana Shield, excepting the Trombetas River (Table
Caminhos de Geografia Uberlândia v. 20, n. 72 Dez/2019 p. 360–374 Página 367 Figure 3 - Values (boxplots) of electrical conductivity (µS cm-1), color (mgPt L-1), total suspended
solids (mg L-1), turbidity (NTU), dissolved Fe (mg L-1), DO (mg L-1), pH and silicate (mg L-1) in the
tributaries of the right bank (TRIB-MD-AM), the lower course (TRIB-MD-BAIXO-AM), and the tributaries of the left bank (TRIB-ME-RAM) of the Amazon River.
Source - Research Data.
Table 2 - Results of electrical conductivity - E.C (µS cm-1), pH, color (mgPt L-1), turbidity - Turb.(NTU),
dissolved oxygen (DO), ammonium (NH4+), nitrate (NO3-), dissolved and total iron (Fe), silicate
(Si(OH)4)and total suspended solids (TSS), in mg L-1, in the Amazon River’s left bank tributaries, from
March 2009 until December 2012. The total N were 55 (Dry Period) and 53 (Rainy period); BRBR: Branco River basin; BRN: Negro River basin; R.: Rio (River); ND: not determined; SD: Standard
deviation; Min: Minimum value; Max: Maximum value.
River name N* E.C pH Color Turb. DO NH4+ NO3- Fe++ Fe-T Si(OH)4 TSS
DRY PERIOD R. Iça 1 16.22 6.1 54.6 9.1 6.33 0.162 <0.01 0.395 0.792 4.12 48 R. Japurá 3 13.47 6.04 56.35 20.11 5.48 0.133 0.064 0.183 0.947 2.99 25.2 R. Tacutu (BRBR) 3 36.97 6.59 45.88 12.65 6.21 0.137 0.013 0.19 1.122 7.92 17.8 R. Uraricuera (BRBR) 3 26.1 5.6 40.39 16.12 6.44 0.397 0.253 0.18 0.673 7.97 14.47 R. Branco (BRBR) 10 27.33 6.72 34.41 12.45 6.66 0.194 0.05 0.188 0.621 8.07 18.53 R. Branco (BR 174) 2 43.2 6.48 54.61 16.12 6.37 0.111 0.132 0.21 1.209 7.19 27.9 R. Cauamaé (BRBR) 3 11.54 5.92 25.93 7.11 6.62 0.184 0.027 0.166 0.755 5.86 11.9 R. Mucajai (BRBR) 3 36.13 6.18 59.34 30.94 6.72 0.289 0.152 0.154 1.682 8.42 33.97 R. Anaua (BRBR) 3 31.37 5.96 88.26 28.51 6.54 0.35 0.092 0.241 1.283 8.72 44.8 R. Jauapery (BRN) 3 29.8 6.16 50.37 15.08 6.44 0.234 0.109 0.246 0.871 5.73 27 R. Alalau (BRN) 4 12.93 5.4 56.1 4.55 5.93 0.217 0.031 0.154 0.5 4.34 4.18
Caminhos de Geografia Uberlândia v. 20, n. 72 Dez/2019 p. 360–374 Página 368 R. Ariau (BRN) 1 104.7 7.2 53.6 27.82 1.82 0.1 0.32 <0.1 1.266 ND 26.5 R. Negro (MAO) 2 10.4 5.29 118.19 7.93 5.33 0.336 ND 0.122 0.555 3.53 11.6 R. Preto da Eva 3 8.46 5.16 44.63 4.51 6.84 0.202 0.093 0.279 0.754 3.2 3.1 R. Urubu 2 9.84 4.32 75.55 5.2 7.5 0.165 0.123 0.326 0.327 0.51 2.8 R. Trombetas 4 20.65 6.38 44.22 3.12 5.72 0.123 0.105 0.378 0.772 4.5 7.17 R. Nhamunda 1 2 14.32 5.4 48.25 14.95 4.15 0.147 0.078 0.126 0.466 2.29 17.14 R. Uatumã 3 9.44 6.32 20.44 1.91 6.98 0.22 0.19 0.144 0.529 1.49 2.6 Mean 25.71 5.95 53.95 13.23 6 0.21 0.11 0.22 0.84 5.11 19.15 SD 21.32 0.64 21.25 8.46 1.21 0.08 0.08 0.08 0.33 2.46 13.06 Min 8.46 0.64 20.44 1.91 1.21 0.08 0.01 0.08 0.33 0.51 2.6 Max 104.7 7.2 118.19 30.94 7.5 0.4 0.32 0.4 1.68 8.72 48 RAINY PERIOD R. Iça 1 19.51 5.93 56.1 7.54 2.18 0.039 0.232 0.1 0.65 3.04 11.6 R. Japurá 2 14.57 4.72 135.87 2.46 4.04 0.318 0.052 0.59 1.1 2.01 2.2 R. Tacutu (BRBR) 3 27.21 6.5 94.5 26.93 6.21 0.379 0.068 0.241 1.014 7.63 16 R. Curicuria (BRN) 1 4.39 5.9 3.47 0.61 ND 0.024 0.037 0.625 1.443 1.73 0 R. Uraricue (BRBR) 1 21.1 6.45 112.95 37.7 4.13 ND 0.226 0.12 1.26 ND 32.5 R. Branco (BRBR) 9 25.75 6.57 69.81 19.26 5.82 0.327 0.263 0.39 0.999 6.78 20.41 R. Cauamé (BRBR) 3 10.59 5.86 67.57 19.59 6.36 0.126 <0.01 0.457 0.95 5.07 13.13 R. Mucajai (BRBR) 2 35.17 6.73 86.4 25.48 6.42 0.216 0.165 0.23 1.294 8.98 22 R. Jauapery (BRN) 3 19.53 6.3 96.49 34.58 5.62 0.307 0.155 0.275 1.089 5.2 27.4 R. Grande_Itap. 1 9.46 4.99 76.3 2.6 2.83 0.009 0.027 <0.01 0.158 2.73 ND R. Içana (BRN) 3 19.68 4.44 135.87 2.33 5.25 0.626 0.078 0.665 0.766 1.29 2.2 R. Itapany (BRN) 2 9.06 4.77 53.86 7.02 3.25 0.102 0.092 0.517 0.594 3.11 2 R. Maricota (BRN) 1 9.72 4.84 70.31 2.34 ND 0.268 0.033 0.517 1.573 2.01 NA R. Marie (BRN) 1 ND 4.99 4.99 1.83 ND 0.025 0.08 0.425 0.925 2.79 NA R. Viramun (BRN) `1 11.38 4.79 94.25 8.84 2 0.005 0.033 <0.01 0.145 2.86 ND R. Cubati (BRN) 3 30.17 3.96 178.97 0.44 2.29 ND ND 0.608 0.766 0.59 ND R. Negro (SGC) 3 13.43 4.7 142.37 3.21 4.66 ND 0.031 0.244 0.782 1.8 2.78 R. Negro (MAO) 4 13.39 4.62 141 2.34 3.72 0.034 0.127 0.344 0.687 2.15 2.8 R. Negro (Xier) 1 16.97 4.66 4.66 4.27 ND 0.07 0.125 0.576 0.913 2.42 ND R. Xier (BRN) 2 6 4.8 68.73 1.87 ND 0.071 0.01 0.657 0.825 0.95 0.4 R. Saraban (BRN) 1 8.89 4.68 56.85 6.5 4.47 0.006 0.188 <0.01 0.119 3.34 ND R. Ualpes (BRN) 3 10.8 4.74 61.09 3.87 5.28 0.144 0.484 0.357 0.661 1.89 6 R. Urubu 2 21.04 5.8 77.79 4.42 2.33 ND 0.094 0.1 0.479 3.29 3.2 R. Caru (BRU) 1 10.32 4.77 100.23 13.26 1.47 0.02 0.142 0.132 0.21 2.43 6.8 R. Trombetas 1 21.57 6.55 37.82 2.6 5.23 0.135 0.164 0.12 0.768 4.55 ND R. Uatumã 1 1 9.57 6 43.38 2.6 ND 0.164 0.049 0.18 0.475 2.3 ND R. Nhamunda 1 9.09 5.5 46.38 3.12 ND ND 0.097 <0.1 0.177 7.07 ND Mean 15.71 5.35 78.53 9.17 4.18 0.16 0.12 0.37 0.77 3.38 10.08 SD 7.69 0.79 43.79 10.54 1.56 0.16 0.1 0.19 0.39 2.12 9.89 Min 4.39 3.96 3.47 0.44 1.47 0.01 0.01 0.1 0.12 0.59 0 Max 35.17 6.73 178.97 37.7 6.42 0.63 0.48 0.66 1.57 8.98 32.5
Caminhos de Geografia Uberlândia v. 20, n. 72 Dez/2019 p. 360–374 Página 369
Table 3 - Results of electrical conductivity - E.C (µS cm-1), pH, color (mgPt L-1), turbidity - Turb. (NTU), dissolved oxygen (DO), ammonium (NH4+), nitrate (NO3-), dissolved and total iron (Fe), silicate (Si(OH)4)and total suspended solids (TSS), in mg L-1, analyzed in the Amazon River’s right bank tributaries, covering the dry and rainy seasons from March 2009 to December 2012. *The total N were 54 (Dry Period) and 32 (Rainy period); R.:
Rio (River); ND: not determined; SD: Standard deviation; Min: Minimum value; Max: Maximum value.
River name N C.E. pH Color Turbidity OD NH4+ NO3- Fe-Diss. Fe-T Si(OH)4 TSS
DRY PERIOD R. Javari (AN) 1 24.00 6.34 105.47 44.46 5.63 0.255 0.200 0.411 1.781 4.46 54.67 R. Javari (BC) 1 23.40 6.27 111.45 26.52 5.49 0.284 0.135 0.369 1.891 4.37 55.33 R. Juruá 9 53.57 6.48 113.20 126.88 3.27 0.329 0.191 0.171 1.884 2.21 186.50 R. Jutai 5 16.36 6.14 49.07 40.72 5.78 0.175 0.291 0.186 1.090 5.50 42.05 R. Boia 4 6.68 5.88 45.26 36.92 6.30 0.010 0.046 0.120 0.541 3.11 33.50 R. Purus (Beruri) 3 53.58 6.58 52.92 13.00 1.87 0.146 0.180 0.149 1.250 6.80 5.30 R. Purus (Labrea) 4 67.07 7.17 35.91 32.31 ND 0.147 0.123 0.100 2.185 4.01 117.75 R. Madeira (Altazes) 4 45.46 7.19 127.16 115.90 6.41 0.180 0.142 0.104 1.793 5.07 92.15 R. Madeira (Humaitá) 2 66.90 7.19 87.89 262.60 10.45 0.205 ND 0.108 2.435 4.41 247.50 R. Curua-Una 1 17.73 5.99 18.70 0.78 6.29 ND 0.042 <0.1 0.626 4.77 6.40 R. Cupari 1 65.08 6.18 65.08 13.00 7.07 0.38 0.014 0.100 1.1 2.92 22.57 R. Tapajós 7 14.92 6.69 15.71 1.34 8.08 0.090 0.063 0.100 0.185 5.18 3.77 R. Tapajós (Itaituba) 2 4.49 NA 2.62 12.61 10.27 0.260 0.100 0.100 0.430 5.22 7.67 R. Arapiuns 6 8.24 6.03 25.81 1.04 7.20 0.149 0.027 0.100 0.138 3.66 2.37 R. Xingu 4 19.90 6.98 9.48 1.69 8.94 0.100 0.046 0.100 0.327 7.05 3.20 Mean 32.49 6.507 57.714 48.650 6.645 0.193 0.114 0.158 1.177 4.583 58.715 SD 22.56 0.452 40.357 68.427 2.284 0.096 0.078 0.099 0.749 1.284 71.317 Min 4.490 5.878 2.620 0.780 1.865 0.010 0.014 0.100 0.138 2.214 2.367 Max 67.06 7.193 127.16 262.600 10.44 0.375 0.291 0.411 2.435 7.053 247.50 RAINY PERIOD R. Javari 1 1 16.42 6.33 66.57 24.44 3.38 ND ND 0.100 0.740 3.68 20.2 R. Javari (BC) 1 13.33 5.91 71.06 13.52 5.70 0.070 0.20 0.100 0.821 5.81 9.0 R. Coari 1 9.80 5.85 ND 3.12 5.64 0.090 0.04 0.100 0.722 2.84 8.5 R. Purus 4 18.92 6.45 103.79 42.32 2.03 0.242 0.079 0.143 2.590 NA 45.2 R. Purus (Beruri) 2 24.30 6.13 100.23 13.13 1.83 0.253 0.067 0.553 1.288 6.64 ND R. Jurua 3 16.43 6.18 78.04 24.18 4.90 0.188 0.177 0.158 0.883 4.90 18.87 R. Jutai 2 11.92 5.62 78.92 2.34 1.16 0.227 NA 0.697 0.880 3.36 3.85 R. Madeira (Altazes) 2 47.81 7.20 56.85 102.44 5.34 0.135 0.138 0.107 2.142 5.84 58.7 R. Madeira (Humaita 2) 2 69.80 6.26 96.12 247.91 6.36 0.241 0.076 0.142 4.257 4.31 157.0 R. Madeira (Porto Velho) 2 76.80 6.80 75.93 280.67 8.63 0.228 0.069 0.217 7.332 5.29 189.0 R. Buicu (Itapir) 1 27.50 6.24 53.11 3.12 3.87 0.009 0.091 <0.01 0.636 2.85 0.80 R. Tefé 3 7.25 5.90 56.85 5.55 ND 0.185 0.010 0.100 1.283 0.34 5.47 R. Tarauca 1 103.10 6.49 177.28 181.22 3.71 0.342 <0.025 0.165 1.463 6.11 189.0 R. Tapajós 5 14.39 6.50 49.45 4.36 6.45 0.177 0.111 0.102 0.451 5.84 5.16 R. Arapiuns 2 9.27 6.96 20.57 0.91 6.78 0.114 <0.01 <0.1 0.120 4.17 1.0
Caminhos de Geografia Uberlândia v. 20, n. 72 Dez/2019 p. 360–374 Página 370 Mean 31.13 6.32 77.48 63.28 4.70 0.18 0.10 0.21 1.71 4.43 50.84 SD 28.46 0.418 35.002 91.980 2.057 0.084 0.054 0.184 1.804 1.650 68.861 Min 7.248 5.615 20.570 0.910 1.155 0.009 0.010 0.100 0.120 0.340 0.800 Max 103.1 7.20 177.28 280.67 8.630 0.342 0.200 0.697 7.332 6.640 189.00 DISCUSSION
The values of all variables had a high variability in the main channel, both in the dry and rainy periods. This reflects the effects of the inputs of tributaries with very different hydrochemical characteristics. The electrical conductivity, turbidity, and the total suspended solids are the variables that allow a better visualization of the effects of the entrances of these tributaries, but some irregularities appear challenging to explain. For example, in Tabatinga, the Solimões River has a high conductivity value, soon after this value drops considerably by the entrance of tributaries with low values of this parameter; however, there is an increase of this value after the entrance of the Jutaí River, which exhibits low conductivity values. There are, of course, many other river inputs with features unknown to date, but it cannot be inferred that such a rise in conductivity is due to these inputs. The physicochemical behavior in the Amazon River main channel does not show any trend, although there was a decrease of values in its final section. Stallard and Edmond (1983) also recorded this decrease. The river waters of most of the Amazon basin’s northern parts showed chemical composition distinguished. The rivers are originated in the Guianas Shield, and drain through the dense forest region, receiving along this way large amounts of organic matter that, when decomposed, release humic and fulvic substances. The influence of these substances was observed in both the pH, which ranged from acidic to slightly alkaline water, and the electrolyte content of the studied waters. Previous research conducted in some tributaries of the Negro River also demonstrated low levels of electrolytes and acidic pH (JUNK and FURCH, 1980; SIOLI, 1984; GAILLARDET et al., 1997). A similar pattern was also observed during the surveys of HIBAM (1998) on the Cauamé River in the Roraima State. The Ariaú River, one of the Negro River’s right bank tributaries, presented very different pattern comparatively with its other tributaries. i.e., an alkaline pH (7.2) and high electric conductivity (104.0 µS cm-1), resembling the pattern of the Amazon River’s right bank whitewater tributaries. In this region
occurs clay deposits belonging to the Solimões Formation (NASCIMENTO et al., 1976; SILVA, 2005). The waters may also be influenced by the groundwater in the area, as revealed in a research conducted on the waters of wells in Iranduba city (SILVA and SILVA, 2007), which has shown high levels of electrical conductivity (1632 µS cm-1), sodium (110 mg L-1) and chlorides (586 mg L-1).
The rivers of Andean and Pré-Andean origin contain intense and rich sediment load that, when carried by their channels, enriches their waters, increases the electrical conductivity and pH, varying from slightly acidic to slightly alkaline, as observed by other authors (SIOLI, 1968; STALLARD and EDMOND, 1983; SIOLI, 1984).
There was also a reduction in the acidity (pH reached 7.86) what is explained by low free-CO2, that
according to Sioli (1956) reduces the buffering capacity of the environment (Figure 3). This is confirmed when comparing the conductivity values of these rivers, of Andean origin, ranging from 22.40 to 153.20 µS cm-1, and the lower Amazon River’s left bank tributaries whose headwaters are
located in the Guianas highlands, displaying water conductivity values from 3.96 to 30.17 µS cm-1.
Similar values were observed by Santos et al. (1985).
High values of turbidity (280.67 NTU), E.C (247.50 μS cm-1) and suspended solids (247.50 mg L-1)
were observed in the Amazon River and its right bank tributaries. This is due to the large sediment loads that are carried by them from the Andean and pre-Andean zone (Table 1 and 3). Similar values were observed by Leite et al. (2011), studying the Madeira River, from 2004 to 2005, with variation in electric conductivity of 32.9 to 142.5 μS cm-1. These sediments are transported mainly by the
Solimões/Amazon River to the Atlantic Ocean, estimated in 800 million tons per year (GUYOT et al., 2005; FILIZOLA and GUYOT, 2011).
The highest values of color were observed in the black water rivers. The Negro River and some of its tributaries from the Içana basin, for example, concentrate the highest values of color. It explains why
Caminhos de Geografia Uberlândia v. 20, n. 72 Dez/2019 p. 360–374 Página 371 the Negro River is the principal representative of the black water rivers type. However, the Negro River basin is quite heterogeneous, with tributaries that totally dissociate from the main channel. The main examples are the Ariaú and Branco rivers, which make a higher contrast with the Negro River main channel concerning color and other variables.
The DO is an environmental variable that shows some peculiarities in this region. It is hard to explain how natural lotic environments can have such small amounts of DO just a few centimeters below the surface. Although this phenomenon does not occur so frequently, it draws attention because it implies a very strong dynamics of oxygen consumption, since it maintains an almost anoxia status in a place where theoretically there is a huge abundance of available DO.
This lack of oxygen does not appear to be corroborated by other variables. The BOD (Biochemical Oxygen Demand), for instance, which would be a very useful variable to reflect the lack of oxygen, due to biodegradable organic matter presence, also does not corroborate with these low values of oxygen according to data showed by Silva (2013). The low levels of DO, in the rivers of the Amazon basin, are considered natural, and the organisms of these environments are adapted to these low oxygenated waters (GOULDING, 1980).
Our analysis suggested the differentiation of three river types with the following characteristics:
1. Rivers of water slightly acidic to basic (pH 6.5 - 7.4) located in west region, rivers of Andean or pré-Andean origin;
2. Amazon River’s left bank tributaries with acidic water (pH 3.5 to 5.5), black and white color, and originated in the Precambrian crystalline Guianas shield;
3. Intermediate (mixed) rivers with waters ranging from slightly acidic to neutral during the dry and rainy season, these rivers are originated in the Precambrian shields, and they receive contributions from different areas along their courses. In this intermediate group are included the Içá, other rivers of the west part of the Amazon basin, the Tapajos and Trombetas rivers originated from the southern and northern parts of the basin (from the archaic Precambrian shields of the Central Brazil and Guianas. respectively). This group also includes rivers such as Jutaí, Tefé and Coari (RÍOS-VILLAMIZAR et al., 2014), considered before as black water rivers, belonging to the west and central Amazon region, according to the classification of Fittkau (1964).
The highest values of electrical conductivity, color, total suspended solids, and turbidity were observed in the waters of the Amazon River (RAM) and its right bank tributaries (TRIB-MD). It should be remembered that logistics have forced us to take water samples in sites close to the small cities, which are usually located on the banks of the Solimões/Amazon River or near the mouth of some of its main tributaries. When sampling is made after the input of one of these main tributaries, even if it takes place at a considerable distance from their confluence, there is a risk of not finding a homogeneous sample, given the delay for a complete mixing between the waters of a tributary and the Solimões/Amazon River main channel. It may also happen that there is not enough time for this mixture to be accomplished, as the main channel can receive the input of another tributary downstream. Therefore, it was difficult to determine if the water composition of the Solimões/Amazon River main channel can reflect what takes place on both banks of the river basin.
CONCLUSIONS
The hydrochemistry of the Amazonian rivers shows that their waters are quite different, with significant variations, in both, temporal and spatial scales. In the rainy season (high precipitation), the waters are more acidic, and the color values increase. In the dry season (low precipitation) the dissolved oxygen and silicate contents increase, as well as the values of electrical conductivity and turbidity. In the main channel of the Solimões/Amazon River, between the cities of Tabatinga and Codajás (high and middle courses of the river), the waters showed different conditions, comparatively with the section Manacapuru to Santarém (middle and lower courses of the river). These conditions may be related to the geological formations and the different components of the Amazon River basin itself, as well as the contribution of its different tributaries which can also dilute the chemical constituents of the water. The Amazon River and its right bank tributaries have higher values of electrolytes, turbidity, and suspended material. These rivers are carrying high quantities of solids which are dissolved and washed down in the middle and lower parts of the River basin. On the other hand, the left bank
Caminhos de Geografia Uberlândia v. 20, n. 72 Dez/2019 p. 360–374 Página 372 tributaries of the Amazon River showed more acidic waters with the lowest amount of nutrients and electrolytes.
The dissolved oxygen in these ecosystems is associated and varies significantly with the wind intensity, river depth, and organic matter content. Some rivers are quite oxygenated such as the Madeira and Tapajós, whereas in other rivers the available oxygen concentration is too low, in some months of the year, as it was observed in the Amazon and Negro rivers.
Concerning the anions, in these water environments predominated the bicarbonates (HCO3-) which is
justified by the balance in the buffering system involving the species H2O, CO2, HCO3-, CO3-2.
Regarding to the cations, calcium predominated in the Amazon River, whereas the rivers originated in the Andean and Sub-Andean region (i.e., the Amazon River and its right bank tributaries) can be considered calcium-bicarbonate-dominated rivers.
The right bank tributaries of the lower Amazon River, which have their origins in the Central Brazilian Shield (e.g., Tapajós and Xingu rivers), showed waters ranging from slightly acidic to slightly alkaline (pH: 6.0 to 7.0) with low ionic load. i.e., electrical conductivity values < 40 µS cm-1.
ACKNOWLEDGMENTS
With the support of the projects financed by MCT/CNPq/CT-AM n° 055/2008. ADAPTA/INPA. MCT/FINEP CT-HIDRO 01/2010/FADESP-UFPA-RHIA and FRONTEIRA/CNPq. E.A.R.V is "Bolsista CAPES/BRASIL".
REFERENCES
APRILE. F. M.; DARWICH. A. J. Regime térmico e a dinâmica do oxigênio em um lago meromítico de águas pretas da região Amazônica. Brazilian Journal of Aquatic Science and Technology. v. 13. p. 37-43. 2009. https://doi.org/10.14210/bjast.v13n1.p37-43
APHA. American Public Health Association. Standard methods for the examination of water and
wastewater. 21ed. Washington: APHA-AWWA-WEF. 2005.
DE PAULA. F. C. F. Geoquímica de sedimentos do Rio Madeira (RO) e alguns afluentes da margem direita. Dissertação (Mestrado em Geoquímica) – Niterói:UFF. 1990.
DUQUE. S. R.; RUIZ. J. E.; GÓMEZ. J.; ROESSLER. E. Limnología. In: IGAC. (Ed.) Zonificación
ambiental para el Plan modelo Colombo-Brasilero (eje Apaporis-Tabatinga): PAT. Bogotá:
Editorial Linotipia. 1997. p. 71-134.
FAY. E. F.; SILVA. M. S. S. Índice do uso Sustentável da Água (ISA-Água) - região do submédio São Francisco. São Paulo: Embrapa Meio Ambiente. 2006.
FILIZOLA. N.; GUYOT. J. L. Fluxo de sedimentos em Suspensão nos rios da Amazônia. Revista de
Geociências. v. 41. n. 4. p. 566-576. 2011.https://doi.org/10.25249/0375-7536.2011414566576
FITTKAU. E. J. Remarks on limnology of Central-Amazon rain-forest streams. Verh. Internat. Verein.
Limnol.. v. 15. p. 1092-1096. 1964.https://doi.org/10.1080/03680770.1962.11895653
GAILLARDET. J.; DUPRÉ. B.; ALLÉGRE. C. J.; NÉGREL. P. Chemical And Physical Denudation In The Amazon River Basin. Chemical Geology. v. 142. p. 141-173. 1997.
https://doi.org/10.1016/S0009-2541(97)00074-0
GOLTERMAN. H.; CLYMO. R. S.; OHMSTAD. M. A. M. Methods for physical & chemical analysis
of freshwater. Oxford: Blackwell Scientific Publications. 1978. (IBP Handbook 8).
GOULDING. M. Fishes and the Forest. explorations in Amazonian natural history. Berkeley: University of California Press. 1980.
GOULDING. M.; BARTHEM. R.; FERREIRA. E. The Smithsonian Atlas of the Amazon. Washington e Londres: Smithsonian Books. 2003.
GUYOT. J. L.; FILIZOLA. N.; LARAQUE. A. Régime et bilan du flux sédimentaire de l’Amazone à Óbidos (Pará. Brésil) de 1995 a 2003. In: HOROWITZ. A. J.; WALLING. D. E. (Ed.) Sediment
Caminhos de Geografia Uberlândia v. 20, n. 72 Dez/2019 p. 360–374 Página 373 Budgets 1: Proceedings of Symposium S1 held during the Seventh IAHS Scientific Assembly. 291 ed.
Foz do Iguaçu: IAHS Publ.. 2005. p. 347-354.
HIBAM. Hidrologia da Bacia Amazônica: Terceira campanha de medições de vazão e amostragem de água e sedimentos na bacia do rio Madeira e no rio Amazonas (La Paz. Porto Velho e Santarém). Brasília: HiBAm. 1995.Disponível em:
<https://www.ore-hybam.org/index.php/eng/content/download/182/1089/file/br_03.pdf>. Acesso em: 05 de dezembro de 2018.
HIBAM. Hidrologia da Bacia Amazônica: 11a Campanha de medições de vazão e amostragem de
água nas bacias dos rios Madeira. Branco e rio Solimões/Amazonas. Brasília: HiBAm. 1998. Disponível em: <www.ore-hybam.org/index.php/eng/content/download/191/1125/file/br_11.pdf>. Acesso em: 05 de dezembro de 2018.
HORBE. M. A. C.; GOMES. I. L. F.; MIRANDA. S. F.; SILVA. M. S. R. Contribuição à hidroquímica de drenagens no Município de Manaus – AM. Acta Amazonica. v. 35. n. 2. p. 119-124. 2005.
https://doi.org/10.1590/S0044-59672005000200002
HORBE. M. A. C.; QUEIROZ. M. M. A.; MOURA. C. A. V. Geoquímica das águas do médio e baixo rio Madeira e seus principais tributários-Amazonas-Brasil. Acta Amazonica. v. 43. n. 4. p. 489-504. 2013.https://doi.org/10.1590/S0044-59672013000400011
IBGE - Instituto Brasileiro de Geografia e Estatística. Geografia do Brasil: região Norte. 2007. Disponível em: <ftp://geoftp.ibge.gov.br/.../amazonia_legal/lista_de_municipios_da_amaz>. Acesso em: 12 de março de 2013.
JUNK. W. J.; FURCH. K. Química da água e macrófitas aquáticas de rios e igarapés na Bacia Amazônia e nas áreas adjacentes. Acta Amazonica. v. 10. n. 3. p. 611-633. 1980.
https://doi.org/10.1590/1809-43921980103611
JUNK. W. J. Recursos hídricos da região amazônica: utilização e preservação. Acta Amazonica. v. 9. p. 37-51. 1983.https://doi.org/10.1590/1809-43921979094s037
KRISTENSEN. E.; BOUILLON. S.; DITTMAR. T.; MARCHAND. C. Organic carbon dynamics in mangrove ecosystems. A Review Aquatic botany. v. 89. p. 201-219. 2008.
https://doi.org/10.1016/j.aquabot.2007.12.005
LEENHER. J. A.; SANTOS. U. M. Considerações sobre os processos de sedimentação na água preta ácida do rio Negro (Amazônia Central). Acta Amazonica. v. 10. n. 2. p. 343-355. 1980.
https://doi.org/10.1590/1809-43921980102343
LEITE. N. K.; KRUSCHE. A. V.; BALLESTER. M. V. R.; VICTORIA. R. L.; RICHEY. J. E.; GOMES. B. M. Intra And Interannual Variability In The Madeira River Water Chemistry and Sediment Load.
Biogeochemistry. v. 105. p. 37–51. 2011.https://doi.org/10.1007/s10533-010-9568-5
NASCIMENTO. D. A.; MAURO. C. A.; GARCIA. M. G. L. Geomorfologia da Folha SA. 21-Santarém. In: Departamento Nacional da Produção Mineral. Projeto Radambrasil: Geologia. geomorfologia. pedologia. vegetação e uso potencial da terra. Levantamento de Recursos Naturais. Rio de Janeiro: MME/DNPM. 1976. p. 98-131.
OTCA/PNUMA/OEA. Gerenciamento Integrado e Sustentável dos Recursos Hídricos
Transfronteiriços na Bacia do Rio Amazonas. Relatório Final. Agência Nacional da Água – ANA.
2006.
RÍOS-VILLAMIZAR. E. A.; PIEDADE. M. T. F.; DA COSTA J. G.; ADENEY. J. M.; JUNK. W. J. Chemistry of different Amazonian water types for river classification: a preliminary review. WIT
Transactions on Ecology and The Environment. v. 178. p. 17-28. 2014.
https://doi.org/10.2495/WS130021
R Development Core Team. R: A language and environment for statistical computing. R Foundation for Statistical Computing (Vienna. Austria). Disponível em: <http://www.R-project.org/>. Acesso em: 07 de janeiro de 2013.
Caminhos de Geografia Uberlândia v. 20, n. 72 Dez/2019 p. 360–374 Página 374
SANTOS. U. M.; BRINGEL. S. R. B.; RIBEIRO. M. N. G.; SILVA. M. N. P. Rios Da Bacia Amazônica II. Os Afluentes do Rio Branco. Acta Amazonica. v. 15. n. 1-2. p. 147-156. 1985.
https://doi.org/10.1590/1809-43921985152156
SHÁNCHEZ-BOTERO. J. J.; GARCEZ. D. S.; LOBÓN-CERVJÁ. J. Oxigênio dissolvido e temperatura em lagos da região de Ati Paraná-Solimões. Amazônia Central. Brasil. Acta Limnologica
Brasiliensia. v. 13. p. 45-51. 2001.
SHANCHEZ-BOTERO. J.I.. et al. Ictiofauna associada às macrófitas aquáticas Eichhornia auzerea (SW.) Kunth. e Eichhornia crassipes (MArt. .) Solms. no lago Camaleão. Amazônia central. Brasil. Acta Scientiarum. Biological Sciences. v. 25. n. 2. p. 369-375. 2003.
https://doi.org/10.4025/actascibiolsci.v25i2.2026
SILVA. C. L. Análise da Tectônica Cenozóica da Região de Manaus e Adjacências. Tese (Doutorado) – Rio Claro: UNESP. 2005.
SILVA. M. L.; SILVA. M. S. R. Hidrogeoquímica das Águas Subterrâneas da Cidade de Iranduba (AM). Brasil. Caminhos de Geografia. v. 8. n. 22. p. 87-96. 2007.
SILVA. M. S. R. Bacia hidrográfica do Rio Amazonas: contribuição para o enquadramento e preservação. Tese (Doutorado em Química) – Manaus: UFAM. 2013.
SIOLI. H. As águas do Alto Rio Negro. Boletim Técnico Instituto Agronômico do Norte. v. 32. p. 117-155. 1956.https://doi.org/10.1007/978-94-009-6542-3
SIOLI. H. Hydrochemistry and geology in the Brazilian Amazon Region. Amazoniana. v. 3. p. 267-277. 1968.
SIOLI. H. Introduction: history of discovery of the Amazon and of the research of Amazonian waters and landscapes. In: SIOLI. H. (Ed.) Amazon: limnology and landscape ecology of a mighty tropical river and its basin. The Hague: Dr. W. Junk. 1984. p. 1-13.
STALLARD. R. F.; EDMOND. J. M. Geochemistry of the Amazon basin: 2. The influence of the geology and weathering environment on the dissolved load. J. Geophys. Res. v. 88. p. 9671-9688. 1983.https://doi.org/10.1029/JC088iC14p09671
iiiRecebido em: 08/12/2018