Braz. J. of Develop.,Curitiba, v. 6, n.6, p.36073-36093 jun. 2020. ISSN 2525-8761
Vapor-liquid equilibrium for binary systems ethanol (1) and water (2) and
methyl acetate (1) and ethanol (2): Thermodynamic consistency and data
prediction
Equilíbrio líquido-vapor para os sistemas binários etanol (1) e água (2) e
metil acetato (1) e etanol (2): Consistência termodinâmica e predição de
dados
DOI:10.34117/bjdv6n6-233
Recebimento dos originais:08/05/2020 Aceitação para publicação:08/06/2020
Talita Kênya Oliveira Costa
Mestranda em Engenharia Química pela Universidade Federal do Rio Grande do Norte Instituição: Universidade Federal do Rio Grande do Norte
Endereço: Av. Senador Salgado Filho, 3000 – Lagoa Nova, Natal – RN, Brasil E-mail: [email protected]
Leonete Cristina de Araújo Ferreira Medeiros Silva
Doutoranda em Engenharia Química pela Universidade Federal do Rio Grande do Norte Instituição: Universidade Federal do Rio Grande do Norte
Endereço: Av. Senador Salgado Filho, 3000 – Lagoa Nova, Natal – RN, Brasil E-mail: [email protected]
Cláudia Bezerra Silva
Mestranda em Engenharia Química pela Universidade Federal do Rio Grande do Norte Instituição: Universidade Federal do Rio Grande do Norte
Endereço: Av. Senador Salgado Filho, 3000 – Lagoa Nova, Natal – RN, Brasil E-mail: [email protected]
Beatriz de Azevedo
Mestranda em Engenharia Química pela Universidade Federal do Rio Grande do Norte Instituição: Universidade Federal do Rio Grande do Norte
Endereço: Av. Senador Salgado Filho, 3000 – Lagoa Nova, Natal – RN, Brasil E-mail: [email protected]
Talison Kennedy Oliveira Costa
Graduando em Engenharia da Computação pelo Instituto Federal da Paraíba Instituição: Instituto Federal da Paraíba
Endereço: R. Tranqüilino Coelho Lemos, 671 – Dinamérica, Campina Grande – PB, Brasil E-mail: [email protected]
Raquel Revoredo Pinheiro de Souza
Mestranda em Engenharia Química pela Universidade Federal do Rio Grande do Norte Instituição: Universidade Federal do Rio Grande do Norte
Endereço: Av. Senador Salgado Filho, 3000 – Lagoa Nova, Natal – RN, Brasil E-mail: [email protected]
Braz. J. of Develop.,Curitiba, v. 6, n.6, p.36073-36093 jun. 2020. ISSN 2525-8761 ABSTRACT
Ethanol or ethyl alcohol is an organic substance obtained from fermentation of sugars, hydration of ethylene or reduction of acetaldehyde. It consists of two carbon atoms, five hydrogen atoms and one hydroxyl group. It is the main biofuel used in the world, it is a renewable energy source and alternative to fossil fuels. In Brazil in 1975 was launched by the Federal Government the National Alcohol Program to combat the rampant use of oil and encourage the planting of sugar cane in the country. Given the importance of the use of ethanol, it is extremely important to know its thermodynamic properties for process optimization making them more energy efficient, as well as for the design of new industrial plants and equipment for the various processes. This work has as objective the study of Vapor-Liquid Equilibrium (VLE) of binary systems with ethanol, being the first ethanol (1) - water (2) and the second methyl acetate (1) + ethanol (2). To verify the thermodynamic consistency test of the data, the area test was applied, tested in the computational routine consist.exe and a data prediction was simulated in SPECS. The tests provide results of data consistency as well as the predator or VLE behavior of the binary systems studied for high pressure and temperature situations.
Keywords: Ethanol, Biofuel, Thermodynamic properties.
RESUMO
O etanol ou álcool etílico, é uma substância orgânica obtida da fermentação de açúcares, hidratação do etileno ou redução de acetaldeído. É constituído por dois átomos de carbono, cinco de hidrogênio e um grupo hidroxila. É o principal biocombustível utilizado no mundo, é fonte de energia renovável e alternativa para combustíveis fósseis. No Brasil em 1975 foi lançado pelo Governo Federal o Programa Nacional do Álcool para combater o uso desenfreado do petróleo e incentivar o plantio da cana-de-açúcar no país. Frente a tamanha importância do uso do etanol, é de extrema importância conhecer suas propriedades termodinâmicas para otimização de processos tornando-os energeticamente mais eficientes, como também para o projeto de novas plantas industriais e equipamentos para os diversos processos. O presente trabalho tem como objetivo o estudo do Equilíbrio Líquido-Vapor (.VLE) de sistemas binários com etanol, sendo o primeiro etanol (1) – água (2) e o segundo metil-acetato (1) + etanol (2). Para verificação do teste de consistência termodinâmica dos dados foi aplicado o teste da área, testado na rotina computacional consist.exe e a predição de dados foi simulada no SPECS. Os testes forneceram resultados da consistência dos dados, bem como possível predizer o comportamento do .VLE dos sistemas binários estudados para situação de alta pressão e temperatura.
Palavras-chave: Etanol; Biocombustíveis; Propriedades termodinâmicas.
1 INTRODUCTION
Ethanol is a type of two-carbon alcohol that is widely used for several reasons. A large part of industrial alcohol is used in alcoholic beverages, but also with other applications as a raw material or intermediate in the chemical synthesis of esters, chains of organic compounds, detergents, paints, cosmetics, medicines, foods, among others (GONÇALVES et al., 2010).
Braz. J. of Develop.,Curitiba, v. 6, n.6, p.36073-36093 jun. 2020. ISSN 2525-8761 In recent years it has been extensively studied and new uses are discovered as a source of renewable energy and a potential to reduce the use of fossil fuels. Ethanol can be obtained through simple processes like fermentation and has a lower price than gasoline (AKHAIRI and KAMARUDIN, 2015). It is also used as a polar co-solvent for supercritical fluids in order to increase solubility of the solute and improve selectivity of the supercritical solvent (BAZAEV, 2007).
Any design of plants and systems that use ethanol requires an accurate knowledge of the fluid's properties and, therefore, this compound is widely studied in the Academy and Industry (DILLON AND PENONCELLO, 2004). Accurate values of the thermodynamic properties of fluids are essential for energy efficient processes. State equations are often used to correlate properties of pure fluids and mixtures, they are expressed as a function of pressure with independent variables of temperature and density (LEMMON et al., 2009).
In thermodynamics, experimental data is extremely important to support project and operations decisions. However, the quality of the information obtained through the experiments needs to present adequate consistency so that these data can be used in the prediction of values in situations in which the measurements are often expensive and difficult. For the study of the Vapor-Liquid Equilibrium (VLE) of binary systems there is a range of mathematical models that can be used to describe the behavior of the mixture of the components. For the problems to be solved the formulation is based on the fugacity coefficient for the vapor phase and the activity coefficient for the liquid phase. The models are being improved to better describe the VLE behavior of the system under the conditions established by the engineering problem to be solved.
In the present work, binary systems with Ethanol were studied. The first system studied was Ethanol (1) + Water (2) and the second binary system was Methyl-acetate (1) + Ethanol (2). The objective was to verify the thermodynamic consistency of the experimental. VLE data obtained in the literature and then to predict data for the behavior in critical conditions of the mixture.
2 MATERIALS AND METHODS
2.1 THERMODYNAMIC CONSISTENCY TEST OF EXPERIMENTAL DATA
The area consistency test relates the activity coefficients of the components of the mixture, based on correlations derived from the GibbsDuhem equation. The activity
Braz. J. of Develop.,Curitiba, v. 6, n.6, p.36073-36093 jun. 2020. ISSN 2525-8761 coefficients (γ) are evaluated using Raoult's Law, using the VLE experimental data, as shown in Equations (1) and (2). 𝛾1 = 𝑦1𝑃 𝑥1𝑃1𝑠𝑎𝑡 (1) 𝛾2 = (1 − 𝑦1)𝑃 (1 − 𝑥1)𝑃2𝑠𝑎𝑡 (2)
When plotting the graph of ln (γ1 / γ2) versus x1, there is a curve that can be linear or polynomial. When drawing a line on the “zero axis”, two areas are calculated, above and below the axis. The ratio of the smallest and largest area (A/B) will indicate a percentage that will be evaluated according to Table 1, to define whether the experimental data are consistent or not. Saturation pressures for each component were calculated according to the Antoine equation and the test was performed using Microsoft Office Excel software.
For the deviation consistency test, SPECS v5.63 software was used. This tool calculates the relative deviations from a regression of the experimental data, T-x,y for isobaric systems or P-x,y for isothermal systems. The results obtained are from the calculation of temperature and / or pressure (depending on the system) and the relative deviations from the calculation of the composition of the vapor phase in relation to the experimental data.
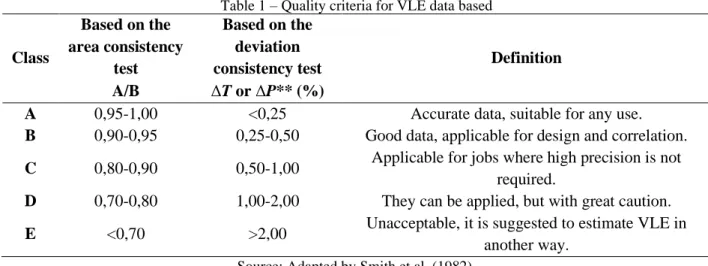
At the end, an average of ΔT or ΔP (difference between experimental and calculated) and an average for the relative deviations of the composition of the vapor phase (yi) is performed. Results are evaluated according to Table 1.
Table 1 – Quality criteria for VLE data based
Class Based on the area consistency test Based on the deviation
consistency test Definition
A/B ΔT or ΔP** (%)
A 0,95-1,00 <0,25 Accurate data, suitable for any use.
B 0,90-0,95 0,25-0,50 Good data, applicable for design and correlation.
C 0,80-0,90 0,50-1,00 Applicable for jobs where high precision is not required.
D 0,70-0,80 1,00-2,00 They can be applied, but with great caution.
E <0,70 >2,00 Unacceptable, it is suggested to estimate VLE in
another way.
Braz. J. of Develop.,Curitiba, v. 6, n.6, p.36073-36093 jun. 2020. ISSN 2525-8761 2.2 EXPERIMENTAL DATA COLLECTED
2.2.1 System 01: ethanol (1) + water (2)
Vapor-Liquid Equilibrium (VLE) data were collected for the Ethanol + Water system at high and normal pressures in isobaric and isothermal systems.
For isobaric, experimental data from Othmer et al. (1951), of temperature and composition of the liquid and steam phases, at a pressure of 287511 Pa, and in Alvarez et al. (2011), of temperature and composition of the liquid and steam phases, at a pressure of 101300 Pa (759.81 mmHg) (Table 3).
For isotherms, the experimental data from Cristino et al. (2013) of pressure and composition of the liquid and vapor phases, at a temperature of 381.4 K and in Griswold et al. (1943) pressure and composition of the liquid and vapor phases, at a temperature of 473.15 K.
2.2.2 System 02: methyl acetate (1) + ethanol (2)
The study of the methyl acetate system (1) + ethanol (2) was carried out following the flow described in the scheme shown in Figure 1, whose sequence was based on the search for experimental data from the binary system in the number 171 database of NIST Literature Report Builder for Thermophysical and Thermochemical. In all, there was access to four publications containing data of interest, equivalent to six sets of isobaric data and two isotherms. The thermodynamic consistency of the data, through the “Area Test”, was performed in all of them. The best classification for each group was based on the other tests and predictions of this system. Both for a single isobaric system and for the isothermal system, the data consistency test was applied through the comput.exe routine consist.exe.
The next step was performed for the prediction of VLE data from the binary system, performed using the CERE SPECS® software, version 5.63. The simulations performed were based on the use of different thermodynamic models for the liquid and vapor phase, the state equation (EOS) selected was Hayden-O'Connel's Second Virial Coefficient, the model for determining the activity coefficient was “UNIFAC VLE 1 coeff. ”, The vapor pressure was calculated from the Antoine Constants and the Poynting correction factor was applied.
The experimental data obtained in the literature that passed the “Area Test” are shown in Table 2, whose emphasis corresponds to the set used in the other simulations. One way to classify the data from this test is following the proposition of Smith et al. (1982), shown in Table 1. The deviation consistency test was performed using the “consist” routine and the linear regression in the “Specs”.
Braz. J. of Develop.,Curitiba, v. 6, n.6, p.36073-36093 jun. 2020. ISSN 2525-8761 To use the “consist”, it was necessary to prepare a file in “* .txt” format with the requested data, the summary of which can be found in Table 3, Tables 4 and 5 present the experimental data from the literature for the System Isobaric and Isothermal, respectively.
Figure 1 - Schematic of the computational practice
Table 2 – Characteristics of the Pure Components to perform the “Area Test” - Constants of Antoine
Function of the Steam Pressure Parameters:
Component A B C TMin(K) TMax(K)
Methyl acetate
(1) 7.0652 1157.63 219.726 175.15 506.55
Ethanol (2) 8.1122 1592.864 226.184 159.05 513.92
Source: DIPPR, 2019.
Table 3 – Input Parameter in the Computational Routine “Consiste.exe”
Component Critical Temperature CT (K) Critical Pressure CP (atm) Rotation Radius RR (Å) Association Parameter ETA Dipolo MomentDMU (Debye) Critical Compressibility Factor CZ Methyl acetate (1) 506.55 46.879 2.996 0.85 1.6787 0.257 Ethanol (2) 513.92 60.676 2.259 1.4 1.6906 0.24
Braz. J. of Develop.,Curitiba, v. 6, n.6, p.36073-36093 jun. 2020. ISSN 2525-8761
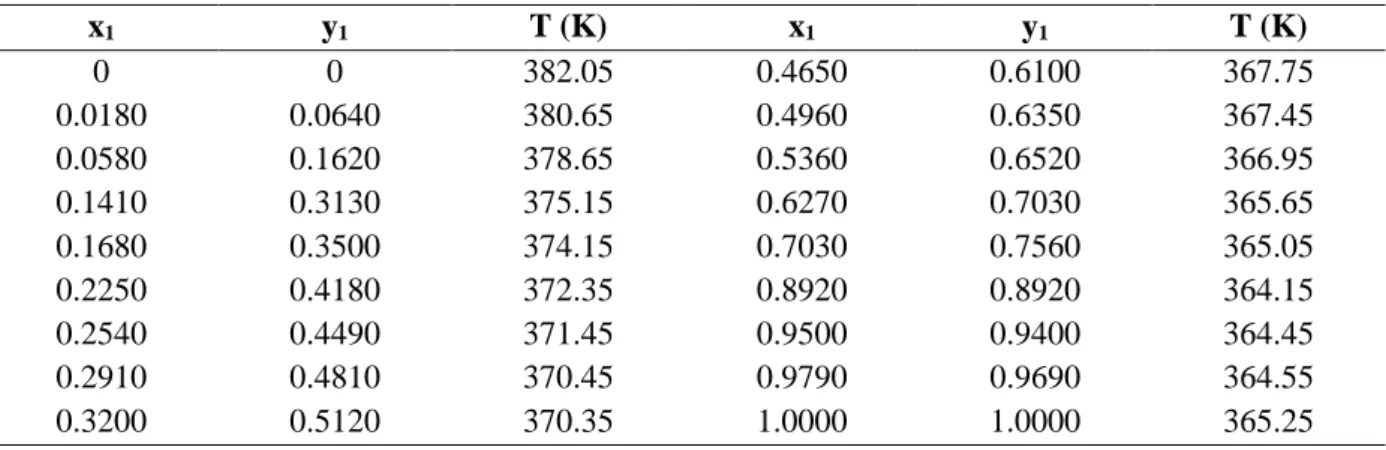
Table 4 - VLE Vapor-Liquid Equilibrium Data of the Methyl-Acetate (1) + Ethanol (2) System at 0.3 MPa
x1 y1 T (K) x1 y1 T (K) 0 0 382.05 0.4650 0.6100 367.75 0.0180 0.0640 380.65 0.4960 0.6350 367.45 0.0580 0.1620 378.65 0.5360 0.6520 366.95 0.1410 0.3130 375.15 0.6270 0.7030 365.65 0.1680 0.3500 374.15 0.7030 0.7560 365.05 0.2250 0.4180 372.35 0.8920 0.8920 364.15 0.2540 0.4490 371.45 0.9500 0.9400 364.45 0.2910 0.4810 370.45 0.9790 0.9690 364.55 0.3200 0.5120 370.35 1.0000 1.0000 365.25 (Source: SUSIAL, 2011)
Table 5 - VLE Vapor-Liquid Equilibrium Data of the Binary Methyl-Acetate System (1) + Ethanol (2) at 45ºC
x1 y1 P (atm) x1 y1 P (atm) 0.0280 0.1780 0.2737 0.6470 0.7910 0.6092 0.1120 0.4280 0.3684 0.7650 0.8370 0.6276 0.3980 0.6960 0.5461 0.7890 0.8490 0.6316 0.4630 0.7200 0.5645 0.8590 0.8860 0.6408 0.5020 0.7360 0.5776 0.9370 0.9420 0.6513 0.5640 0.7570 0.5961 (Source: NAGATA, 1972)
3 RESULTS AND DISCUSSIONS
3.1 SYSTEM01: ETHANOL (1) - WATER (2) 3.1.1 Area consistency test
Table 6 shows the experimental data on temperature (Texp), composition of the liquid phase (x1exp) and composition of the vapor phase (y1exp) for the isobaric system. This same table also lists the saturation pressure values calculated by Antoine for each species (Psat,1 and Psat,2); the activity coefficients (γ1 and γ2) and the ln calculations (γ1 / γ2) for each experimental data point. Table7 are the isothermal VLE data for the system as well as the calculations. Figures 2 and 3 show the behaviors of ln (γ1 / γ2) versus x1.
Table 6 -VLE data for Ethanol system (1) + Water (2) 759.81 mmHg.
Texp/K x
1exp y1exp Psat,1/mmHg Psat,2/mmHg γ1 γ2 ln(γ1/γ2)
369.14 0.015 0.17 1472.61 657.16 5.85 0.97 1.79 365.84 0.032 0.276 1308.95 581.44 5.01 0.98 1.63 363.83 0.046 0.336 1216.85 539.01 4.56 0.98 1.54 361.65 0.068 0.398 1123.08 495.95 3.96 0.99 1.39 360.87 0.079 0.42 1091.02 481.26 3.70 0.99 1.31 358.95 0.119 0.473 1015.32 446.65 2.97 1.02 1.07
Braz. J. of Develop.,Curitiba, v. 6, n.6, p.36073-36093 jun. 2020. ISSN 2525-8761 357.69 0.163 0.508 968.06 425.09 2.45 1.05 0.85 357.14 0.19 0.524 948.01 415.96 2.21 1.07 0.72 356.87 0.206 0.532 938.29 411.54 2.09 1.09 0.65 356.48 0.232 0.544 924.40 405.22 1.93 1.11 0.55 356.42 0.236 0.546 922.28 404.26 1.91 1.12 0.53 356.38 0.239 0.547 920.87 403.62 1.89 1.12 0.52 355.85 0.281 0.565 902.33 395.19 1.69 1.16 0.38 355.79 0.286 0.567 900.25 394.25 1.67 1.17 0.36 355.74 0.291 0.569 898.52 393.46 1.65 1.17 0.34 355.6 0.303 0.574 893.69 391.27 1.61 1.19 0.31 355.16 0.344 0.59 878.66 384.44 1.48 1.24 0.18 354.94 0.367 0.599 871.22 381.07 1.42 1.26 0.12 354.81 0.38 0.605 866.85 379.08 1.40 1.28 0.09 354.7 0.392 0.61 863.16 377.41 1.37 1.29 0.06 354.65 0.397 0.612 861.49 376.66 1.36 1.30 0.05 354.53 0.41 0.617 857.50 374.84 1.33 1.32 0.01 354.51 0.412 0.618 856.83 374.54 1.33 1.32 0.01 353.91 0.481 0.648 837.09 365.60 1.22 1.41 -0.14 353.55 0.527 0.669 825.43 360.32 1.17 1.48 -0.23 352.92 0.617 0.715 805.34 351.23 1.09 1.61 -0.39 352.51 0.688 0.754 792.49 345.42 1.05 1.73 -0.50 352.34 0.722 0.775 787.21 343.04 1.04 1.79 -0.55 352.19 0.757 0.797 782.58 340.94 1.02 1.86 -0.60 351.92 0.851 0.862 774.30 337.20 0.99 2.09 -0.74 351.87 0.898 0.899 772.77 336.51 0.98 2.24 -0.82 351.87 0.908 0.908 772.77 336.51 0.98 2.26 -0.83 351.88 0.931 0.928 773.08 336.65 0.98 2.36 -0.88 351.9 0.944 0.941 773.69 336.93 0.98 2.38 -0.89 351.9 0.947 0.943 773.69 336.93 0.98 2.43 -0.91 351.94 0.967 0.963 774.91 337.48 0.98 - -
Table 7 – VLE data for Ethanol system (1) + Water (2) 381.4 K
Pexp/mmHg x
1exp y1exp Psat,1/mmHg Psat,2/mmHg γ1 γ2 ln(γ1/γ2)
1170.85 0.0172 0.1495 2235.30 1014.33 4.55 1.00 1.52 1372.61 0.043 0.2713 2235.30 1014.33 3.87 1.03 1.32 1445.37 0.0563 0.3314 2235.30 1014.33 3.81 1.01 1.33 1761.15 0.1592 0.4736 2235.30 1014.33 2.34 1.09 0.77 1890.16 0.2643 0.5375 2235.30 1014.33 1.72 1.17 0.38 1920.91 0.2894 0.561 2235.30 1014.33 1.67 1.17 0.35 1993.66 0.3585 0.5664 2235.30 1014.33 1.41 1.33 0.06 1993.66 0.3618 0.5687 2235.30 1014.33 1.40 1.33 0.05 2024.42 0.4173 0.5925 2235.30 1014.33 1.29 1.40 -0.08 2033.42 0.4215 0.5886 2235.30 1014.33 1.27 1.43 -0.12 2028.17 0.4256 0.5979 2235.30 1014.33 1.27 1.40 -0.09 2036.42 0.4271 0.5979 2235.30 1014.33 1.28 1.41 -0.10 2037.17 0.4367 0.5977 2235.30 1014.33 1.25 1.43 -0.14
Braz. J. of Develop.,Curitiba, v. 6, n.6, p.36073-36093 jun. 2020. ISSN 2525-8761 2051.42 0.4371 0.6017 2235.30 1014.33 1.26 1.43 -0.12 2055.17 0.4404 0.6092 2235.30 1014.33 1.27 1.41 -0.11 2062.67 0.4535 0.6144 2235.30 1014.33 1.25 1.43 -0.14 2064.17 0.4587 0.6198 2235.30 1014.33 1.25 1.43 -0.14 2070.92 0.4771 0.6119 2235.30 1014.33 1.19 1.52 -0.24 2099.42 0.4974 0.6294 2235.30 1014.33 1.19 1.53 -0.25 2104.67 0.5015 0.6312 2235.30 1014.33 1.19 1.54 -0.26 2120.43 0.5333 0.6526 2235.30 1014.33 1.16 1.56 -0.29 2122.68 0.5389 0.6491 2235.30 1014.33 1.14 1.59 -0.33 2158.68 0.6382 0.7024 2235.30 1014.33 1.06 1.75 -0.50 2179.68 0.7099 0.7371 2235.30 1014.33 1.01 1.95 -0.65 2215.68 0.7938 0.8089 2235.30 1014.33 1.01 2.02 -0.70 2163.18 0.9967 0.9977 2235.30 1014.33 0.97 1.49 -0.43
Figure 2 - Graph of the area consistency test for the Ethanol (1) + Water (2) system at 759.81 mmHg
Figure 3 - Graph of the area consistency test for the Ethanol (1) + Water (2) system at 381.4 K
After making an adjustment in Microsoft Office Excel, of the 2nd order and 3rd order polynomial type, for systems 1 and 2, respectively, it was possible to calculate areas A and B for each system studied using the integral method. The calculated areas, as well as the A / B results for each system are shown in Table 08.
Table 08 - Results of the area test for the isobaric and isothermal systems
SISTEM AREA A AREA B A/B CLASSIFICATION
OF A/B
Isobaric 0.508 0.851 0.597 E (<0.70)
Isothermal 0.541 1.169 0.463 E (<0.70)
Analyzing Table 08, it can be seen that for both the isobaric and isothermal systems, the A/B result corresponds to class E in Table 1, suggesting that the experimental data are not consistent and it is suggested to estimate the VLE on the other hand. way. This can be justified
Braz. J. of Develop.,Curitiba, v. 6, n.6, p.36073-36093 jun. 2020. ISSN 2525-8761 by the fact that one of the components is very concentrated in the vapor phase (ethanol) and that the activity coefficients are close to 1.
3.1.2 Deviation consistency test
Tables 09 and 10 show the results for testing the deviations generated by SPECS for the isobaric and isothermal systems, respectively. Where Δy corresponds to the value of the deviation of the composition in the vapor phase calculated in relation to its experimental value. Similarly, ΔT and ΔP correspond to the values of deviations from temperature and pressure, respectively.
Table 8 summarizes the results obtained from the averages of the deviations generated by SPECS for the Ethanol + Water, isobaric and isothermal systems.
Comparing the value of the mean of ΔT and ΔP obtained for the two systems (Table 11) with Table 1, we can see both are in class A, because their values are less than 0.25. Thus, we can say that, by testing the deviations, the two sets of experimental data are accurate and suitable for any use.
The Δy values for each system are greater than 0.01, indicating that the data are not consistent. In the case of the Δy error, it can be caused by the hydrogen bonds that hold the water molecules in a way that makes it difficult to change the phase, increasing the experimental errors of this magnitude.
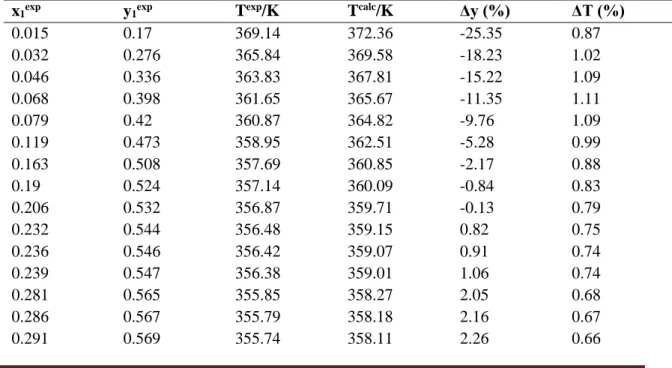
Table 09 – Results of the deviation test generated by SPECS: VLE data for the Ethanol (1) + Water (2) system at 759.81 mmHg
x1exp y1exp Texp/K Tcalc/K Δy (%) ΔT (%)
0.015 0.17 369.14 372.36 -25.35 0.87 0.032 0.276 365.84 369.58 -18.23 1.02 0.046 0.336 363.83 367.81 -15.22 1.09 0.068 0.398 361.65 365.67 -11.35 1.11 0.079 0.42 360.87 364.82 -9.76 1.09 0.119 0.473 358.95 362.51 -5.28 0.99 0.163 0.508 357.69 360.85 -2.17 0.88 0.19 0.524 357.14 360.09 -0.84 0.83 0.206 0.532 356.87 359.71 -0.13 0.79 0.232 0.544 356.48 359.15 0.82 0.75 0.236 0.546 356.42 359.07 0.91 0.74 0.239 0.547 356.38 359.01 1.06 0.74 0.281 0.565 355.85 358.27 2.05 0.68 0.286 0.567 355.79 358.18 2.16 0.67 0.291 0.569 355.74 358.11 2.26 0.66
Braz. J. of Develop.,Curitiba, v. 6, n.6, p.36073-36093 jun. 2020. ISSN 2525-8761 0.303 0.574 355.60 357.92 2.46 0.65 0.344 0.59 355.16 357.33 3.14 0.61 0.367 0.599 354.94 357.03 3.45 0.59 0.38 0.605 354.81 356.86 3.46 0.58 0.392 0.61 354.70 356.71 3.55 0.57 0.397 0.612 354.65 356.65 3.6 0.56 0.41 0.617 354.53 356.49 3.77 0.55 0.412 0.618 354.51 356.47 3.76 0.55 0.481 0.648 353.91 355.68 4.1 0.50 0.527 0.669 353.55 355.19 4.26 0.46 0.617 0.715 352.92 354.30 4.19 0.39 0.688 0.754 352.51 353.67 4.14 0.33 0.722 0.775 352.34 353.38 3.94 0.30 0.757 0.797 352.19 353.10 3.79 0.26 0.851 0.862 351.92 352.42 3.15 0.14 0.898 0.899 351.87 352.11 2.6 0.07 0.908 0.908 351.87 352.05 2.38 0.05 0.931 0.928 351.88 351.91 2.01 0.01 0.944 0.941 351.90 351.83 1.64 0.02 0.947 0.943 351.90 351.81 1.66 0.02 0.967 0.963 351.94 351.70 1.15 0.07
Table 10 – Results of the deviation test generated by SPECS: VLE data for the Ethanol (1) + Water (2) system at 381.4 K
x1exp y1exp Pexp/mmHg Pcalc/mmHg Δy (%) ΔP (%)
0.0172 0.1495 1170.85 1171.16 -8.93 8.83 0.043 0.2713 1372.61 1372.56 -3.84 10.96 0.0563 0.3314 1445.37 1445.52 -8.02 11.04 0.1592 0.4736 1761.15 1760.92 -0.27 9.88 0.2643 0.5375 1890.16 1890.12 1.65 8.00 0.2894 0.561 1920.91 1921.28 -0.16 8.03 0.3585 0.5664 1993.66 1993.48 5.1 7.97 0.3618 0.5687 1993.66 1993.48 4.96 7.82 0.4173 0.5925 2024.42 2024.64 5.33 6.83 0.4215 0.5886 2033.42 2033.76 6.38 7.10 0.4256 0.5979 2028.17 2028.44 5.06 6.67 0.4271 0.5979 2036.42 2036.04 5.19 6.98 0.4367 0.5977 2037.17 2036.8 6.01 6.60 0.4371 0.6017 2051.42 2051.24 5.34 7.26 0.4404 0.6092 2055.17 2055.04 4.31 7.29 0.4535 0.6144 2062.67 2062.64 4.49 7.11 0.4587 0.6198 2064.17 2064.16 3.99 7.00 0.4771 0.6119 2070.92 2071 6.85 6.61 0.4974 0.6294 2099.42 2099.12 5.51 7.10 0.5015 0.6312 2104.67 2104.44 5.55 7.19 0.5333 0.6526 2120.43 2120.4 4.62 6.74
Braz. J. of Develop.,Curitiba, v. 6, n.6, p.36073-36093 jun. 2020. ISSN 2525-8761 0.5389 0.6491 2122.68 2122.68 5.64 6.66 0.6382 0.7024 2158.68 2158.4 5.47 4.96 0.7099 0.7371 2179.68 2179.68 6.4 3.80 0.7938 0.8089 2215.68 2215.4 3.81 3.19 0.9967 0.9977 2163.18 2162.96 -0.06 3.16
Table 11 – Results of the deviation tests for the isobaric and isothermal systems.
Isobaric Isothermical
ΔT 0.0055876 ΔP 0.002692
Δy 0.047411 Δy 0.031747
3.1.3 Prediction of experimental data
Table 12 shows the values of the Aij iteration parameters (UNIQUAC model) obtained after a regression in SPECS with the VLE experimental data of the systems studied.
Table 12 – Values of the iteration parameters obtained with regression in SPECS using the UNIQUAC model
System Aij Aji
Ethanol +
Water -65.3 177.1
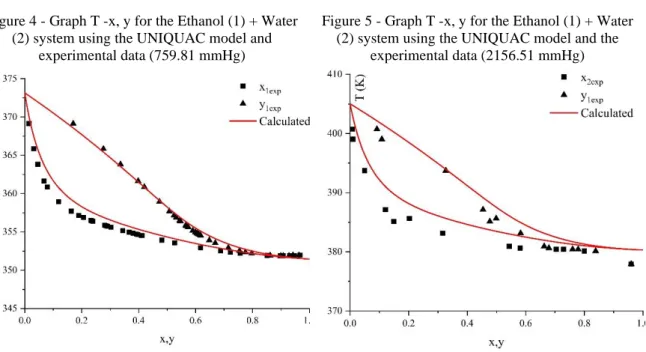
With the data in Table 13, it was possible to predict the experimental data with the UNIQUAC model. Figures 4 and 5 correspond to the graphs of T – x, y for the isobaric system. Figure 4 shows that the UNIQUAC model came close to the experimental data. This can be explained by the fact that the model uses parameters that are obtained from experimental data, better predicting the results.
Figure 5 shows that the UNIQUAC model was not like the experimental data. The difference of the calculated for the experimental can be caused because this system has higher pressure values (287511 Pa or 2156.51 mmHg) and for the Ethanol - Water mixture at the minimum increase in pressure values the system goes out of balance and starts to have only the liquid phase.
Braz. J. of Develop.,Curitiba, v. 6, n.6, p.36073-36093 jun. 2020. ISSN 2525-8761
Figure 4 - Graph T -x, y for the Ethanol (1) + Water (2) system using the UNIQUAC model and
experimental data (759.81 mmHg)
Figure 5 - Graph T -x, y for the Ethanol (1) + Water (2) system using the UNIQUAC model and the
experimental data (2156.51 mmHg)
Figures 6 and 7 correspond to the graphs of P– x,y for the Ethanol and Water system. Figure 6 shows that the UNIQUAC model had a behavior like that of experimental data. The small difference from the calculated to the experimental can be caused because the experimental data are old, and the experiment was not performed very well due to the lack of precise equipment at the time it was performed.
Figure 7 shows that the UNIQUAC model did not behave very similarly to the experimental data. The difference of the calculated for the experimental can be caused because this system has higher pressure values (2068430 - 2923380 Pa) and for the Ethanol - Water mixture at the minimum increase in pressure values, the system goes out of balance and starts to have only the phase liquid.
Braz. J. of Develop.,Curitiba, v. 6, n.6, p.36073-36093 jun. 2020. ISSN 2525-8761
Figure 6 - Graph P -x, y for the Ethanol (1) + Water (2) system using the UNIQUAC
Figure 7 - Graph P -x, y for the Ethanol (1) + Water (2) system using the UNIQUAC model and the
experimental data (473.15 K)
3.2 SYSTEM 02: METHYL ACETATE (1) + ETHANOL (2) 3.2.1 Area consistency test
The analysis was performed with eight experimental data sets, from which the relationships between the smallest area and the largest area of the x1 versus ln graph (γ1 / γ2) were obtained, that is, their respective activity coefficients. Figure 8 show the graphs with the results obtained for the isobaric and isothermal systems that presented the highest A/B ratio, highlighted in bold in Table 13.
Table 13 - Classification of experimental data of the VLE of the Methyl Acetate (1) + ethanol (2) according to the Area Test
Reference Experimental
data Points A/B Class Reference
Ortega (1990) Isobaric 26 0,71 D: They can be applied, but
with great caution. Ortega (1990)
Susial (2011)
Isobaric 01 20 0,81
C: Applicable for works where high precision is not required.
Susial (2011)
Isobaric 02 18 0,91 B: Good data, applicable for design and correlation. Isobaric 03 17 0,80 D: They can be applied, but
with great caution.
Blanco (1996)
Isobaric 01 42 0,72 D: They can be applied, but
with great caution. Blanco (1996) Isobaric 02 32 0,80 D: They can be applied, but
Braz. J. of Develop.,Curitiba, v. 6, n.6, p.36073-36093 jun. 2020. ISSN 2525-8761 Nagata (1972)
Isothermic 01 11 0,88
C: Applicable for works where high precision is not required.
Nagata (1972)
Isothermic 02 13 0,53
E: Unacceptable, it is suggested to estimate VLE in another way.
Figure 8 – Curve of analysis of experimental data of the VLE
3.2.2 Testing in the computational routine consist.exe
For the isobaric system, the result of the "Consist" routine returned an average deviation in y of 0.01504 and in pressure of 0.00959 which is equivalent to a relative deviation of 0.17. For these values, the data are considered accurate, suitable for any use. Figure 09 presents the correlation between the y obtained experimentally and calculated.
The GE parameter (excess enthalpy) is a guide in the study of the VLE of binary systems. One way to verify the behavior of this parameter is through the graph that correlates x1 versus lnγ1 and lnγ2. When GE is positive, it implies an activity coefficient higher than the unit. For a negative GE, the activity coefficient will be lower than the unit. In Figure 10 it is verified that the values of are all positive, so all activity coefficients are larger than the unit.
Braz. J. of Develop.,Curitiba, v. 6, n.6, p.36073-36093 jun. 2020. ISSN 2525-8761
Figure 09 – Correlation between Experimental Data and Routine Calculated Consist for Methyl Acetate
(1) + Ethanol (2) System at 0,3 Mpa
Figure 10 – Logarithm of Activity Coefficient for Methyl Acetate (1) + Ethanol (2) System at 0.3 Mpa
For the isothermal system, the result of the "Consist" routine returned an average deviation in y of 0.05098 and in pressure of 0.00058 which is equivalent to a relative deviation of 0.01. For these values, the data are not considered consistent. Figure 11 presents the correlation between the y obtained experimentally and calculated. Figure 12 illustrates the relationship between the composition and logarithm of activity coefficients for the system at constant temperature.
Figure 11 – Correlation between Experimental Data and Calculated Routine Consist for Methyl Acetate
(1) + Ethanol (2) at 45ºC
Figure 12 – Logarithm of the Activity Coefficient of the Methyl Acetate (1) + Ethanol (2) System at 45ºC
Braz. J. of Develop.,Curitiba, v. 6, n.6, p.36073-36093 jun. 2020. ISSN 2525-8761 3.2.3 Data regression in specs
For the isobaric system, in a set of 18 points, the mean deviation of y1 was 3.41% and P was 0.61%, with regression parameters shown in Table 14. From this it was possible to obtain the T-x1-y1 Diagram for the VLE under study (Figure 13). In it, the geometric figures are the experimental points and the curve in red was obtained from the regression. An azeotropic point with temperature below 365K can be observed, according to the literature. For the isothermal system, in a set of 11 points, the mean deviation of y1 was 0.77% and P was 0.45%, with regression parameters shown in Table 16. From this it was possible to obtain the P-x1-y1 Diagram for the VLE under study (Figure 14).
Table 14 – Regression Parameters Iteration of the Gibbs Excess Enthalpy Model (Source: SPECS)
aij[K]=a1 Inicial
Final Methyl Acetate Binary System VLE (1) +
ethanol (2) at 0,3 MPa
Final Methyl Acetate (1) + Ethanol (2) at 45ºC CH2... OH... 986.5 -413.043 -5405.3144 OH... CH2... 156.4 -9.4574 75.9457 CH2... CCOO.... 232.1 -329.089 189.1637 CCOO.... CH2... 114.8 -15.2927 157.2707 OH... CCOO.... 101.1 395.9357 82.8747 CCOO.... OH... 245.4 707.531 250.1413
Figure 13 – T-x1-y1 diagram for the VLE of the
Methyl Acetate (1) + Ethanol (2) System at 0.3 MPa
Figure 14 – P-x1-y1 Diagram for VLE of Methyl
Acetate (1) + Ethanol (2) System at 45ºC
3.2.4 Data prediction
Considering the thermodynamic consistency of the experimental data and performing the proper adjustment of the regression parameters, it was simulated in the SPECS the
Braz. J. of Develop.,Curitiba, v. 6, n.6, p.36073-36093 jun. 2020. ISSN 2525-8761 calculation of the Temperature in the VLE for pressure of 10 atm (Figure 15) and the pressure in the VLE for temperature of 400K (Figure 16), for the isobaric system. Above 500 K, the system was already in supercritical conditions, and data convergence was not possible, thus demonstrating a limitation of the chosen model.
Figure 15 – T-x1-y1 diagram for the VLE of the Methyl Acetate (1) + Ethanol (2) System at 10 atm
Figure 16 – P-x1-y1 Diagram for the VLE of the Methyl Acetate (1) + Ethanol (2) System at 400K
The mean deviations to and were plotted in the graphs of Figures 17 and 18, showing that the regression data of the experimental values for the isothermal system, whose thermodynamic consistency had not been attested.
Figure 17 - Average deviations 𝛥P for the VLE of the Methyl Acetate (1) + Ethanol System (2) at 45ºC
Figure 18 - Average deviations 𝛥y1 for VLE of Methyl Acetate (1) + Ethanol (2) System at 45ºC
Braz. J. of Develop.,Curitiba, v. 6, n.6, p.36073-36093 jun. 2020. ISSN 2525-8761 The prediction of azeotropic points is important, especially for distillation process design. Using models that can predict the behavior presented by some binary systems will contribute to the success of the sizing. The methyl acetate (1) + ethanol(2) system presents this description at a temperature of 329.79 K, x1= 0.0362, at a pressure of 101.33 kPa, of the OX type "homogeneous pressure-maximum azeotrope in a completely miscible system". (GMEHLING et al., 2005). Only for the isobaric system there was detection of the azeotropic point in regression and data prediction.
The equilibrium curves (x1 versus y1) for the systems studied considering experimental data, the one estimated through the Consist routine and obtained by data regression in Specs were elaborated and presented in Figure 20, for the isobaric system, and in Figure 19, for the isothermal system. It is verified that there is an azeotropic point of this binary system and that it can be detected in the predictions performed for the VLE at 0.3 Mpa, both for high temperature and high pressure. However, for the system at 45ºC, whose thermodynamic consistency was not detected. This may be related to the fact that the experiments were carried out at low pressures, so that using them for prediction in critical conditions becomes infeasible.
Figure 19 – Balance curve x1-y1 for VLE of Methyl Acetate (1) + Ethanol (2) System at 0.3 Mpa
Figure 20 - Balance curve x1-y1 for VLE of Methyl Acetate (1) + Ethanol (2) System at 45ºC
4 CONCLUSIONS
The importance of applying data with thermodynamic consistency was proved through the study carried out from the VLE Vapor-Liquid Equilibrium experiments of the Binary System methyl-acetate (1) + ethanol (2). The area test is a simpler test, already providing an
Braz. J. of Develop.,Curitiba, v. 6, n.6, p.36073-36093 jun. 2020. ISSN 2525-8761 indication of the possible use of this data in projects and other applications. In the data sets in which this test was used, only one of them presented unacceptable data and only one was indicated for use in projects.
From the data with the best consistency detected by the area test, the verification in the computational routine consit.exe, the regression in Specs, and a simulation and data was performed. The data for isobaric systems were pointed out with thermodynamic consistency, whereas the isotherm did not have the same classification. It is possible to predict values at high pressure for the isobaric system. In addition, it was possible to check the azeotropic points provided for that binary system.
REFERENCES
ALVAREZ, V. H.; MATTEDI, S.; IGLESIAS, M.; GONZALEZ-OLMOS, R.; RESA, J. M. Phase equilibria of binary mixtures containing methyl acetate, water, methanol or ethanol at 101.3 kPa. Phys. Chem. Liq., 49, 52-71, 2011.
BLANCO, A. M.; ORTEGA, J. Isobaric Vapor− Liquid Equilibria of Methanol + Methyl Ethanoate + Methyl Propanoate, and+ Methyl Butanoate at 141.3 kPa. Journal of Chemical & Engineering Data, v. 41, n. 3, p. 566-570, 1996.
CRISTINO, A. F.; ROSA, S.; MORGADO, P.; GALINDO, A.; FILIPE, E. J. M.; PALAVRA, A. M. F.; NIETO DE CASTRO, C. A. High-temperature vapour–liquid equilibrium for the water–alcohol systems and modeling with SAFT-VR: 1. Water–ethanol. Fluid Phase Equilib., 2013, 341, 48-53.
GMEHLING, J. et al. Azeotropic data for binary mixtures. CRC Handbook of Chemistry and Physics, v. 86, 2005.
GRISWOLD, J.; HANEY, J. D.; KLEIN, V. A. Ethanol-Water System. Vapor-Liquid Properties at High Pressures. Ind. Eng. Chem., v. 35, p. 701, 1943.
NAGATA, I.; OHTA, T.; TAKAHASHI, T. Excess thermodynamic functions of methyl acetate-methanol and methyl acetate-ethanol systems. Journal of Chemical Engineering of Japan, v. 5, n. 3, p. 227-231, 197
2.
ORTEGA, J.; SUSIAL, P.. VLE at 114.66 and 127.99 kPa for the systems methyl acetate+ ethanol and methyl acetate+ propan-1-ol. Measurements and prediction. Journal of Chemical Engineering of Japan, v. 23, n. 5, p. 621-626, 1990.
OTHMER, D. F.; MOELLER, W. P.; ENGLUND, S. W.; CHRISTOPHER, R. G. Composition of vapors from boiling binary solutions recirculation-type still and equilibria under pressure for ethyl alcohol - water system. Ind. Eng. Chem., v. 43, p. 707-11, 1951.
Braz. J. of Develop.,Curitiba, v. 6, n.6, p.36073-36093 jun. 2020. ISSN 2525-8761 SMITH, B. D. et al. Evaluation of Binary PTxy Vapor–Liquid Equilibrium Data for C 6 Hydrocarbons. Benzene+Cyclohexane. Journal of Physical and Chemical Reference Data, v. 11, n. 4, p. 1099–1126, out. 1982.
SOFTWARE CONSIST, IVC-SEP – Phase Equilibria and Separation Processes (MAN 8111), MANUAL FOR CONSIST: PROGRAM FOR CONSISTENCY TESTING OF BINARY VLE-DATA, 1981.
SOFTWARE SPECS (program for phase equilibrium calculations; it has been developed in the Center for Phase Equilibria and Separation Processes (IVC-SEP), Department of Chemical Engineering, Technical University of Denmark). Manual de utilização versão 5.63, 2010.
SUSIAL, P.; RIOS-SANTANA, R.; SOSA-ROSARIO, A. Vapor-liquid equilibrium measurements for the binary system methyl acetate+ ethanol at 0.3 and 0.7 MPa. Brazilian Journal of Chemical Engineering, v. 28, n. 2, p. 325-332, 2011.