ISSN 0104-6632 Printed in Brazil
www.abeq.org.br/bjche
Vol. 30, No. 01, pp. 33 - 43, January - March, 2013
Brazilian Journal
of Chemical
Engineering
SOLID-LIQUID EQUILIBRIUM OF TRIOLEIN
WITH FATTY ALCOHOLS
G. J. Maximo
1, M. C. Costa
2and A. J. A. Meirelles
1*1
Laboratory of Extraction, Applied Thermodynamics and Equilibrium, Department of Food Engineering, School of Food Engineering, Phone: + (55) (19) 3521 4037, Fax: + (55) (19) 3521 4027,
University of Campinas, Av. Monteiro Lobato 80, 13083-862, Campinas - SP, Brazil. E-mail: [email protected]
2
School of Applied Sciences, University of Campinas, R. Pedro Zaccaria 1300, 13484-350, Limeira - SP, Brazil.
(Submitted: January 31, 2012 ; Revised: June 4, 2012 ; Accepted: June 13, 2012)
Abstract - Triacylglycerols and fatty alcohols are used in the formulation of cosmetic, pharmaceutical and food products. Although information about the phase transitions of these compounds and their mixtures is frequently required for design and optimization of processes and product formulation involving these substances, these data are still scarce in the literature. In the present study, the solid-liquid phase diagrams of two binary systems composed of triolein + 1-hexadecanol and triolein + 1-octadecanol were evaluated by differential scanning calorimetry (DSC) and optical microscopy. The experimental data were compared with predicted data by solving the phase equilibrium equations using an algorithm implemented in MATLAB. The liquid-phase activity coefficients were calculated using the Margules equation (two- and three-suffix) and the UNIFAC model (original and modified Dortmund model). The approaches used for calculating system equilibrium allowed an accurate prediction of the liquidus line with low deviations from the experimental data.
Keywords: Triolein; Fatty alcohol; Solid-liquid equilibrium; Differential scanning calorimetry; Modeling;
UNIFAC.
INTRODUCTION
Fats and oils are multicomponent systems composed of a mixture of triacylglycerols (TAGs) and minor components, such as free fatty acids and nutraceuticals. Under thermal treatment, triacylglycerols are responsible for the formation of a crystalline network and, consequently, particular microstructures that influence the sensorial, rheological and thermodynamic profiles of food and chemical products (Bruin, 1999; O’Brien, 2004). Within the food and chemical industry, there is a clear trend towards the development of new ways of structuring these systems, such as the utilization of surfactants and co-surfactants. In particular, fatty alcohols have been evaluated as gelling and surfactant agents in food, chemical and pharmaceutical oil-based
products (Egan et al., 1984; Kreutzer, 1984; Daniel and Rajasekharan, 2003). Therefore, the study of the phase equilibrium of these compounds is a powerful tool for process and product design.
34 G. J. Maximo, M. C. Costaand A. J. A. Meirelles
procedure can be found in the literature; the majority is based on evaluation of the activity coefficients of the compounds in the equilibrium phases (Wesdorp, 1990; Slaugther and Doherty, 1995; Coutinho et al., 1998). The activity coefficients in the solid-liquid equilibrium can be estimated with adjustable models such as the Margules equation or with predictive methods such as the group-contribution UNIFAC model (Fredenslund et al., 1975; Gmehling et al., 1978; Chiavone Filho and Rasmunsen, 2000; Coutinho et al., 2001), both based on the calculation of excess Gibbs free energy.
Binary solid-liquid equilibrium data on systems composed of mixtures of triacylglycerols, mixtures of fatty alcohols or mixtures of these components with other fatty compounds are available in the literature, but data on systems composed of triacylglycerols + fatty alcohols are still scarce. In the present work, solid-liquid equilibrium data on two fatty mixtures, triolein + 1-octadecanol and triolein + 1-hexadecanol, were measured by differential scanning calorimetry (DSC), evaluated with optical microscopy and modeled by resolution of the thermodynamic equilibrium equations using the two- and three-suffix Margules equations, the original UNIFAC (Fredenslund et al., 1975) and the modified UNIFAC-Dortmund model (Gmehling et al., 1993) for calculation of the liquid-phase activity coefficient. An optimization algorithm was implemented in MATLAB for prediction of the melting point.
Thermodynamic Framework
The solid-liquid equilibrium of each component in a binary or two-phase system is represented by Equation (1), as discussed by Prausnitz et al. (1986).
L L
i i if S S
if i i
1 1
exp
x h
R T T
x
⎡ ⎛ ⎞⎤
γ = Δ −
⎢ ⎜ ⎟⎥
γ ⎢⎣ ⎝ ⎠⎥⎦ (1)
where xiL and xSi are the mole fractions of component i in the liquid (L) and solid (S) phases,
L i
γ and γSi are the activity coefficients of component i in the same phases, Δhif is the enthalpy, Tif is the melting temperature of pure component i and T is the temperature of the system. The Margules equation and the group-contribution UNIFAC model are often used for calculation of γi Using the two-suffix Margules equation for a binary mixture, the γ of component 1 is given by Equations (2) and (3). Using the three-suffix Margules equation, the γ of
the components in a binary mixture are calculated using Equations (4) and (5) (Reid et al., 1987).
2 1 2
R lnT γ =Ax (2)
2 2 1
R lnT γ =Ax (3)
2 3
1 2 2
R lnT γ =(A+3 )B x −4Ax (4)
2 3
2 1 1
R lnT γ =(A−3 )B x +4Ax (5)
where Aand B are adjustable parameters and R is the ideal-gas constant (8.314 J⋅mol-1⋅K-1). According to the UNIFAC model (Equations (6) to (17)) (Fredenslund et al., 1975), the activity coefficient can be written as the sum of a combinatorial contribution γCi , which accounts for the effects of
size and shape, and a residual contribution γiR, which accounts for interactions among groups.
C R i i i
lnγ = γ + γln ln (6)
i i i
i i i
C
i i i j j j
lnγ =lnφx +5 lnq θφ + − ∑l φx x l (7)
(i) (i) R
i k k k k
lnγ = ∑ ν (lnΓ + Γln ) (8)
i 5(i i) (i 1)
l = r −q − r − (9)
i i i
j j j
r x x r
φ =
∑ (10)
i i i
j j j
q x x q
θ =
∑ (11)
(i) i k k k
r = ∑ ν R (12)
(i) i k k k
q = ∑ ν Q (13)
m km
n nm
k k m m mk m n
lnΓ =Q ⎡⎣1 ln(− ∑ Θ ψ )− ∑ ∑ Θ ψΘ ψ ⎤⎦ (14)
m m m
n n n
Q X Q X
Θ =
∑ (15)
( j) j m j m ( j) j n n j
x X
x
∑ ν =
Solid-Liquid Equilibrium of Triolein with Fatty Alcohols 35
nm nm exp
a T
⎛ ⎞
ψ = ⎜− ⎟
⎝ ⎠ (17)
where φi is the volume fraction of molecule i, θi is the area fraction of molecule i, ri is the molecular volume parameter, qi is the surface area parameter,
i k
ν is the number of k-type groups in molecule i, Γk is the activity coefficient of group k in the mixture composition, Γ(i)k is the activity coefficient of group k for a group composition corresponding to pure component i, Θi is the surface area fraction of component i in the mixture, Xm is the group mole fraction of group m, ψnm is the Boltzmann factor, Rk and Qk are the structural parameters for the groups and anm is the temperature-dependent group-interaction parameter (Reid et al., 1987). T is the temperature (K). In this work, in addition to the original UNIFAC model, the modified UNIFAC-Dortmund model (Gmehling et al., 1993) was also used. In this model, the combinatorial term γCi (Equation (18)) was empirically changed to make it possible to deal with compounds that are very different in size. Also, the Boltzmann factor ψnm (Equation (20)) of the residual term is temperature-dependent, with three new group-interaction parameters, anm, bnm and cnm.
C i i i i
i i
i i i i
ln 1 ln 5q 1 ln
x x
′ ′ ⎛ ⎞
φ φ φ φ
γ = − + − ⎜ − + ⎟
θ θ
⎝ ⎠ (18)
3/4 i i i 3/4
j j j
x r
x r
′ φ =
∑ (19)
2 nm nm nm nm exp
a b T c T T
⎛ + + ⎞
ψ = ⎜⎜− ⎟⎟
⎝ ⎠ (20)
For systems that show only a eutectic transition and whose components are immiscible in the solid phase, it is possible to assume that the solid phase is composed of a pure component, so Equation (21) becomes valid.
S S i i 1
x γ = (21)
With these considerations, a system of equations can be constructed for prediction of the melting point using: i) the equation expressing the equilibrium condition for each component (Equation (1)), ii) a
model for calculation of the activity coefficients of the liquid phase (Equations (2) to (20)) and iii) the global molar balance of the system.
MATERIALS AND METHODS
Triolein (C57H104O6), 1-octadecanol (C18H38O) and 1-hexadecanol (C16H34O) with purity greater than 99% by mass were supplied by Sigma-Aldrich (USA). Samples (1 g) of triolein + 1-octadecanol and triolein + 1-hexadecanol were prepared gravimetri-cally in amber flasks using an analytical balance (Precisa Gravimetrics AG, Dietkon) with a precision of 2×10⁻⁴ g and a mole fraction of component 1 from 0.0 to 1.0. The samples were pretreated on Thermoprep (Metrohm, Herisau) by heating in a nitrogen atmosphere to 15 K above the highest melting point of the components. The mixtures were then allowed to cool to room temperature and kept in a freezer at 273.15 K until DSC analysis.
Differential Scanning Calorimetry (DSC)
36 G. J. Maximo, M. C. Costaand A. J. A. Meirelles
and the enthalpies were calculated from the area of the corresponding peaks.
Optical Microscopy
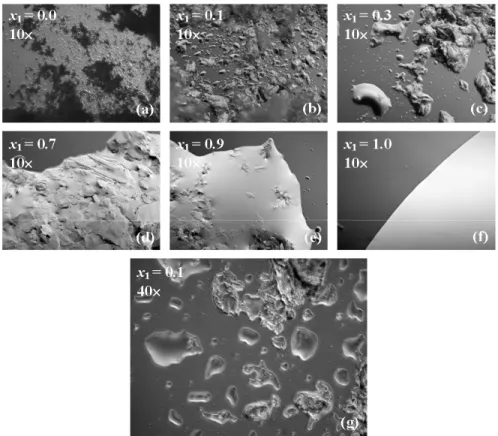
In order to evaluate the behavior of the solid:liquid fraction of the systems as a function of the concentration of the components, as well as the assumption of solid phase immiscibility, both systems were analyzed at 298.15 K by optical microscopy using a Carl Zeiss model Scope A1 microscope (Zeiss, Germany). Samples of each mixture of both systems were heated from storage temperature (above 273.15 K) to 298.15 K on a Thermoprep (Metrohm, Herisau). The images obtained were taken with magnifications of 10× and 40×.
Modeling Procedure
SLE modeling was carried out according to the previous thermodynamic approach. The binary parameters A and B of the Margules equations were numerically adjusted by an algorithm implemented in MATLAB 7.0, and based on the calculation of the melting temperatures by Equation (1), rewritten as a function of T, and by Equations (2) to (5) as the γiL model. The one-variable optimization problem (using the two-suffix Margules equation) was implemented using a parabolic interpolation method (MATLAB function fminbnd). The two-variable optimization problem (using the three-suffix Margules equation) was carried out using a sequential quadratic programming method (MATLAB function fmincon). In both cases, the objective function was the root mean square deviation (RMSD) (Equation (22)) between the experimental temperature (Texp) and the calculated one (Tcalc).
n 2
i 1 exp calc i
2 ( )
RMSD
n
T T
=
∑ −
= (22)
In the case of the UNIFAC or the UNIFAC-Dortmund model for calculation of γiL, equilibrium Equation (1) cannot be rewritten as a function of T, and thus an optimization algorithm was implemented in MATLAB 7.0 using sequential quadratic programming (MATLAB function fmincon) for the calculation of the melting temperature of the mixtures. In this case, the objective function was the square of the absolute deviation between the experimental temperature (Texp) and the calculated one (Tcalc) (Equations (23) and (24)) for a composition
L i
x . The routine was repeated for 0 < xiL < 1 and the first iteration started with a melting temperature sufficiently close to that of the optimal solution, taken as the melting point of pure component 1 or 2.
2 obj exp calc i
F =(T −T ) (23)
if if calc L L
if R if ln i i
h T T
h T x
Δ =
Δ − γ (24)
For modeling, the pure component properties (temperature and enthalpy of fusion) were taken from the experimental data in this work. Also, data from the literature (Wesdorp, 1990; Ventolà et al., 2004; Nichols et al., 2006) was used for evaluation of the significance of these properties for modeling accuracy. Accounting for the immiscibility in the solid phase, the procedure described above was applied along the entire composition range for calculating the mixtures’ melting points, assuming that either the light or the heavy component represents the pure solid phase. Therefore, two temperatures were obtained, with the equilibrium temperature (liquidus line) being the higher. This is the usual procedure for estimating equilibrium temperatures in a simple eutectic mixture, so the left-hand curve corresponds to a solid phase composed of the pure heavy component and the right-hand curve to a solid phase of the pure light component and the predicted eutectic mixture occurs exactly at their intersection.
RESULTS AND DISCUSSION
Performance of the Algorithm
Solid-Liquid Equilibrium of Triolein with Fatty Alcohols 37
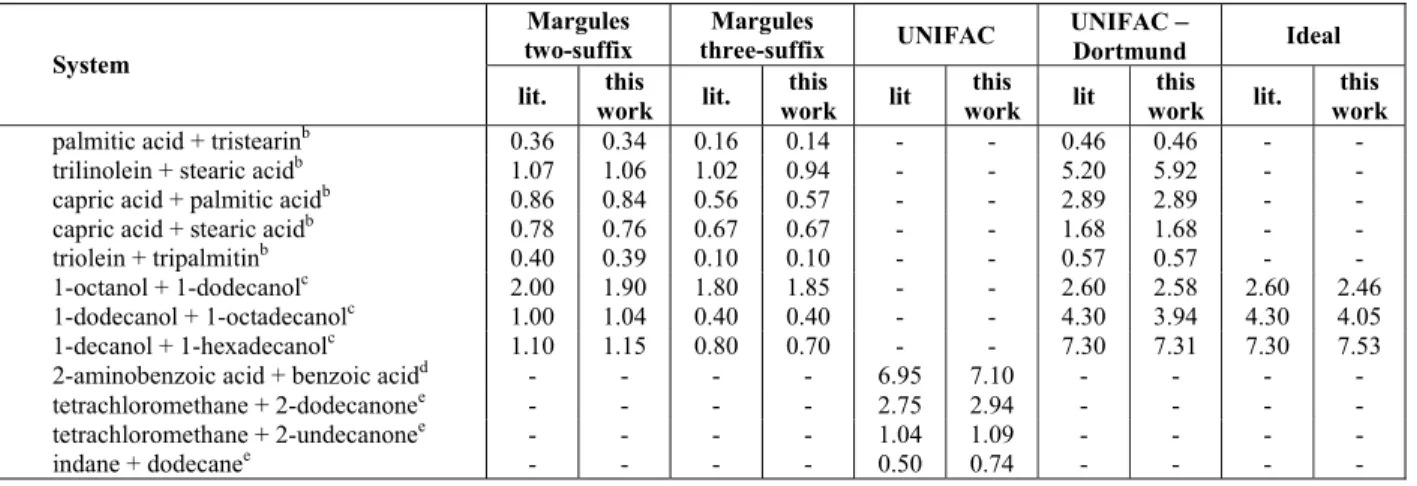
Table 1: Deviationa data from the literature (lit.) and from the algorithm proposed in this work
Margules two-suffix
Margules
three-suffix UNIFAC
UNIFAC −
Dortmund Ideal System
lit. this work lit.
this work lit
this work lit
this work lit.
this work
palmitic acid + tristearinb 0.36 0.34 0.16 0.14 - - 0.46 0.46 - -
trilinolein + stearic acidb 1.07 1.06 1.02 0.94 - - 5.20 5.92 - -
capric acid + palmitic acidb 0.86 0.84 0.56 0.57 - - 2.89 2.89 - -
capric acid + stearic acidb 0.78 0.76 0.67 0.67 - - 1.68 1.68 - -
triolein + tripalmitinb 0.40 0.39 0.10 0.10 - - 0.57 0.57 - -
1-octanol + 1-dodecanolc 2.00 1.90 1.80 1.85 - - 2.60 2.58 2.60 2.46
1-dodecanol + 1-octadecanolc 1.00 1.04 0.40 0.40 - - 4.30 3.94 4.30 4.05
1-decanol + 1-hexadecanolc 1.10 1.15 0.80 0.70 - - 7.30 7.31 7.30 7.53
2-aminobenzoic acid + benzoic acidd - - - - 6.95 7.10 - - - -
tetrachloromethane + 2-dodecanonee - - - - 2.75 2.94 - - - -
tetrachloromethane + 2-undecanonee - - - - 1.04 1.09 - - - -
indane + dodecanee - - - - 0.50 0.74 - - - -
a
RMSD (Equation (22)) data from b
Boros (2005), c
Carareto et al. (2011), d
Huang and Chen (2000) and average of the absolute deviations
n
i Tcalc Texp i n ∑ − from e
Jakob et al. (1995).
0 1 2 3 4 5 6 7 8
0 1 2 3 4 5 6 7 8
D
ev
iat
io
n f
rom
t
h
is
w
o
rk
Deviation from literature
Figure 1: Deviation (this work) versus deviation from the literature (data from Table 2): (○) Carareto et al., (2011), (×) Boros (2005), (+) Huang and Chen (2000) and (Δ) Jakob et al. (1995). Dashed line represents the straight diagonal line and the continuous line is the curve fitted with the data (y = 1.0123x – 0.017, r2 = 0.9966). Number of observations = 31.
Experimental and Predicted Solid-Liquid Equilibrium Data
The reproducibility of the data was checked by performing three repeat runs for the calibration standard (indium) and for the pure components (triolein, 1-hexadecanol and 1-octadecanol). The standard deviation of the melting point data obtained was 0.13 K. This deviation was assumed to be the uncertainty of all of the melting points measured in this work. Also, these experimental data were
38 G. J. Maximo, M. C. Costaand A. J. A. Meirelles
lit work i i n
i lit i
100 1 ARD (%)
n
T T
T
⎛ − ⎞
⎜ ⎟
= ∑⎜ ⎟
⎝ ⎠
(25)
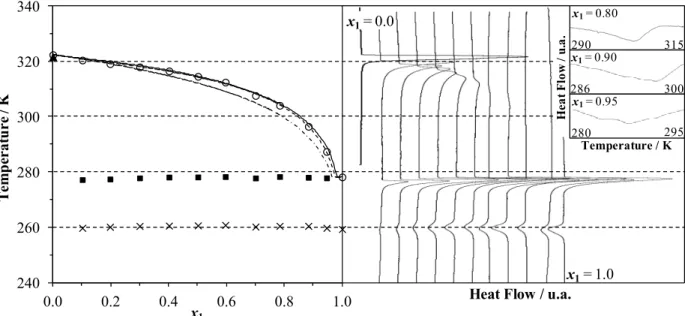
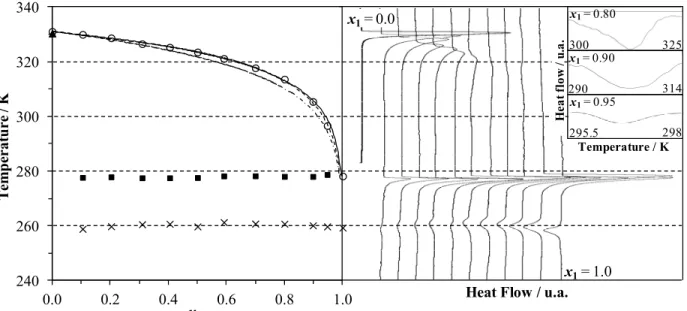
The thermograms obtained with DSC runs and the phase diagrams of the two binary systems evaluated, (1) triolein + (2) 1-hexadecanol and (1) triolein + (2) 1-octadecanol, are presented in Figures 2 and 3. Figures 2 and 3 also show results for modeling with the ideal assumption, using the adjustable three-suffix Margules equation and the predictive UNIFAC-Dortmund model for γLi calcu-lation. In addition, the experimental data related to the thermogram analysis are presented in Tables 2 and 3.
For pure 1-hexadecanol and 1-octadecanol two overlapping peaks could be seen in the region very close to the melting temperature, as observed by other authors (Ventolà et al., 2004; Carareto et al., 2011). In fact, fatty alcohols have rotator forms during crystallization processes (TFArotator form, Tables 2 and 3) that are structurally different but with very similar thermodynamic properties (Ventolà et al., 2004). Despite the fact that the melting temperatures of these rotator forms could easily be found on the thermograms, the proximity of their values makes determination of the enthalpy of each of these pure component forms difficult.
For pure triolein two well-defined peaks and a
third mild peak at a lower temperature were observed. In fact, TAGs usually have three polymor-phic forms, known as alpha, beta-prime and beta, with differences in the crystal lattice packing, temperatures and heats of fusion (Wesdorp, 1990; Rolemberg, 2002; Costa, 2008). According to Fergusson and Lutton (1947), triolein also has these three polymorphic forms, melting at 241.15 K, 260.15 K and 278.65 K, respectively, and these values are very similar to the temperatures found in this work (Tables 2 and 3).
The thermograms of the mixtures of triolein and 1-hexadecanol or 1-octadecanol clearly showed three well-defined peaks, which were also observed by other authors for fatty mixtures with triacylglycerols (Costa et al., 2010a, 2010b, 2011). The thermal transition at the highest temperature is related to the solid-liquid equilibrium temperature of the mixture. The transition at the lowest temperature is close to the solid-solid transition of the triolein beta-prime polymorphic form, and thus is probably related to this transition. The last one (Ttrans, Tables 2 and 3) is a transition temperature close to the triolein melting point, which will be discussed below. The transition related to the alpha polymorphic form of triolein, the polymorphic form with the lowest transition temperature, was not well identified in the thermo-grams of the mixtures and is not shown in Figures 2 and 3.
240 260 280 300 320 340
0.0 0.2 0.4 0.6 0.8 1.0
T
em
p
er
a
tu
re /
K
x1
x1= 0.0
x1= 1.0
Heat Flow / u.a.
x1= 0.80
x1= 0.90
x1= 0.95
Temperature / K
280 295
286 300
290 315
H
e
a
t F
low
/
u
.a.
Solid-Liquid Equilibrium of Triolein with Fatty Alcohols 39
240 260 280 300 320 340
0.0 0.2 0.4 0.6 0.8 1.0
Te
m
p
er
a
tu
re
/
K
x1
x1= 0.0
x1= 1.0
Heat Flow / u.a.
x1= 0.80
x1= 0.90
x1= 0.95
Temperature / K
295.5 298
290 314
300 325
H
e
at
f
low
/
u
.a.
Figure 3: Solid-liquid phase diagram (temperature in Kelvin and mole fraction) and thermograms for the triolein (1) + 1-octadecanol (2) system. Symbols for phase diagrams: (○) experimental melting point, (■) transition near triolein melting point, (×) solid-solid triolein beta-prime transition and data modeled by (- - -) the three-suffix Margules equation (—), the UNIFAC-Dortmund model and (- ⋅ -) the ideal assumption. In detail, magnification of the thermograms close to the melting temperature for x1 > 0.7.
Table 2: Experimental solid-liquid equilibrium data (K) for triolein (1) + 1-hexadecanol (2). (Experimental error = ± 0.13 K)
xtriolein Tfusion TFArotator form Ttrans Tβ’melting
0.0000 322.34 321.62
0.1018 320.40 277.18 259.74
0.1975 319.07 277.41 260.12
0.3000 317.92 277.80 260.44
0.4017 316.48 278.10 260.56
0.5014 314.51 278.15 260.62
0.5963 312.42 278.28 260.78
0.7006 307.58 277.78 260.20
0.7840 304.03 278.29 260.47
0.8833 296.43 278.00 260.47
0.9463 287.33 277.82 259.74
1.0000 278.16 259.31
Table 3: Experimental solid-liquid equilibrium data (K) for triolein (1) + 1-octadecanol (2). (Experimental error = ± 0.13 K)
xtriolein Tfusion TFA rotator form Ttrans Tβ’melting
0.0000 331.04 330.35
0.1048 329.93 277.65 258.87
0.2030 328.66 277.87 259.80
0.3097 326.50 277.51 260.53
0.4046 325.23 277.52 260.69
0.5004 323.49 277.61 259.73
0.5910 321.13 278.19 261.29
0.6993 317.70 278.24 260.77
0.7996 313.58 278.03 260.72
0.8975 305.38 278.00 260.13
0.9467 296.60 278.72 259.74
40 G. J. Maximo, M. C. Costaand A. J. A. Meirelles
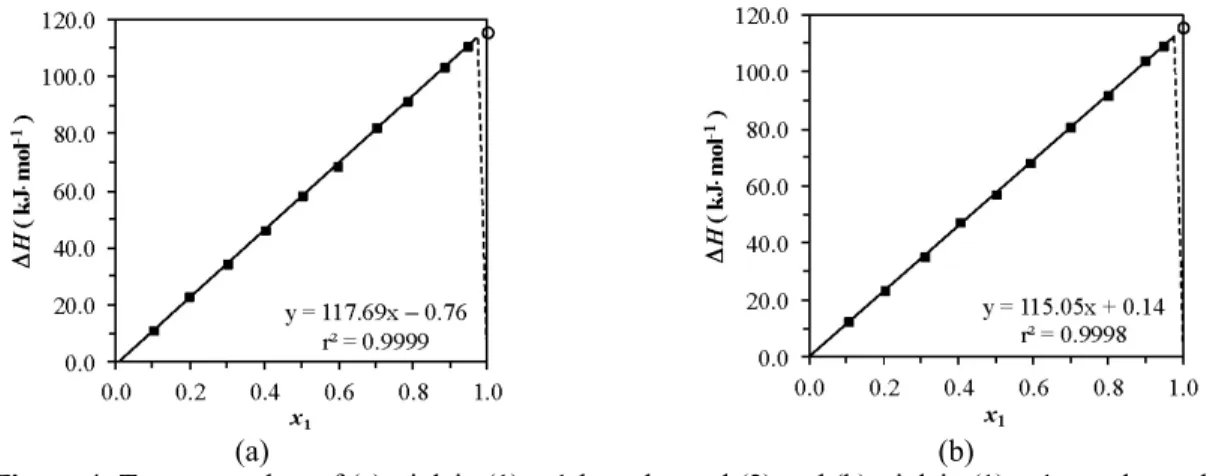
Figure 4 contains the Tammann plots of the mixtures, showing the enthalpy variation of the observed invariant transitions as a function of triolein molar concentration. In general, the polymorphic transitions and the eutectic reaction, which separates the solid-liquid region from the solid-solid, are the most common invariant thermal events of mixtures of triacylglycerols and fatty compounds. The Tammann plot allows a better determination of the eutectic point, since enthalpy increases as the mixture concentration approximates the eutectic composition, where the enthalpy should begin to decrease. In several cases, the increase in the difference between melting temperatures of pure components increases the proximity of the eutectic point to the melting temperature of the pure lighter component (Levine, 2002). The linear regression (with r2 > 0.99) of the Tammann curves for the transition close to the triolein melting point (Figure 4) shows that, for x = 1, the enthalpy variation is very close to the corresponding value for pure triolein. This means that this invariant thermal event may correspond to a eutectic reaction with a composition very close to that of pure triolein, making it virtually impossible to differentiate the
eutectic composition from pure triolein. In agreement with this observation, triolein + 1-octadecanol and triolein + 1-hexadecanol modeled phase diagrams had eutectic points higher than 0.99 and 0.98 triolein mole fraction, respectively, for all γiLmodels.
The binary parameters (J⋅mol-1) for both Margules equations and the deviations between calculated and experimental data for each modeling approach are shown in Table 4. It can easily be observed that the
liquidus line was well described by all models, since the average absolute deviation was always less than 0.7 K. The Margules parameter values obtained were very similar to those found in the literature for binary fatty mixtures with TAGs and for systems with fatty alcohols (Costa et al., 2010a, 2011; Carareto et al., 2011). The ideal assumption shows the highest deviations, indicating that the systems of triolein + 1-hexadecanol and triolein + 1-octadecanol are slightly nonideal. In fact, the activity coefficients calculated by all the models were higher than 1 for both systems and the highest values were obtained for the most accurate model, the three-suffix Margules equation. In this case the values were close to 2 when xiL was close to 0.
(a) (b) Figure 4: Tammann plots of (a) triolein (1) + 1-hexadecanol (2) and (b) triolein (1) + 1-octadecanol
(2). (—) Linear regression for data on (■) transition close to the triolein melting point, (○) pure triolein transition and (- - -) hypothetical plot with a eutectic point.
Table 4: Adjusted parameters (A and B) and mean absolute deviationsa σ of the predicted data from
the experimental data (in Kelvin).
Model triolein +1-hexadecanol triolein +1-octadecanol Average
A 1065.77 855.15
Two-suffix Margules σ
0.53 0.60 0.56
A 1186.79 1026.36
B −396.02 −507.89
Three-suffix Margules
σ 0.32 0.34 0.33
UNIFAC σ 0.45 0.42 0.43
UNIFAC−Dortmund σ 0.68 0.47 0.57
Ideal σ 2.31 1.78 2.04
a n exp pred i i i
n T T
∑ −
Solid-Liquid Equilibrium of Triolein with Fatty Alcohols 41
Solid phase immiscibility is usually assumed for the purpose of modeling fatty systems (Wesdorp, 1990; Rolemberg, 2002; Costa et al., 2007). Nevertheless, several fatty mixtures have regions of solid solution close to the pure component composition on the phase diagram (Costa et al., 2009, 2011; Carareto
et al., 2011). In order to check the immiscibility assumption and thus comprehend the behavior of the solid:liquid fraction in the solid-liquid biphasic region (under the liquidus line), optical micrographs of both systems were taken at 298.15 K. Some of the images of the binary mixture of triolein (1) + 1-octadecanol (2) are shown in Figure 5. Firstly, it was clearly observed that increasing the concentration of triolein decreased the solid fraction, in agreement with the lever rule (Figures 5(a) to 5(f)). Since the melting points of the pure saturated fatty alcohols 1-hexadecanol and 1-octadecanol are higher than that of triolein, in this region of the phase diagram the solid fraction of the system is probably composed only of pure fatty alcohol. Secondly, the micrograph of the system with a triolein mole fraction of 0.1 at a magnification of 40× (Figure 5(g)) clearly shows that there is a liquid fraction even at this relatively low concentration. Thus, there is probably no solid solution at the concentration close to the pure heavy
component (x1 = 0.0). Tammann plots of both systems also corroborate this probability, since enthalpy values tend to zero at x1 = 0.0. Both observations validate our modeling approach.
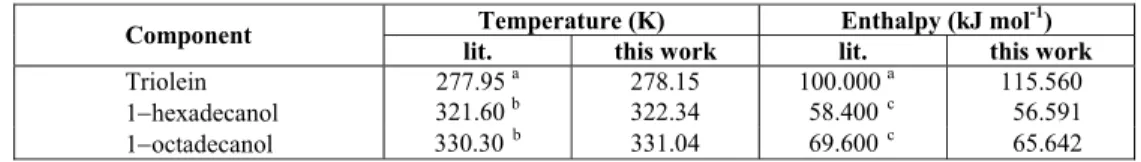
Finally, the influence of pure component properties on the accuracy of the modeling approach was investigated. Component properties taken from the literature (Wesdorp, 1990; Ventolà et al., 2004; Nichols et al., 2006) as well as the values obtained in this work are presented in Table 5. The values from the literature were also used with the modeling procedure presented above. In the case of the pure component properties taken from the literature, the global average absolute deviation between the calculated and the experimental results, including the ideal solution assumption, was 0.90 K, while for the pure component properties obtained in this work the deviation was 0.79 K. Firstly, the differences in the pure compounds’ experimental values observed in Table 5 can probably be attributed to differences between the experimental method used in the literature and in this work (different heating and cooling rates and isothermal conditions). In addition, the effects of polymorphism could produce peaks that overlap or are too close, which disrupts the determination of enthalpy, especially for fatty alcohols, as discussed previously.
42 G. J. Maximo, M. C. Costaand A. J. A. Meirelles
Table 5: Pure fatty components properties from the literature (lit.) and in this work.
Temperature (K) Enthalpy (kJ mol-1) Component
lit. this work lit. this work
Triolein 277.95 a 278.15 100.000 a 115.560
1−hexadecanol 321.60 b 322.34 58.400 c 56.591
1−octadecanol 330.30 b 331.04 69.600 c 65.642
a
Wesdorp (1990), b
Ventolà et al. (2004), c
Nichols et al. (2006).
In case of the interactions parameters and the corresponding liquid phase activity coefficients obtained by using literature’s pure compounds properties, an increasing of the positive deviations was observed with values slightly higher than 2 when xiL
was close to 0 for three-suffix Margules equation, also the most accurate model in this case. In fact, these results were very close to the γLi values observed in this work, as previously discussed. Nonetheless, this discussion highlights the fact that pure component properties are very important for a reliable modeling approach, being very significant for the solid-liquid equilibrium calculation.
CONCLUSIONS
In the present work the solid-liquid phase diagrams for the binary mixtures of triolein + 1-hexadecanol and triolein + 1-octadecanol were measured using differential scanning calorimetry. Both diagrams exhibited three well-defined transitions: the mixture melting temperature, the solid-liquid transition related to the melting of triolein or of a triolein-rich eutectic mixture and a solid-solid transition related to the triolein beta-prime polymorph. The two- and three-suffix Margules equations and the group-contribution UNIFAC and UNIFAC-Dortmund models were accurate for estimating the activity coefficients of the liquid phase and provided a melting point of the fatty mixtures evaluated with a global mean absolute deviation of 0.47 K. Micro-graphs showed that the assumption of solid phase immiscibility was valid for the systems investigated. The present work also showed that pure component properties are very important for developing a reliable modeling approach.
ACKNOWLEDGMENTS
The authors are grateful to FAPESP (2008/56258-8 and 2009/54137-1) and CNPq (304495/2010-7, 480992/20009-6 and 140718/2010-9) for the financial support.
REFERENCES
Boros, L. A. D., Modelagem matemática e termodinâmica do equilíbrio sólido-líquido de sistemas graxos. M.Sc. Thesis, University of Campinas (2005). (In Portuguese).
Bruin, S., Phase equilibria for food products and process design. Fluid Phase Equilibria, 158, 657 (1999).
Carareto, N. D. D., Costa, M. C., Rolemberg, M. P., Krähenbühl, M. A. and Meirelles, A. J. A., The solid-liquid phase diagrams of binary mixtures of even saturated fatty alcohols. Fluid Phase Equilibria, 303, n. 2, 191 (2011).
Chiavone Filho, O. and Rasmussen, P., Modeling of salt solubilities in mixed solvents. Brazilian Journal of Chemical Engineering, 17, n. 2, 117 (2000). Costa, M. C., Determinação experimental do equilíbrio-
sólido líquido de sistemas binários de ácidos graxos saturados: Estudo detalhado da fase sólida. Ph.D. Thesis, University of Campinas (2008). (In Portuguese).
Costa, M. C., Rolemberg, M. P., Boros, L. A. D., Krähenbühl, M. A., Oliveira M. G. and Meirelles A. J. A., Solid-liquid equilibrium of binary fatty acid mixtures. Journal of Chemical and Engineering Data, 52, n. 1, 30 (2007).
Costa, M. C., Sardo, M., Rolemberg, M. P., Coutinho, J. A. P., Meirelles, A. J. A., Ribeiro-Claro, P. and Krähenbühl, M. A., The solid–liquid phase diagrams of binary mixtures of consecutive, even saturated fatty acids. Chemistry and Physics of Lipids, 160, n. 2, 85 (2009).
Costa, M. C., Boros, L. A. D, Rolemberg, M. P., Krähenbühl, M. A. and Meirelles, A. J. A., Solid-liquid equilibrium of saturated fatty acids + triacylglycerols. Journal of Chemical & Engineer-ing Data, 55, n. 2, 974 (2010a).
Costa, M. C., Rolemberg, M. P., dos Santos, A. O., Cardoso, L. P., Krähenbühl, M. A. and Meirelles, A. J. A., Solid-liquid equilibrium of tristearin with refined rice bran and palm oils. Journal of Chemical & Engineering Data, 55, No. 11, 5078 (2010b).
Solid-Liquid Equilibrium of Triolein with Fatty Alcohols 43
Solid-liquid equilibrium of binary mixtures containing fatty acids and triacylglycerols. Journal of Chemical & Engineering Data, 56, No. 8, 3277 (2011).
Coutinho, J. A. P., Predictive UNIQUAC: A new model for the description of multiphase solid-liquid equilibria in complex hydrocarbon mixtures. Industrial & Engineering Chemistry Research, 37, No. 12, 4870 (1998).
Coutinho, J. A. P., Pauly, J. and Daridon, J. L., A thermodynamic model to predict wax formation in petroleum fluids. Brazilian Journal of Chemical Engineering, 18, No.4, 411 (2001). Daniel, J. and Rajasekharan, R., Organogelation of
plant oils and hydrocarbons by long-chain saturated FA, fatty alcohols, wax esters, and dicarboxylic acids. Journal of the American Oil Chemists’ Society, 80, No. 5, 417 (2003).
Dos Santos, M. T., Le Roux, G. A. C. and Gerbaud, V., Phase equilibrium and optimization tools: application for enhanced structured lipids for foods. Journal of the American Oil Chemists’ Society, 88, No. 2, 223 (2011).
Egan, R. R., Earl, G. W. and Ackerman, J., Properties and uses of some unsaturated fatty alcohols and their derivatives. Journal of the American Oil Chemists’ Society, 61, No. 2, 324 (1984).
Ferguson, R. H. and Lutton, E. S., The polymorphism of triolein. Journal of the American Chemical Society, 69, No. 6, 1445 (1947).
Fredenslund, A., Jones, R. L. and Prausnitz, J. M., Group–contribution estimation of activity coeffi-cients in nonideal liquid mixtures. AIChE Journal, 21, No. 6, 1086 (1975).
Gmehling, J., Anderson, T. F. and Prausnitz, J. M., Solid-liquid equilibria using UNIFAC. Industrial & Engineering Chemistry Fundamentals, 17, No. 4, 269 (1978).
Gmehling, J., Li, J. and Schiller, M., A Modified UNIFAC Model. 2. Present parameter matrix and results for different thermodynamic properties. Industrial & Engineering Chemistry Research, 32, No. 1, 178 (1993).
Huang, C. C. and Chen, Y. P., Measurements and model prediction of the solid-liquid equilibria of organic binary mixtures. Chemical Engineering Science 55, No. 16, 3175 (2000)
Jakob, A., Joh, R., Rose, C. and Gmehling, J., Solid-liquid equilibria in binary mixtures of organic
compounds. Fluid Phase Equilibria, 113, No.1-2, 117 (1995).
Kolp, D. G. and Lutton, E. S., The polymorphism of n-hexadecanol and n-octadecanol. Journal of the American Chemical Society, 73, No. 12, 5593 (1951).
Kreutzer, U. R., Manufacture of fatty alcohols based on natural fats and oils. Journal of the American Oil Chemists’ Society, 61, No. 2, 343 (1984). Levine, I. N., Physical Chemistry. McGraw−Hill,
New York (2002).
National Bureau of Standards. NIST Chemistry WebBook <webbook.nist.gov> (Accessed in April 10, 2011).
Nichols, G., Kweskin, S., Frericks, M., Reiter, S., Wang, G., Orf, J., Carvallo, B., Hillesheim, D. and Chickos, J., Evaluation of the vaporization, fusion, and sublimation enthalpies of the 1-alkanols: the vaporization enthalpy of 1-, 6-, 7-, and 9-heptadecanol, 1-octadecanol, 1-eicosanol, 1-docosanol, 1-hexacosanol and cholesterol at T = 298.15 K by correlation gas chromatography. Journal of Chemical & Engineering Data, 51, No. 2, 475 (2006).
O’Brien, R. D., Formulating and Processing for Applications. CRC Press, Boca Raton (2004). Prausnitz, J. M., Lichtenthaler R. N. and Azevedo, E.
G., Molecular Thermodynamics of Fluid-Phase Equilibria. Prentice-Hall, New Jersey (1986). Reid, R. C., Praunitz, J. M. and Poling, B. E., The
Properties of Gases and Liquids. MacGraw−Hill, New York (1987).
Rolemberg, M. P., Equilíbrio sólido-líquido de ácidos graxos e triglicerídeos: Determinação experimen-tal e modelagem. Ph.D. Thesis, University of Campinas (2002). (In Portuguese).
Slaughter, D. W. and Doherty, M. F., Calculation of solid-liquid equilibrium and crystallization paths for melt crystallization processes. Chemical Engineering Science, 50, No. 11, 1679 (1995). Ventolà, L., Calvet, T., Cuevas−Diarte, M. A.,
Ramírez, M., Oonk, H. A. J., Mondieig, D. and Negrier, Ph., Melting behaviour in the n-alkanol family: Enthalpy–entropy compensation. Physical Chemistry Chemical Physics, 6, No. 8, 1786 (2004).