UNIVERSIDADE DA BEIRA INTERIOR
Ciências
Hair Analysis for Alcohol Biomarkers:
Assessing Excessive Consumption in a Student
Population
David Jerónimo Oppolzer
Tese para obtenção do Grau de Doutor em
Bioquímica
(3ºCiclo de estudos)
Orientador: Profª. Doutora Maria Eugenia Gallardo Alba
Co-orientador: Doutor Mário Jorge Dinis Barroso
Co-orientador: Prof. Doutor Luís António Paulino Passarinha
V This project was financed by the Programa de investigação de saúde de 2012 (reference 125895) from the Fundação Calouste Gulbenkian.
VII
Thesis overview
This thesis is structured into five main chapters:
Chapter I consists of a general introduction on the problematic of alcohol consumption, consumption monitoring approaches, and proposed objectives. In this part a review article is presented (manuscript 1), including a literature review of alcohol biomarkers used for the assessment of alcohol consumption.
Chapter II presents the experimental results obtained during the PhD, and includes information presented in the format of research articles:
Manuscript 2 - Determination of ethyl glucuronide (EtG) and fatty acid ethyl esters (FAEEs) in hair samples.
Manuscript 3 - Determination of ethyl glucuronide in hair to assess excessive alcohol consumption in a student population.
Manuscript 4 - Alcohol consumption assessment in a student population through combined hair analysis of ethyl glucuronide and fatty acid ethyl esters.
Chapter III consists of a general discussion of the presented results, also complementing the information presented in the manuscripts.
In chapter IV the main conclusions of the doctoral work are summarized. Finally, in chapter V future perspectives are presented.
IX
Acknowledgements
One of the most crucial parts in this project was the collection of hair samples from the numerous students. This was a specially challenging task, which required a lot of patience, effort, explanations and persistence to finally reach the required number of samples. This would have not been possible without the help of my laboratory colleagues. Too all of them, a cheerful thank you!
I’d like to thank to my supervisor Eugenia Gallardo, for the opportunity and share of knowledge about several aspects during the entire PhD, as well as the valuable discussions, corrections and help on the various obstacles. To my co-supervisor Mário Barroso, for his prompt availability at every encountered problem, correction of manuscripts, share of opinions and for the entire knowledge and opinions provided on hair testing. To my co-supervisor Luís Passarinha, for his availability and opportunities for collaboration in other research projects.
To my friends and colleagues, David and Fabiana thank you for all your help, not only during sample collection, but also in the laboratory. Particularly to David for his efficient abilities in persuading students to participate in the study, and not giving up even after days of collection, even after reaching eminent frustration. And Fabiana for her amazing speed at cutting hair, and constant will to help. To both of you, thank you also for the great times spent in the laboratory, and motivation by the good mood that became routine during the long days of work. Without you, all this could have not been the same.
To my parents, Manne and Hedy, and my brother Jolle, I’d like to thank for their continuous support and believe on my academic work, even if it meant that due to the workload we couldn’t meet often for several weeks. Your support and believe meant a lot and gave me much help and motivation during this entire time. To you Hedy, thank you also for all the help in Coimbra.
To Catarina, I own you more than any gratitude I could write in these lines. You’ve been my best friend and accompanied me day and night at every step of this project. You were present at every challenge, victory and defeat during this entire time, and were there for every decision that had to be taken and every problem to be solved. Despite to say that every opinion you gave and discussion about all kinds of obstacles were of great value to me, and I can’t recall how many times that helped me to keep on track with the work that had to be done. I should
X
also not forget the patience you had during all this time, every part of this project over the past years was made in a constant hurry, running against time. And even with the stress this brought to our lives, the fact that you remained patient and supportive, especially all those times when everything seemed to be going down the drain, is to be praised and shows the fabulous person you are. Thank you for everything, and most importantly, thank you for being yourself!
3 Years ago I would have never guessed that I would be writing the following lines. In fact, I would have never imagined that during this project something as surprising and wonderful, as you Lisa, would happen. Long before you were born you already took part in this project, you were present when hair was collected from students, during the entire time we spend working in the laboratory, and, from birth until now, during the entire writing process. You can’t imagine in how many ways you helped me during my work, you were the motivation that kept your mother and me working hard and spending excessive hours in the laboratory. And then after birth, every step of growth was an explosion of happiness to your parents’ eyes. You wouldn’t believe how much inspiring and motivating every babble and every smile you make is to us, and how often it made my day and made me realize how lucky I am. Thank you for being a part of my life!
XI
"The world is still a weird place, despite my efforts to make clear and perfect sense of it."
XIII
Abstract
Alcohol consumption within the student population has become an increasing health concern in several countries. The use of alcohol has deleterious consequences on intellectual performance of students, and can be associated with a variety of risky situations, as injuries, unplanned and unsafe sex, sexual and non-sexual violence, property damage and reckless driving. Monitoring alcohol consumption in the student population is therefore important to identify the degree of the problem and to assess consumption trends, allowing also for the implementation of adequate policies, as well as verifying their effectiveness.
Alcohol consumption can be monitored using statistics, such as survey studies performed on the population by means of questionnaires. These approaches have relative efficiency and are widely used; however, considerable limitations are associated to their use, making them unreliable for clinical and/or forensic purposes. Alcohol biomarkers are measurable substances in a biological sample, whose presence indicates some form of exposure to alcohol, and their use to assess alcohol exposure in clinical and forensic scenarios has been applied in a variety of biological specimens in the past years. One of the most notable of these specimens is hair, which presents several advantages, including non-invasive collection, ease of availability, long windows of detection and low chance of adulteration. Hair testing for alcohol exposure relies mainly on the analysis of two biomarkers, ethyl glucuronide (EtG) and fatty acid ethyl esters (FAEEs). These markers have been widely applied in several studies, and were shown to present good sensitivity and specificity.
Therefore, the objective of the present work was to evaluate the alcohol consumption on a university student population using two main approaches, one based on questionnaire analysis, and the second on the analytical determination of alcohol biomarkers in hair. A total of 1192 hair samples, and respective self-completion questionnaire were collected, 975 samples were analysed thereof.
Through analysis of the questionnaires it was found that alcohol consumption started mostly at the age of 15, and that most of the students considered their consumption as moderate, while almost one-third consumed alcohol excessively at least once in the last month. Beer was reported to be the most consumed beverage, and drinking was widely preferred accompanied. Places for alcohol consumption are mostly public places, such as coffee bars. Higher ingested quantities of alcohol per drinking occasion were associated with the male genre, but both genres presented mean alcohol volumes indicating risky and excessive drinking. The use of other substances was also assessed, including tobacco, which was a habit in one-third of the students. The incidence of the use of illicit substances was similar, and cannabis was the most consumed substance, but mainly on rare occasions. The use of illicit substances was however associated with drinking events in more than 50% of the students.
XIV
For alcohol biomarker analysis in hair, a method was developed for the analysis of EtG. The compound was extracted from the hair matrix by ultra-sonication with water, clean-up using mixed anion-exchange solid-phase extraction (SPE) and analysis by liquid chromatography coupled to tandem mass spectrometry (LC-MS/MS). A second method was developed for the analysis of four FAEEs (ethyl myristate, palmitate, oleate and stearate). The compounds were extracted from the hair matrix by incubation with heptane, extracts were cleaned-up with aminopropyl SPE and analysed by gas chromatography coupled to tandem mass spectrometry (GC-MS/MS). Both methods were validated according to guidelines from the Food and Drug Administration (FDA) and International Conference on Harmonization (ICH). Assessed parameters included sensitivity, limits, linearity, precision and accuracy, recovery, stability and matrix effect. The methods were found to be selective, with a limit of quantification of 3 pg/mg for EtG and 30 pg/mg for each of the four FAEEs. Linearity was obtained in the ranges of 3 – 500 pg/mg for EtG and 30 – 5000 pg/mg for FAEEs, and precision and accuracy were found acceptable according to the guidelines. Overall recovery ranged from 74.79% and 97.90%, and processed EtG samples were stable for at least 96h, and FAEEs samples for at least 24h. Matrix effects were evaluated for EtG analysis and were not significant.
Higher concentrations of both biomarkers were obtained for the male genre, and at the universities of Beira Interior and Coimbra. Based on hair sample results, individuals were categorized as abstinent, moderate or excessive drinkers, according to cut-off concentrations proposed by the Society of Hair Testing (SoHT) for both biomarkers. These values are 7 pg/mg of EtG, and 0.2 ng/mg (for 0-3 cm segments) or 0.4 ng/mg (for 0-6 cm segments) of FAEEs, to distinguish abstinence from moderate drinking. To distinguish moderate from excessive drinking, a value of 30 pg/mg of EtG, and 0.5 ng/mg (for 0-3 cm segments) or 1.0 ng/mg (for 0-6 cm segments) of FAEEs was used. At the proposed cut-off values, EtG presented good sensitivity (60-81.6%) and specificity (56.3–90.3%), while for FAEEs good specificity was obtained (87.5–100%), but sensitivity varied between 30.5% and 100%.
In order to verify if the currently proposed cut-off values are adequate for the studied population, receiver operating characteristic (ROC) analysis was performed, to determine the optimal cut-offs based on the results. Optimal EtG cut-off concentrations were determined to be 7.30 and 29.85 pg/mg, respectively for abstinence and excessive drinking, which are similar to those proposed by the SoHT. For FAEEs, optimal concentrations were 0.185 and 0.378 ng/mg for abstinence, at 0–3 cm and 0–6 cm hair segments, respectively, both similar to the proposed values. At the cut-off for excessive drinking, similar cut-off values were obtained for both lengths (0.817 and 0.889 ng/mg), but these are not similar to the proposed values. However, they confirm that harmonization of the excessive drinking cut-off value for FAEEs can be possible, at a concentration close to 0.8 ng/mg, regardless the length of the hair segment. The use of hair washing products, such as hair conditioner and mask, was found to be associated with lower concentrations of EtG in hair. Cosmetic treatments as bleaching and/or dyeing were associated with the same effect. No effect was associated with the use of hairspray, gel or wax,
XV and for the FAEEs there was no observable effect associated with any of the mentioned products. This demonstrates the importance of documenting the use of hair washing products and cosmetic treatments during sample collection, and the high care that must be taken during result interpretation, considering this information when positivity or negativity for a hair sample is to be given.
Both biomarkers correlated with the self-reported consumption habit, while only EtG correlated with the ingested quantities of alcohol per occasion. Inconclusive cases were obtained during combined interpretation of EtG and FAEEs. These cases could mostly be explained by the use of hair products and cosmetic treatments; however, in a number of cases where no simple explanation could be presented, the results of EtG analysis were in agreement with the questionnaire data. This indicates that EtG should be regarded as the first choice in alcohol consumption assessment, while FAEEs should be used to confirm the results from EtG analysis. Only 56.3% of the self-reported abstinent cases could be confirmed by combined analysis of EtG and FAEEs; for moderate drinkers this percentage was 71.6% and for excessive drinkers 60%. Alcohol consumption underestimation or overestimation are assumed as major reasons for this percentages. Combined alcohol biomarker analysis showed that the student population is majorly composed of moderate drinkers (69.39%), followed by abstinent (18.82%) and excessive drinkers (11.69%).
Overall, hair analysis for alcohol biomarkers proved to be a powerful tool for the assessment of alcohol consumption in a student population, with considerable advantages. Hair is a sample easy to collect through non-evasive manners, easily stored and the chances of adulteration are low. Therefore, it has good potential to be applied in population studies, especially because it can complete and confirm a great part of the information obtained by questionnaire analysis with added reliability, promoting as such sound and defensible results.
Key-Words:
Alcohol consumption, student population, alcohol biomarkers, ethyl glucuronide, fatty acid ethyl esters
XVII
Resumo Alargado
O álcool é a substância psicoativa mais consumida a nível mundial, e o seu consumo representa um problema de saúde crescente em diversos países. O consumo de álcool na população jovem é bastante comum, com particular destaque e incidência nos estudantes universitários. Deste modo, a população estudantil é considerada como um grupo de risco, no qual o consumo de álcool é associado a baixas performances a nível intelectual. O consumo excessivo de álcool pode ainda provocar diversos comportamentos de risco, nomeadamente sexo não planeado e não seguro, violência sexual e de outras naturezas, danos materiais e condução rodoviária irresponsável. Desta forma, a monitorização do consumo de álcool na população estudantil é fundamental para avaliar o panorama dos hábitos de consumo, bem como identificar tendências emergentes, permitindo a implementação de políticas de combate e avaliação da respetiva eficácia.
O consumo de álcool é frequentemente avaliado por estudos de inquérito, que recorrem à análise estatística de resultados obtidos através de questionários. Este método, apesar de possibilitar a recolha de uma vasta informação, apresenta algumas limitações, nomeadamente em relação à veracidade da informação recolhida, dado que o participante é passível de exagerar ou inclusivamente mentir nas respostas fornecidas. Assim, e de modo a obter resultados verdadeiros, é fundamental o recurso a outras ferramentas. O uso de métodos analíticos para determinação de biomarcadores de álcool em amostras biológicas assume grande interesse no contexto clínico e forense, podendo ainda ser usados como confirmação de dados obtidos através de questionários. Um biomarcador de álcool é uma substância passível de ser mensurável, e a sua presença na matriz biológica é normalmente indicativa de exposição. Nos últimos anos, o cabelo tem sido uma matriz amplamente estudada, com inúmeras vantagens, nomeadamente a sua fácil recolha por métodos não-invasivos, apresenta uma larga janela de deteção e é difícil de adulterar. A monitorização da exposição ao álcool através da análise de cabelo incide fundamentalmente em dois biomarcadores, o etil glucuronido (EtG) e os ésteres etílicos dos ácidos gordos (FAEEs). Estes dois marcadores têm sido usados em diversos estudos nos últimos anos, e apresentam boa sensibilidade e especificidade.
O presente trabalho teve como objetivo principal avaliar o consumo de álcool na população estudantil universitária portuguesa com recurso a dois métodos: questionários de autopreenchimento e determinação analítica de biomarcadores de consumo de álcool (EtG e FAEEs) em amostras de cabelo. A população foi equitativamente distribuída por 9 universidades portuguesas, 1192 amostras de cabelo foram recolhidas bem como os respetivos questionários. Em 975 amostras foi possível proceder à análise e determinação dos biomarcadores de álcool pelos métodos analíticos desenvolvidos.
XVIII
Os resultados dos questionários indicam que a idade de início de consumo de álcool se situa entre os 12 e os 18 anos, sendo que a maioria admite ter iniciado o consumo aos 15 anos. Em relação aos hábitos de consumo, os estudantes consideram o seu consumo como moderado, enquanto cerca de um terço da população assume ter consumido álcool em excesso no último mês. A bebida mais consumida é a cerveja, e a grande maioria prefere beber acompanhado e em locais públicos, como café-bar. Ao género masculino está associada uma ingestão de maiores quantidades de álcool por ocasião, contudo ambos os géneros apresentaram volumes de álcool indicativos de consumo de risco e excessivo. Nos questionários foi ainda recolhida informação sobre o consumo de outras substâncias, nomeadamente tabaco e substâncias ilícitas, e tendo aproximadamente um terço da população admitido o uso destas substâncias, com maior incidência no género masculino. A canábis é a substância ilícita mais consumida, sendo que maioria da população admite consumi-la raramente, contudo 50% dos participantes admitem utilizar substâncias ilícitas em conjunto com o álcool.
Tendo em conta as características físico-químicas dos biomarcadores de álcool, EtG e FAEES, foram desenvolvidos e otimizados dois métodos analíticos. Para a análise do EtG, a amostra de cabelo foi sujeita a ultra-sonicação em água, para extração do composto da matriz, seguindo-se extração em faseguindo-se sólida (SPE) e análiseguindo-se por cromatografia líquida acoplada a espetrometria de massa em tandem (LC-MS/MS). Relativamente aos FAEEs, foram analisados quatro compostos (miristato, palmitato, oleato e estearato de etilo), tendo os compostos sido extraídos do cabelo por incubação em heptano. Os extratos foram sujeitos a SPE e analisados por cromatografia gasosa acoplada a espetrometria de massa em tandem (GC-MS/MS). Ambos os métodos analíticos foram validados de acordo com normas internacionalmente aceites para a validação de métodos bioanalíticos, nomeadamente da Food and Drug Administration (FDA) e
International Conference on Harmonization (ICH). Os parâmetros avaliados foram
sensibilidade, limites, lineariadade, precisão e exatidão, recuperação, estabilidade e efeito matriz. Ambos os métodos mostraram ser seletivos, com limites de quantificação de 3 pg/mg, para o EtG, e de 30 pg/mg, para cada um dos FAEEs analisados. Os intervalos de linearidade situaram-se entre os 3–500 pg/mg e 30–5000 pg/mg, para o EtG e FAEEs, respetivamente. A precisão e exatidão revelaram ser aceitáveis de acordo com as normas utilizadas. A recuperação variou entre os 74,79% e os 97,90%, e as amostras processadas de EtG revelaram ser estáveis durante pelo menos 96h, enquanto que para os FAEEs foram estáveis pelo menos 24h. O efeito matriz foi apenas estudado para o EtG, não tendo sido considerado significativo.
A análise das amostras de cabelo mostra que o género masculino apresenta maiores concentrações de ambos os biomarcadores, sendo que as universidades da Beira Interior e de Coimbra foi onde foram registadas as concentrações mais elevadas. Os participantes foram divididos de acordo com o tipo de consumo: abstinente, moderado e excessivo, consoante as concentrações de cut-off propostas pela Society of Hair Testing (SoHT) para cada biomarcador. Os valores propostos para distinguir consumo abstinente de moderado são de 7 pg/mg para o EtG, e de 0,2 ng/mg (para segmentos de 0-3 cm) ou 0,4 ng/mg (para segmentos de 0-6 cm)
XIX para os FAEEs. Para distinguir consumo moderado de excessivo, foi usado o valor de 30 pg/mg para o EtG, e 0,5 ng/mg (para segmentos de 0-3 cm) ou 1,0 ng/mg (para segmentos de 0-6 cm) de FAEEs. O EtG apresentou boa sensibilidade (60–81,6%) e especificidade (56,3–90,3%) para cada cut-off proposto; para os FAEEs foi obtida boa especificidade (87,5–100%), mas a sensibilidade foi muito variável, tendo oscilado entre 30,5% e 100%.
Com o propósito de verificar se os cut-off atualmente propostos pela SoHT se adequam à população em estudo, foi elaborada análise através das curvas ROC (receiver operating
characteristic), e com base nos resultados obtidos foram determinados valores de cut-off
ótimos. Para o EtG, os valores determinados para o consumo abstinente e excessivo, foram de 7,30 e de 29,85 pg/mg, respetivamente. Para os FAEEs, a SoHT recomenda que seja tido em conta o comprimento do segmento do cabelo. Assim, os valores determinados para abstinência foram de 0,185 e de 0,378 ng/mg para os segmentos de 0-3 cm e 0-6 cm, respetivamente. No que respeita o consumo excessivo, foram obtidos valores semelhantes para os diferentes segmentos, de 0,817 e de 0,889 ng/mg, respetivamente. Os valores de consumo excessivo determinados para o EtG são similares aos propostos pela SoHT, contudo o mesmo não acontece para os FAEEs. Ainda assim, a proximidade dos valores obtidos para o consumo excessivo para estes compostos apoia a possibilidade de usar o mesmo valor de cut-off independentemente do comprimento do segmento analisado, considerando-se um valor de cerca de 0,8 ng/mg como adequado.
Foi ainda possível avaliar se o uso de tratamentos e produtos cosméticos interferiam na determinação dos biomarcadores de álcool. Os resultados obtidos para o EtG mostraram que o uso de produtos de lavagem, tais como acondicionador e máscara, estão associados a concentrações mais baixas, assim como tratamentos cosméticos como descoloração e/ou pintura. Por outro lado, o uso de produtos como laca, gel ou cera não mostraram ter qualquer efeito associado. Não foi observado qualquer efeito associado a tratamentos ou produtos específicos no caso dos FAEEs. Ainda assim, estes resultados reforçam a necessidade e importância de documentar os hábitos de higiene (por exemplo, número de lavagens) bem como o uso de produtos e tratamentos cosméticos, aquando da recolha da amostra. Estas informações devem ainda ser tidas em consideração na interpretação dos resultados e os casos tratados com particular atenção.
Tendo em conta os resultados para o EtG e FAEEs em combinação, foi possível verificar a existência de correlação entre a resposta nos questionários, em relação aos hábitos de consumo, e a concentração determinada para ambos os biomarcadores. Para o EtG, foi ainda possível encontrar correlação em relação às quantidades de álcool ingeridas por ocasião. Contudo, foram obtidos alguns casos inconclusivos durante a interpretação combinada de EtG e FAEEs. Em parte, isto pode ser justificado devido ao uso de produtos e tratamentos cosméticos, uma vez que estes podem influenciar a determinação dos biomarcadores em cabelo; contudo, não existe uma justificação simples para o elevado número de casos inconclusivos. Ainda assim, os resultados do EtG estavam em concordância com a informação
XX
recolhida nos questionários, o que reforça a ideia de que o EtG é um biomarcador mais fiável, devendo ser a primeira escolha para determinar o consumo álcool em amostras de cabelo, enquanto os FAEEs devem ser usados para confirmar os resultados da análise de EtG.
A análise combinada de EtG e FAEEs mostra que a população estudantil é maioritariamente composta por consumidores moderados (69,39%), seguido de abstinentes (18,82%) e excessivos (11,69%). Contudo, a análise combinada dos biomarcadores apenas permitiu confirmar 56,3% dos casos de consumo abstinente reportado nos questionários, e 71,6% e 60 % para o consumo moderado e excessivo. Tendo em conta que os questionários são de autopreenchimento, os participantes são suscetíveis de subestimar ou sobrestimar os seus hábitos do consumo aquando do preenchimento, o que permite justificar os resultados obtidos.
No geral, a análise de biomarcadores de álcool em cabelo mostrou ser uma poderosa ferramenta para a determinação de consumo de álcool na população estudantil. O cabelo é uma matriz que, para além de ser de fácil recolha, por métodos não-invasivos, é fácil de armazenar e difícil de adulterar. Por estes motivos, apresenta um grande potencial para ser aplicado a estudos populacionais, especialmente porque é capaz de completar e confirmar grande parte da informação obtida por questionários, com elevada veracidade.
Palavras-chave:
Consumo de álcool, população estudantil, biomarcadores do consumo de álcool, etil glucuronido, ésteres de ácidos gordos.
XXI
Index
Thesis overview ... VII Acknowledgements ... IX Abstract... XIII Resumo Alargado ... XVII Index ... XXI Index of Figures ... XXV Index of Tables ... XXVII List of Abbreviations ... XXIX List of Publications ... XXXV
Chapter I – General Introduction ... 39
1.1 Introduction ... 41
1.2 Alcohol Consumption in Students ... 41
1.3 Alcohol Monitoring ... 42
1.4 Alcohol Biomarker Analysis ... 43
1.4.1 Alcohol Biomarker ... 43
1.4.2 Manuscript 1 ... 45
1.5 Hair Analysis as a Tool to Monitor Alcohol Consumption ... 70
1.5.1 Hair Physiology ... 70
1.5.2 Incorporation of Substances in Hair ... 71
1.5.3 Advantages of Hair Testing ... 72
1.5.4 Analytical Considerations in Hair Testing ... 72
1.5.4.1 Decontamination ... 72
1.5.4.2 Isolation of Analytes from the Hair Matrix ... 73
1.5.4.3 Clean-up of Hair Extracts ... 73
XXII
1.5.5 Hair Testing for Alcohol Exposure ... 74 1.5.5.1 Properties of Ethyl Glucuronide and Incorporation in Hair ... 75 1.5.5.2 Properties of Fatty Acid Ethyl Esters and Incorporation in Hair ... 76 1.6 Objectives ... 78 Chapter II - Experimental ... 79 2.1 Study Outline and Description ... 81 2.2 Questionnaire Results Interpretation ... 82 2.2.1 Distribution by Gender ... 82 2.2.2 Distribution by Age and Start of Consumption ... 83 2.2.3 Consumption Frequency ... 84 2.2.4 Consumption Habits ... 86 2.2.5 Smoking ... 88 2.2.6 Use of Illicit Substances ... 89 2.3 Manuscript 2 ... 93 2.4 Manuscript 3 ... 123 2.5 Manuscript 4 ... 133 Chapter III – General Discussion ... 155 Chapter IV - Conclusions ... 169 Chapter V – Future Perspectives ... 173 Chapter VI - References ... 177 Chapter VII - Attachments ... 185 Attachment 1. Brief description of the study, applied methodologies and written consent provided to the participants. ... 187 Attachment 2. Self-completion questionnaire ... 190 Attachment 3. Processed sample stability of EtG ... 191 Attachment 4. Processed sample stability of FAEEs ... 192 Attachment 5. ANOVA analysis of the effect of washing products and cosmetic treatments on FAEEs concentrations. ... 193 Attachment 6. Normality tests of the EtG concentrations vs self-reported consumption habit. ... 194 Attachment 7. Normality tests of the FAEEs concentrations vs self-reported consumption habit. ... 194
XXIII Attachment 8. Descriptive analysis of the EtG concentrations vs self-reported consumption habit... 195 Attachment 9. Descriptive analysis of the FAEEs concentrations vs self-reported consumption habit... 196 Participation in other works ... 197
XXV
Index of Figures
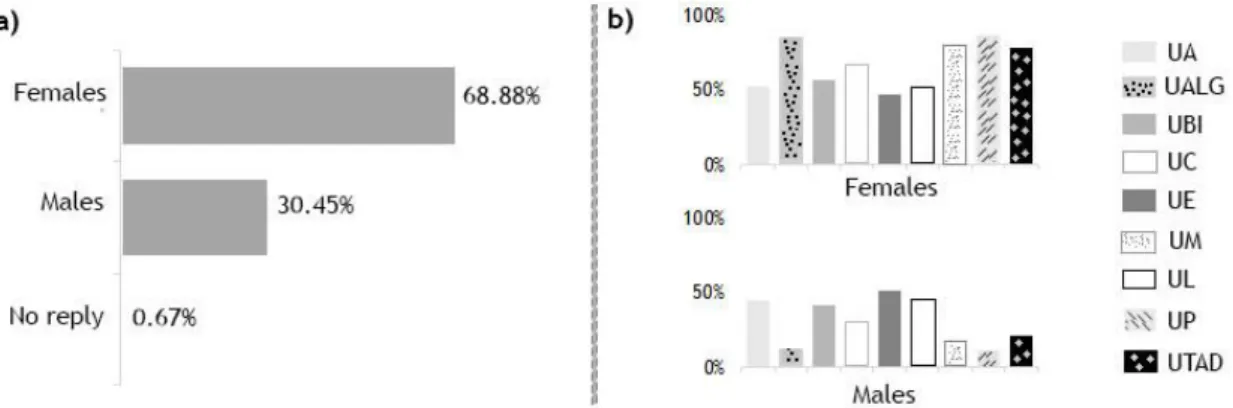
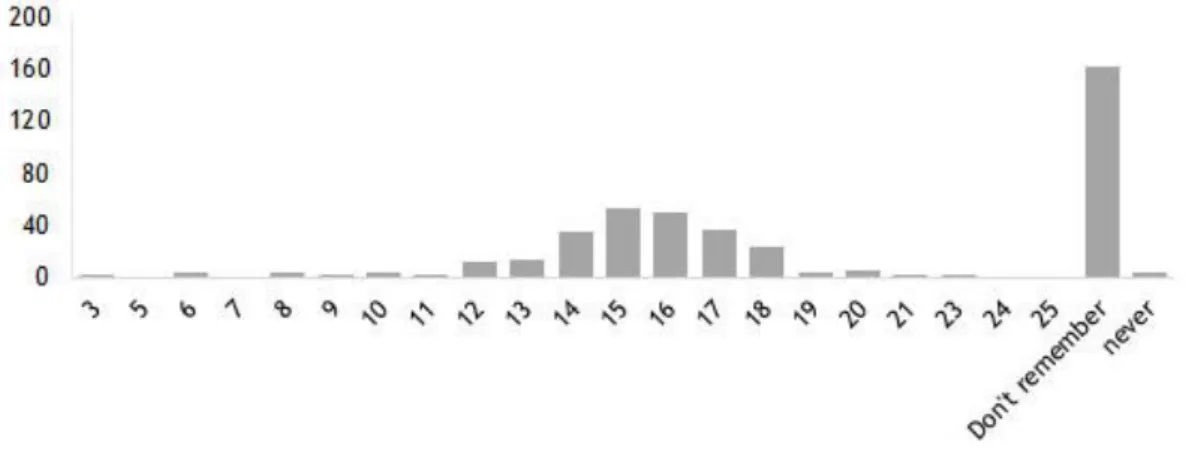
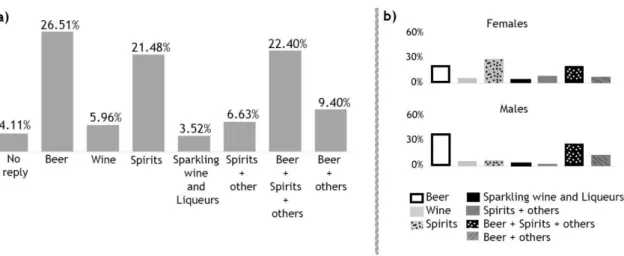
Figure 1. Schematic representation of a hair follicle (a), and structure of the human hair shaft (b). ... 70 Figure 2. Representation of the sweat and sebaceous glands surrounding the hair follicle, and mechanisms for substance incorporation into hair. ... 71 Figure 3. Distribution of the total enquired students according to gender (a), and distribution of gender according to university (b). ... 82 Figure 4. Distribution according to the age at which alcohol consumption started. ... 84 Figure 5. Alcohol consumption frequency of the studied population... 85 Figure 6. Excessive consumption before the date of sampling of the total population (a), and distribution according to university (b). ... 85 Figure 7. Preference for alcohol drinking in group for the total population (a), and distributed by university (b). ... 86 Figure 8. Places where alcohol is more often consumed, for the total population. ... 86 Figure 9. Most consumed drink among the studied population (a), and according to gender (b). ... 87 Figure 10. Percentage of smokers in the total population (a), and according to gender (b). . 89 Figure 11. Use of illicit substances in the total student population (a) and according to gender (b). ... 89 Figure 12. Use of illicit substances according to university ... 90 Figure 13. Illicit substance consumption frequency. ... 90 Figure 14. Type of illicit substances consumed by students. ... 91 Figure 15. Consumption of illicit substances together with alcohol in the total population (a), and distributed according to university (b). ... 91
XXVII
Index of Tables
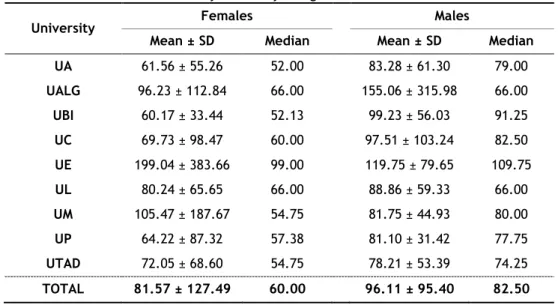
Table 1. Structure and chemical properties of the alcohol biomarkers EtG and FAEEs. ... 75 Table 2. Number of students enrolled in Portuguese universities in the academic year of 2013/2014, or 2012/2013. ... 81 Table 3. Mean and median age, and age when alcohol consumption started, of the enquired students per university. ... 83 Table 4. Mean and median ingested quantities of pure ethanol (in mL) per drinking occasion, distributed by university and gender. ... 88
XXIX
List of Abbreviations
5-HIAA 5-hydroxyindoleacetic acid 5-HT 5-hydroxytryptamine 5-HTOL 5-hydroxytryptophol
5-MMIA 5-Methoxy-2-methyl-3-indoleacetic acid
AcH Acetaldehyde
ADH Alcohol dehydrogenase ALDH Aldehyde dehydrogenase ALT Alanine aminotransferase ANOVA Analysis of variance
APA Acetaldehyde protein adducts
APCI Atmospheric pressure chemical ionization AST Aspartate aminotransferase
AUC Area under the curve BAC Blood alcohol concentration
BSTFA N,O-Bis(trimethylsilyl)trifluoroacetamide
C18 Octadecylsilane
C8 Octylsilane
CAS Chemical Abstract Service
CDG Congenital disorders of glycosylation CDT Carbohydrate-deficient transferrin CE Capillary electrophoresis
CI Chemical ionization
CIEF capillary isoelectric focusing CSF Cerebrospinal fluid
XXX CoA Coenzyme A CV Coefficient of variation d2 Double-deuterated d4 Tetra-deuterated d5 Penta-deuterated
DBS Dried blood spots
DLLME Dispersive liquid-liquid microextraction DMSO Dimethylsulphoxide
DUS Dried urine spots
ED Electrochemical detection
EI Electron impact
EIA Enzyme immunoassays
ELISA Enzyme-linked immunosorbent assay ELSD Evaporative light-scattering detection
EMCDDA European Monitoring Centre for Drugs and Drug Addiction ESI Electrospray ionization
ESPAD European School Survey Project on Alcohol and Other Drugs EtG Ethyl glucuronide
EtS Ethyl sulphate
EU European Union
FAEEs Fatty acid ethyl esters FDA Food and Drug Administration FID Flame ionization detection
FN False-negative
FP False-positive
GC Gas chromatography
XXXI GTOL 5-hydroxytryptophol glucuronide
HAA Haemoglobin associated acetaldehyde
Hb Haemoglobin
HDL High density lipoproteins HFBA Heptafluorobutyric anhydride
HILIC Hydrophilic interaction liquid chromatography HPLC High pressure liquid chromatography
HS Headspace
ICH International Conference on Harmonization ICPMS inductively coupled plasma mass spectrometry IEF Isoelectric focusing
IS Internal standard
Ko/w Octanol-water partition coefficient
LC Liquid chromatography
LLE Liquid-liquid extraction LLOQ Lower limit of quantification LOD Limit of detection
MAE Microwave-assisted extraction
MALDI Matrix-assisted laser desorption/ionization MAX Mixed anion-exchange
MCV Mean corpuscular volume
ME Matrix effect
MRM Multiple reaction monitoring
MS Mass spectrometry
MS/MS Tandem mass spectrometry
MW Molecular weight
XXXII
NAD+ Oxidized nicotinamide adenine dinucleotide NADH Reduced nicotinamide adenine dinucleotide PAGE Polyacrylamide gel electrophoresis
PBut Phosphatidylbutanol
PED Pulsed electrochemical detection PEth Phosphatidylethanol
PFPA Pentafluoropropionic anhydride
PLD Phospholipase D
PMF Peptide mass fingerprint PProp Phosphatidylpropanol R2 Coefficient of determination ROC Receiver operating characteristic
RP Reverse-phase
RT Retention time
SD Standard deviation
SLE Supported liquid extraction SoHT Society of Hair Testing
SPDE Solid-phase dynamic extraction SPE Solid-phase extraction
SPME Solid-phase microextraction
SSRI Selective serotonin reuptake inhibitor
Tf Transferrin
TN True-negative
TOF time-of-flight
TP True-positive
UA Universidade de Aveiro UALG Universidade do Algarve
XXXIII UBI Universidade da Beira Interior
UC Universidade de Coimbra UDP Uridine diphosphate UE Universidade de Évora UL Universidade de Lisboa UM Universidade do Minho UP Universidade do Porto
UTAD Universidade de Trás-os-Montes e Alto Douro
UV Ultraviolet
WADA World Anti-doping Agency
XXXV
List of Publications
Articles:
David Oppolzer, Mário Barroso, Eugenia Gallardo, "Bioanalytical procedures and developments in determination of alcohol biomarkers in biological specimens.", Bioanalysis, Vol. 8, No. 3, 229-251, 2016.
David Oppolzer, Mário Barroso, Luís Passarinha, Eugenia Gallardo, "Determination of ethylglucuronide (EtG) and fatty acid esters (FAEEs) in hair samples.", Biomedical
Chromatography, Accepted, 2016.
David Oppolzer, Mário Barroso, Eugenia Gallardo, "Determination of ethyl glucuronide in hair to assess excessive alcohol consumption in a student population.", Analytical and Bioanalytical
Chemistry, Vol. 408, No. 8, 2027-2034, 2016.
David Oppolzer, Eugenia Gallardo, Luis Passarinha, Mário Barroso, “Alcohol consumption assessment in a student population trough combined hair analysis of ethyl glucuronide and fatty acid ethyl esters.”, Addiction, Submitted, 2016
Oral presentations during the doctoral work:
David Oppolzer, Mário Barroso, Eugenia Gallardo, “Diagnóstico de consume excessive de álcool em estudantes universitários através da análise de etilglucoronido em cabelo.”, II Conferência Nacional de Medicina Legal e Ciências Forenses, 29th and 30th October (2015), Coimbra, Portugal.
David Oppolzer, Mário Barroso, Eugenia Gallardo, "Hair analysis to assess excessive alcohol consumption in a student population.", 20th Meeting of the Society of Hair Testing (SoHT), 3-6th May (2015), São Paulo, Brazil.
XXXVI
David Oppolzer, Mário Barroso, Luís Passarinha, João Queiroz, Eugenia Gallardo, "Alcohol biomarkers determination in alternative biological specimens: important approaches on alcohol consumption analysis.", II Jornadas Ibericas de Toxicologia, 13-15th November (2014), Covilhã, Portugal.
Posters presentations during the doctoral work:
Mário Barroso, David Oppolzer, Eugenia Gallardo, "Evaluation of ethanol consumption in university students: Hair analysis for specific biomarkers in 975 cases.", XXI Congresso Español y V Iberoamericano de Toxicología, 17-19th June (2015), León, Spain.
David Oppolzer, Mário Barroso, Eugenia Gallardo, "Development and validation of an analytical method for the determination of ethylglucuronide in hair by LC-MS-MS.", 20th Meeting of the Society of Hair Testing (SoHT), 3-6th May (2015), São Paulo, Brazil.
David Oppolzer, Mário Barroso, Luís Passarinha, João Queiroz, Eugenia Gallardo, "Determinação de etilglucoronido em amostras de cabelo por LC-MS/MS: um importante biomarcador do consumo de etanol", I Conferência Nacional de Medicina Legal e Ciências Forenses, 30th and 31st October (2014), Coimbra, Portugal.
Chapter I – General Introduction
39
Chapter I – General Introduction
Chapter I – General Introduction
41
1.1 Introduction
Ethanol is one of the most abundantly consumed teratogens amongst humans, and it is present in all alcoholic beverages. Alcohol is, directly or indirectly, the cause of several diseases, direct and indirect injuries, including violence, homicides and suicides [1–3], and 5.9% of all deaths worldwide are attributed to alcohol consumption [3]. Alcohol consumption prevails worldwide, and represents an important social-economic issue in several countries. The European Union (EU), presents the highest alcohol consumption in the world [1]. The average hospital expenditures for alcohol treatments per capita in 15 European countries was found to be of 8.5 euros and 1.76% of hospital days were attributable to alcohol treatment [4], and public expenditures for alcohol treatment exceed even those for the treatment of illegal drug addiction [4].
Excessive and irresponsible consumption reflects at either social, economic or health levels, but also at third parties, as occurs in the case of alcohol consumption during pregnancy, a trigger for domestic violence, traffic accidents or even those professions where drinking can cause or impair reactions capable of jeopardizing the life of others [1,2,5,6].
1.2 Alcohol Consumption in Students
Alcohol consumption amongst students is an increasing health concern in many countries [2]. According to the 2014 report of the European Monitoring Centre for Drugs and Drug Addiction (EMCDDA), results from a survey indicate that almost two-thirds of the students report drinking alcohol at least once in the last month, of which 20% were intoxicated [7]. While alcohol consumption begins at or even before the age of 13 [8], university students are more likely to binge drinking (characterized by a high number of drinks per occasion) and heavy episodic drinking (characterized by periods of high consumption) [2,9]. Alcohol consumption by students can have deleterious consequences on both school and academic performances, and has been associated to injuries, unplanned and unsafe sex, sexual and non-sexual violence, property damage and reckless driving [2,8,9].
It is therefore evident that monitoring alcohol consumption in the student population is of high importance. Firstly, for the evaluation of the impact of alcohol consumption on health, socio-economic and other harms. Secondly, to assess the degree of the problem, identify developing consumption trends and to develop and adopt adequate policies regarding alcohol consumption
Chapter I – General Introduction
42
[2]. Additionally, monitoring and evaluating alcohol consumption regarding existing alcohol policies is crucial to evaluate their effectiveness and to strengthen their impact [1].
1.3 Alcohol Monitoring
Statistics provided by government agencies are relatively well standardized and usually reliable. Besides, they have the advantages that, due to the number of international agencies participating in those statistics, clear and standardized results can be collected for harms of alcohol consumption and abuse on public health, economy and other issues. However, by being a human product, they are susceptible to being culture-specific and may be biased. For instance, one must consider that underestimation is very common in sales statistics due to other, licit or illicit, sources of supply; and morbidity or health treatment statistics are heavily influenced by the degree of development of alcohol treatment programmes, since higher specialized treatments are more likely to identify a disorder as alcohol-related [1].
Another monitoring approach is by surveys analysis. These are typically performed on the effectiveness of governmental policies, as well as on the population, to assess alcohol consumption by means of questionnaires. However, great limitations must be noted on this approach: information might be omitted or over-emphasized in governmental policies surveys in order to hide policy failures or stress the success of a given policy, respectively. In addition, high limitations are also associated to population surveys; besides the obvious implications of the number of participants that abstain from responding in such studies on the gathered information, consumption is often underestimated. Moreover, when dealing with adolescent and student populations, both underestimation and overestimation are likely to occur [1]. These above-mentioned alcohol monitoring approaches present several limitations, mostly associated to the fact that different facts may skew the results, individuals may misclassify their consumption and/or omit or over-emphasize certain information in the surveys, and obviously interpretation differences exist between individuals.
Chapter I – General Introduction
43
1.4 Alcohol Biomarker Analysis
1.4.1 Alcohol Biomarker
It is evident, especially when dealing with clinical and forensic scenarios, that such approaches as mentioned above are inefficient for the monitoring of alcohol consumption. Also, it is often important in these fields to know the current effect of alcohol on an individual and obtain a drinking history. Additionally, alcohol consumption is usually assessed in terms of quantities to which an individual was exposed [10].
Alternative approaches that cannot be influenced by the participants’ opinion and evaluate directly the degree of alcohol consumption are therefore preferred. In this context, analytical techniques can provide an answer to many of the mentioned limitations. This requires two important variables: a substance or molecule that is present or altered only in cases where alcohol was consumed, termed biomarker; and a biological specimen, where the biomarker can be found and successfully analysed. An alcohol biomarker can be defined as a measurable substance in a biological sample, whose presence indicates some form of exposure to alcohol. The biomarker plays a very important role, since it will have to: be able to discriminate between alcohol consumption (true exposure - sensitivity) and endogenous alcohol production (lack of exposure - specificity), remain in the biological specimen for a sufficient amount of time until analysis, and its detection should be relatively easy to perform. On the other hand, the biological specimen also plays a crucial role: its collection should ideally be an easy, non-invasive process to the individual, the collected sample should be in sufficient amounts, and the biomarkers should be stable in the sample. Overall, the process to analyse one or more biomarkers in a specific biological sample, should be a reliable, fast, preferably easy and inexpensive procedure [6].
Chapter I – General Introduction
Chapter I – General Introduction
45
1.4.2 Manuscript 1
B
IOANALYTICAL PROCEDURES AND DEVELOPMENTS IN THE DETERMINATION OF ALCOHOL BIOMARKERS IN BIOLOGICAL SPECIMENSDavid Oppolzer, Mário Barroso, Eugenia Gallardo
Chapter I – General Introduction
Chapter I – General Introduction
Chapter I – General Introduction
Chapter I – General Introduction
Chapter I – General Introduction
Chapter I – General Introduction
Chapter I – General Introduction
Chapter I – General Introduction
Chapter I – General Introduction
Chapter I – General Introduction
Chapter I – General Introduction
Chapter I – General Introduction
Chapter I – General Introduction
Chapter I – General Introduction
Chapter I – General Introduction
Chapter I – General Introduction
Chapter I – General Introduction
Chapter I – General Introduction
Chapter I – General Introduction
Chapter I – General Introduction
Chapter I – General Introduction
Chapter I – General Introduction
Chapter I – General Introduction
Chapter I – General Introduction
Chapter I – General Introduction
70
1.5
Hair Analysis as a Tool to Monitor Alcohol Consumption
1.5.1 Hair Physiology
Hair is a non-homogenous epidermal outgrowth, formed 3 – 5 mm below the skin surface in the hair follicle, which obtains the necessary metabolic material for the growing hair from a rich capillary system that surrounds the follicle [11]. The hair shaft is formed by three concentric structures, cuticle, cortex and medulla (Figure 1a and 1b). These structures play different roles on the characteristics of hair [12], and are formed of keratinized cells that are glued by the cell membrane complex (Figure 1b) [11]. Hair is composed of 65–95% proteins (mainly keratin), 15–35 % water, 1–9% lipids and less than 1% minerals [13,14]. The cell membranes consist mostly of protein and protein-lipid complexes, which are more vulnerable to chemical and mechanical actions. This part of hair is also a diffusion point for incorporation and elimination of drugs, especially those of lipophilic nature. Melanocytes are located in the basement membrane of the cortex and are responsible for pigmentation, they play also an important role in the incorporation of basic drugs in hair [11].
Figure 1. Schematic representation of a hair follicle (a), and structure of the human hair shaft (b). Adapted from Kronstrand et al., 2006 [13] and Pragst et al., 2006 [11]
Each hair is associated to a sebaceous gland and is in proximity of sweat glands (Figure 2). The sebaceous gland surrounds the hair duct to the upper part of the root to ensure that new hair is bathed in sebum for 2–3 days before reaching surface. The sweat glands hydrate the hair
Chapter I – General Introduction
71 shaft and contribute to the incorporation of hydrophilic drugs. The growth rate of scalp hair is approximately 0.35 mm per day [13], ranging from 0.6 to 1.4 cm per month [11,12,14].
Figure 2. Representation of the sweat and sebaceous glands surrounding the hair follicle, and mechanisms for substance incorporation into hair. Source: Kronstrand et al., 2006 [13]
1.5.2 Incorporation of Substances in Hair
There are three different mechanisms for the incorporation of different substances into hair, as can be seen in Figure 2. The blood supply provided by the capillary system surrounding the follicle is one of these routes. To penetrate the growing hair matrix the substances need to diffuse across its cell membrane, depending on the compounds’ lipid solubility and the pH of both the cell and plasma. This transport is also selective to unbound substances only [12,13]. Another route is incorporation from sweat and sebum produced by nearby glands, after the hair emerges from skin [12,13]. As stated above, these secretions are in direct contact with the hair shaft, facilitating incorporation. Additionally several substances, including their metabolites, are excreted in sweat [14].
The third route of incorporation is through external contamination from smoke, vapours, dirty hands or different products containing the drugs [12–14]. When substances come in contact with hair through by any of those means, dissolution into sweat will occur. Consequently, the drugs will incorporate into hair, and at this point it will be almost impossible to distinguish
Chapter I – General Introduction
72
between a consumed substance and external contamination [12,14]. A clear example of this is seen in scientific literature, where positive cases for ethyl glucuronide in hair are due to its presence in some hair-care products (e.g. herbal tonics) [10,15,16].
1.5.3 Advantages of Hair Testing
Hair testing for substances presents several advantages when compared to other more traditional specimens as blood and urine, from which the most evident is the non-invasive sample collection procedure, which protects individual privacy and enhances the examinee’s collaboration. Another powerful advantage is the ability to provide retrospective time windows for substance use that range from weeks to months or even years, depending on the hair length and analysed substance. It is even possible to perform segmental analysis to assess a substance exposure history for an individual, taking into account the growth rate and variations between individuals. Moreover, hair has also the advantage of a low risk of adulteration, and in case of suspicions and/or breaches in the chain of custody it is possible to get an identical sample from the same individual, or at least a sample representing a similar timeline [11,12].
1.5.4 Analytical Considerations in Hair Testing
Hair is a complex matrix and for a reliable analysis it is essential that results interpretation is performed carefully and possibilities of external contamination considered. The analysis procedure of a hair sample becomes thus a complex task. Different steps are required for hair analysis, including sample decontamination, extraction of analytes, sample clean-up and analytical detection, which will be briefly discussed below.
1.5.4.1 Decontamination
An important consideration to be taken into account during hair analysis is the possibility of a substance being determined due to environmental contamination and not following active consumption, which might originate false-positive results [12]. For this reason hair samples
Chapter I – General Introduction
73 should be cleaned from external contamination. This decontamination procedure is also very important to eliminate residues of hair products, sebum, sweat, dust and other contaminants from hair, since these can lead to increased analytical background noise. The solvents used during the decontamination procedure should remove external interferences as much as possible, but should not extract the incorporated compounds. There is no agreement on the washing procedures reported in literature, however the thorough choice of adequate solvents can be crucial for a correct analytical outcome of hair analysis [11].
1.5.4.2 Isolation of Analytes from the Hair Matrix
For the analysis of incorporated compounds, these have to be extracted from the hair matrix usually through solubilisation or digestion. For the choice of the correct procedure, the structure of the compounds and their properties have to be taken into account. Different procedures include the use of several solvents (as methanol, hexane or water), supercritical fluid extraction, and acidic, alkaline or enzymatic digestion. Before this process and to facilitate extraction, hair samples are usually cut into fragments of 1–3 mm, or pulverized using a grinder. Grinding procedures have resulted in increased extraction efficiencies for some compounds, however some sample material may be lost during the process [10,11].
1.5.4.3 Clean-up of Hair Extracts
Impurities and hair constituents present in hair extracts hinder the direct analysis of these solutions, and therefore a further clean-up step is usually deemed necessary. The applied techniques are similar to those used for other specimens as blood and urine, and include liquid-liquid extraction (LLE), solid-phase extraction (SPE), headspace solid-phase microextraction (HS-SPME) and headspace solid-phase dynamic extraction (HS-SPDE). SPE is commonly used due to its laboratory availability and ease of automation, however HS-SPME coupled to GC-MS shows great possibilities due to its automation by online coupling, and due to the fact that it is a miniaturized technique [11,17].
Chapter I – General Introduction
74
1.5.4.4 Detection Techniques
Hair analysis is challenging in what concerns the analytical instruments necessary for the detection of compounds. In the high complexity of hair samples, the analytical method will have to allow unambiguous detection and quantification of the compound(s) of interest, presenting high selectivity. Additionally, the concentrations of the drugs are commonly very low and samples are usually available in small amounts. Depending on the nature of the compound to be studied, liquid (LC) or gas chromatography (GC) may be used for compound separation. In order to be able to detect low concentrations, the coupling of gas or liquid chromatographers to mass spectrometry (MS) or tandem mass spectrometry (MS/MS) is necessary for the high sensitivities provided and also the capability for unambiguous identification of the involved compounds [11].
1.5.5 Hair Testing for Alcohol Exposure
Ethanol determination in hair is not possible due to its volatile nature, fast metabolism and to the fact that it is not durably incorporated into hair [11,18]. Therefore, hair analysis for evaluation of alcohol consumption is performed via the determination of the minor ethanol non-oxidative metabolites, ethyl glucuronide (EtG) and fatty acid ethyl esters [FAEEs, ethyl myristate, palmitate, oleate and stearate]. The structures and physical and chemical properties of these alcohol biomarkers are presented in Table 1.
Chapter I – General Introduction
75 Table 1. Structure and chemical properties of the alcohol biomarkers EtG and FAEEs. Information was
gathered from the database of PubChem [19].
Compound Structure CASa Molecular
Formula
MWb
(g/mol) Ko/wc
Ethyl
Glucuronide 17685-04-0 C8H14O7 222.2 -1.4
Fatty Acid Ethyl Esters Ethyl myristate 124-06-1 C16H32O2 256.4 6.7 Ethyl palmitate 628-97-7 C18H36O2 284.5 7.8 Ethyl oleate 111-62-6 C20H38O2 310.5 8 Ethyl stearate 111-61-5 C20H40O2 312.5 8.9
a CAS: Chemical Abstract Service b MW: Molecular weight
c K
o/w: octanol-water partition coefficients
1.5.5.1 Properties of Ethyl Glucuronide and Incorporation in Hair
EtG is formed during the phase II metabolism of ethanol by conjugation with glucuronic acid mediated by UDP – glucuronyltransferase. Considering the octanol/water partition coefficients (Ko/w), the hydrophilic nature of EtG becomes evident. The mechanism of incorporation of EtG into hair is not clear yet, but since EtG has been determined in sweat [20] deposition from sweat is believed to be the main route [21]. However, other authors have shown that EtG is determined in hair of rats, which lack sweat glands in their fur [18]. Based on this, the bloodstream was found likely to also display a major role in the incorporation of EtG into hair. EtG only incorporates weakly due to its acidic properties (pKa = 3.21), which results in very low concentrations in hair, usually in the range of a few picograms per milligram of hair (pg/mg) [18,22]. This highlights the need of sensitive and selective techniques for the analysis of this compound in hair, and the fact that mass spectrometric detection is mandatory.
Chapter I – General Introduction
76
Hair care and cosmetic treatment products and habits may affect the concentration of EtG in hair. As already mentioned above, some hair products, like herbal hair tonics, may contain EtG in their formulation, and consequently increase the concentration of this compound in hair [10,15,16]. Conversely, cosmetic treatments, as bleaching or dyeing, may result in a washout effect of EtG [23–27], lowering concentrations; however, this may also occur due to intensive hair washing [28,29].
Despite being present in a few hair-care products, external contamination of hair by EtG is improbable, therefore the decontamination procedure is more focused on removing impurities that may interfere with analysis. There is no general accepted procedure, however non-swelling agents as acetone and dichloromethane are preferred to avoid EtG extraction [10]. Often, a sequential washing procedure with solvents of different polarities (water, methanol, acetone, dichloromethane, ether, and heptane) is used [24].
Grinded powdered hair results in increased extraction of EtG, and is usually preferred when compared to cut hair [10,30,31]; however, this procedure may be used if similar extraction efficiencies are obtained [32].
The SoHT currently proposes the use of a concentration of 7 pg/mg for distinguishing between abstinence and social moderate drinking, while a concentration equal or superior to 30 pg/mg is indicative of chronic excessive drinking. Both cut-off values are valid at 0-3 cm and 0-6 cm segments [32].
1.5.5.2 Properties of Fatty Acid Ethyl Esters and Incorporation in Hair
FAEEs are formed from free fatty acids, triglycerides, lipoproteins or phospholipids in the presence of ethanol, by action of cytosolic and microsomal FAEE synthases as well as by unspecific enzymes. As can be seen from Table 1, these compounds have linear structures, and the intact ethyl group of ethanol is maintained. FAEEs are non-polar in nature, and this may be observed by the ko/w, thus facilitating lipophilic incorporation into hair, which occurs mainly from sebum [10,11].
The use of hair treatments as bleaching, perming or dyeing may affect the concentration of FAEEs in hair. Additionally, the use of ethanol-containing hair products may originate false-positive results. Due to the effects of the use of hair products on hair results for both EtG and FAEEs, the use of those products should therefore be documented during sample collection and carefully considered during results interpretation [10,29,32]. In addition, a combined interpretation of both markers’ concentrations is recommended [5,10,23,29,33].
Chapter I – General Introduction
77 During hair sample treatment for FAEEs analysis it is important that the use of plastic material is avoided. The decontamination procedure to be applied will have to remove the FAEEs present in the external lipids, but avoid their extraction from hair. The solvent used is usually n-heptane for the high solubility of the external lipids in this non-polar solvent. Interestingly, contrary to EtG analysis, grinding procedures are unsuitable for FAEEs analysis, since these results in analyte losses due to the evaporation of FAEEs [10].
Due to the fact that FAEEs tend to increase with the hair length [34], the SoHT currently proposes the use of different cut-off values at 0-3 cm and 0-6 cm segments. A concentration of 0.2 ng/mg (at 0-3 cm segments) or 0.4 ng/mg (at 0-6 cm segments) is proposed to distinguish between abstinence and social moderate drinking. Concentrations equal or superior to 0.5 ng/mg (at 0-3 cm segments) or 1.0 ng/mg (at 0-6 cm segments) are indicative of chronic excessive drinking [32].
Chapter I – General Introduction
78
1.6 Objectives
The objective of the present work was to evaluate the alcohol consumption on a university student population by two main approaches, one based on questionnaire analysis, and another based on the analytical determination of alcohol biomarkers in hair. The following specific objectives were defined:
1. Collection of hair samples at nine Portuguese public universities (Aveiro, Algarve, Beira Interior, Coimbra, Évora, Lisboa, Minho, Porto and Trás-os-Montes e Alto Douro), and gathering a self-completion questionnaire from each participant.
2. Interpretation of the questionnaires to assess alcohol consumption habits, patterns and trends, and comparison with published data concerning the year 2011.
3. Development and optimization of analytical methods for the determination of alcohol biomarkers in hair:
a. Extraction of EtG from hair, sample clean-up by solid-phase extraction and analysis by liquid chromatography coupled to tandem mass spectrometry; b. Extraction of FAEEs from hair, sample clean-up by solid-phase extraction and
analysis by gas chromatography coupled to tandem mass spectrometry; c. Validation of both methods according to internationally accepted guidelines for
bioanalytical method validation.
4. Analysis of students’ hair samples for EtG and FAEEs, considering the cut-off values proposed by the SoHT, and:
a. General demographic and gender assessment of biomarker analysis results; b. Verification of the adequacy of the currently proposed values for the studied
population through ROC analysis;
c. Evaluation of the effects of hair products and cosmetic treatments on EtG and FAEEs concentrations in hair;
d. Evaluation of the congruence between self-reported consumption habits and alcohol biomarker analysis.
79
Chapter II - Experimental
Chapter II - Experimental
81
2.1 Study Outline and Description
The present study is characterized as an epidemiological, descriptive and cross-sectional study. The entire sampling and analysis procedures were anonymous, and were performed in a complete random manner. Sampling was performed between March 2013 and September 2014, at random times during the day(s) of collection. Each participant was informed about the objectives of the study and of the gathered information before sampling, and a written consent was provided, consisting in a brief description of the project and applied methodologies (Attachment 1). The project was submitted and approved by the ethical committee of the Faculdade de Ciências da Saúde (FCS) from the Universidade da Beira Interior (UBI).
The study population in this work consisted of students from nine Portuguese universities: Aveiro (UA), Algarve (UALG), Beira Interior (UBI), Coimbra (UC), Évora (UE), Lisboa (UL), Minho (UM), Porto (UP) and Trás-os-Montes e Alto Douro (UTAD). In order to obtain an adequate selection of samples and significant number of samples to be analysed in each targeted institution, the representative number of necessary samples was calculated. This was performed using the Epi Info TM (version 7.1.4) software (Centers for Disease Control and Prevention, USA). A 90% frequency of alcohol consumption was assumed [35], and based on the number of students enrolled in the academic year of 2012/2013 or 2013/2014, the number of necessary participants for each university was calculated assuming a 95% confidence interval. These data are provided in Table 2.
Table 2. Number of students enrolled in Portuguese universities in the academic year of 2013/2014, or 2012/2013.
University Enrolled students* Sample size
Universidade de Aveiro (UA) 13779** 137
Universidade do Algarve (UALG) 9708 137
Universidade da Beira Interior (UBI) 6931** 136
Universidade de Coimbra (UC) 23958 138
Universidade de Évora (UE) 8970 137
Universidade de Lisboa (UL) 67005 138
Universidade do Minho (UM) 18490 138
Universidade do Porto (UP) 31385 138
Universidade de Trás-os-Montes e Alto Douro (UTAD) 7808 136 *Data obtained from the Direção-Geral de Estatísticas da Educação e Ciência in the academic years of 2013/2014. **academic year of 2012/2013. [36]