Review
Development of headspace solid-phase microextraction-gas
chromatography–mass spectrometry methodology for
analysis of terpenoids in Madeira wines
J.S. Cˆamara
a,∗, M. Arminda Alves
b, J.C. Marques
aaDepto. de Qu´ımica da Universidade da Madeira, Campus Universit´ario da Penteada, 9000-390 Funchal, Madeira, Portugal bDepto. de Eng Qu´ımica, Faculdade de Engenharia, Universidade do Porto, Rua Dr. Roberto Frias, 4200-465 Porto, Portugal
Received 17 February 2005; received in revised form 1 September 2005; accepted 5 September 2005 Available online 3 October 2005
Abstract
A dynamic headspace solid-phase microextraction methodology was developed for analysis of varietal aroma compounds in must and Madeira wine samples, a spirit wine with an ethanol content of 18% (v/v). The factors with influence in the headspace solid-phase microextraction efficiency such as: fibre coating, extraction time and temperature, pH, ionic strength, ethanol content, desorption time and temperature, were optimised and the method validated. The best results were obtained for a 85m polyacrylate fibre, with a 60 min headspace for must and 120 min for wine samples, in a 2.4 ml sample at 40◦C with 30% of NaCl. The extract is injected in the splitless mode in a GC–MS Varian system, Saturn III, and
separated on aStabilwaxcapillary column. The linear dynamic range of the method covers the normal range of occurrence of analytes in wine with typicalr2between 0.985 (-ionone) and 0.998 (linalool) for musts and between 0.980 (␣-terpineol) and 0.999 (linalool) for must and wine samples,
respectively. For must samples the reproducibility ranges from 2.5% (citronellol) to 14.4% (nerolidol) (as R.S.D.), and from 4.8% (citronellol) to 14.2% (nerolidol) for wine samples. The analysis of spiked samples has shown that matrix effects do not significantly affect method performance. Limits of detection obtained are in lowg l−1range for all compounds analysed in this study.
© 2005 Elsevier B.V. All rights reserved.
Keywords: Solid-phase microextraction; Optimisation; Varietal compounds; Must; Wine
Contents
1. Introduction . . . 192
2. Experimental . . . 193
2.1. Samples . . . 193
2.2. Chemicals and reagents . . . 193
2.3. Standards and samples preparation . . . 193
2.4. SPME analytical procedure . . . 193
2.5. Chromatographic conditions . . . 194
2.6. Method development . . . 194
2.7. Method validation . . . 194
2.8. Quantification . . . 195
3. Results and discussion . . . 195
3.1. Method development . . . 195
3.1.1. Selection of SPME fibre . . . 195
3.1.2. Effect of extraction temperature . . . 195
∗Corresponding author. Tel.: +351 291 705100/2; fax: +351 291 7051449.
E-mail address:[email protected] (J.S. Cˆamara).
3.1.3. Extraction-time profile . . . 196
3.1.4. Effects of salt concentration . . . 196
3.1.5. Effect of pH . . . 197
3.1.6. Effect of ethanol content . . . 197
3.1.7. Desorption temperature and time . . . 197
3.2. Validation of the analytical method . . . 197
3.2.1. Linearity and detection limits . . . 197
3.2.2. Precision . . . 198
3.2.3. Accuracy . . . 198
3.3. Application to real samples—must and Madeira wines . . . 198
4. Conclusions . . . 199
Acknowledgments . . . 199
References . . . 199
1. Introduction
Since the 16th century, the Portuguese Madeira Island pro-duced one of the most famous wines known over the world as Madeira wine. These can be characterised by a typical vinifi-cation and aging procedure that includes fortifivinifi-cation (addition of natural grape spirit), in order to obtain an alcoholic content between 18 and 22% (v/v), followed by a baking process known as “estufagem”, during which the wine is submitted to rather high temperatures (45–50◦C) for 3 months. The physicochemical
and organoleptic characteristics of such fortified wines depend on several factors concerning the specific area of production, climate, nature of soil, grape varieties, the degree of ripeness, fermentation conditions, wine making processes and aging of the wine[1].
The volatile fraction of a wine can be composed of more than 800 different compounds[2,3]but only 30–40 of which can be odour-active[4,5]. A key position is held by monoterpenols especially for the aroma of Muscat and related cultivars, but also could contribute to the aroma of other non-Muscat cultivars such as Boal, Malvazia, Sercial and Verdelho from which Madeira wines are made. These varieties are perfectly adapted to the sandy soil as well as to the climatic conditions that characterise the region where are cultivated.
Some components are present in high concentration (hun-dreds of mg l−1), but most are found at the low ng l−1 level. Therefore some components need to be extracted and concen-trated before analysis, while others can be analysed by GC with direct injection. However, the major compounds from the com-plex wine matrix cause some interference and make analysis of trace compounds problematic. Since the majority of the ter-penoid compounds occur in micro concentrations (in grapes, must and wines) their quantification is quite difficult.
Several classical analytical methods such as liquid–liquid extraction (LLE)[6–8], liquid–liquid microextraction (LLME) [7,9,10], simultaneous distillation-solvent extraction[11], solid-phase extraction (SPE) [12–16], supercritical fluid extraction [17], microwaves extraction[18]and ultrasound extraction[19], among others, have been developed for the analysis of the minor volatile compounds in wines. These classical analytical methods have some drawbacks such as the relatively low reproducibility, possibility of contamination with solvents, the length of time
required and insufficient selectivity. SPE and LLME are rapid and inexpensive, but to achieve the required limits of detection, a concentration step (solvent evaporation) is required, which increases the sample preparation step and may also cause loss of volatile analytes during the evaporation.
In the beginning of 90 decade, a new variation of adsorp-tion technique called solid-phase microextracadsorp-tion (SPME) has been developed by Pawliszyn and co-workers[20–22]. Com-pared to traditional techniques this new technique offers many advantages such as high sensitivity and reproducibility, does not require solvent and combines extraction and pre-concentration in a single step without pre-treatment of samples. Moreover it is fast, inexpensive, requires low sample volumes and can be easily automated[23–26]. This technique has been success-fully been used in wine samples[27–29]to characterise a wide range of aroma compounds, including monoterpenes and C13 norisoprenoids[30], esters[31], volatile and low volatile sul-phides and disulsul-phides [32–34], oak lactones in barrel aged wines[35], organochlorine insecticides in Portuguese red and white wines[36]and 3-alkyl-2-methoxypyrazines in Cabernet-Sauvignon and Merlot wines[37]. SPME has also been applied for the analysis of Portuguese muscatel wines[38], for the clas-sification of Nebbiolo-based wines from Piedmont[39]and for varietal characterisation of Madeira wines[30]. More recently was reported the application of SPME to the characterisation of varietal wines, using PDMS as stationary phase[40]. The deter-mination of esters[31]and major compounds in dry and sweet wines[41]were also performed by HS-SPME in commercial wines from the Canary Islands.
extract analytes via absorption[42]. The remaining coatings, including PDMS-DVB, Carbowax-DVB, and Carboxen are mixed coatings, in which the primary extracting phase is a porous solid, extracting analytes via adsorption. Independently of the nature of the coating, analyte molecules initially get attached to its surface. Whether they migrate to the bulk of the coating or remain at its surface depends on the magnitude of the diffusion coefficient of an analyte in the coating.
Weak intermolecular interactions play the most important role in analyte extraction by the porous polymer SPME coating. The number of surface sites where adsorption can take place is limited. So, when all sites are occupied no more analyte can be trapped[43,44]. This means that the dependence between the concentration of the analyte in a sample and the amount of the analyte extracted by SPME coating cannot be linear over broad concentrations ranges. Moreover, while absorption is a non-competitive process, adsorption is non-competitive, and a molecule with higher affinity for the surface can replace a molecule with lower affinity. Thus the amount extracted by the fibre can be significantly affected by sample matrix composition.
SPME is very sensitive to experimental conditions. Any changes of experimental parameters, which affect the distri-bution coefficient and absorption rate, will also influence the amount absorbed on the SPME fibre and the corresponding reproducibility.
The purpose of this study was to develop and optimise an HS-SPME procedure for the determination of trace levels of terpenoid compounds—linalool,␣-terpineol, citronellol, nerol, geraniol, nerylacetone, nerolidol,-damascenone,␣-ionone and -ionone, in must and Madeira wine samples, a liquorous wine with a alcoholic content of 18% (v/v). The method is based on the extraction of the analytes of the interest from headspace over the must and wine samples with SPME, followed by GC–MS analysis. The factors affecting the SPME process extraction such as fibre coating, extraction time and temperature, pH, ionic strength, ethanol content, desorption time and temperature, were studied.
2. Experimental
2.1. Samples
Must and wine samples from Boal,Malvazia,Sercial and Verdelhovarieties of 2000 vintage were supplied fromInstituto do Vinho Madeira(IVM) andMadeira Wine Company(MWC). The vinification process for all varieties was carried out at the same way. The fermentation is stopped by addition of spirit when the appropriate amount of natural grape sugars, according to the wine type to obtain (sweet, medium sweet, dry and medium dry), has been fermented. The 36 wine samples were collected 8 months after fermentation and stored at−28◦C until use.
2.2. Chemicals and reagents
The standards of the different terpenoid compounds studied: linalol (lin),␣-terpineol (ter), citronellol (cit), nerol (ner), geran-iol (ger), nerylacetone (neril), nerolidol (nero),␣-ionone (a-ion)
and-ionone (b-ion), with a purity above 98%, were supplied by Sigma–Aldrich (Portugal) and used without previous purifi-cation step.-Damascenone (dam) was purchase by Firmenich (Switzerland). Octan-3-ol (99.8%) purchased by Sigma–Aldrich was used as internal standard (IS).
Methanol and ethanol HPLC grade (purity < 99.8%), were provided by Merck (Darmstadt, Germany). Sodium chloride (NaCl) of analytical grade (Merck, Darmstadt, Germany), used in the ionic strength adjust was previously heated at 500◦C for
9 h. Water (HPLC grade) was obtained from a Milli-Q system (Millipore).
2.3. Standards and samples preparation
Individual stock standard solutions of each terpenoid com-pound were prepared by weight in methanol and stored until use. The internal standard (IS) solution was done in hydro alco-holic solution (1/1, v/v). Working solution used in further studies containing the following compounds at fixed concentrations: linalool (lin), 429.5g l−1;␣-terpineol (ter), 112.8g l−1; cit-ronellol (cit), 57.6g l−1; nerol (ner), 43.8g l−1; geraniol (ger), 43.9g l−1; nerylcetone (neril), 86.8g l−1; nerolidol (nero), 43.8g l−1; -damascenone (dam), 93.4g l−1; ␣-ionone (a-ion), 77.6g l−1; and -ionone (b-ion), 77.g l−1, were prepared by diluting different amounts of the global stan-dard solution in a synthetic matrix with ethanol content at 18% (v/v) and pH at 3.3.
Finally five calibration solutions (18%, v/v) in the range spec-ified inTable 1were prepared by suitable dilution of the global solution and tested in triplicate; these concentrations covered the concentration ranges expected for terpenoids in must and Madeira wine samples studied. The concentration of internal standard in all calibration solutions was 0.422g l−1.
To 10 ml of centrifuged (5000 rpm) must and wine samples were added 3 g of NaCl and 10l of octan-3-ol in hydro alco-holic solution (1/1, v/v) at 422 mg l−1as internal standard. The solution was stirred during 5 min at 1250 rpm.
2.4. SPME analytical procedure
The SPME fibres (PDMS, PDMS/DVB, Car/PDMS and PA 85m) and the SPME holder for manual sampling used in this study were purchased from Supelco (Bellefonte, PA, USA). The fibres were conditioned prior to use according to the manufac-turer’s instructions by inserting them into the GC injector port. Before the first daily analysis the fibres were conditioned for 5 min at 260◦C. A blank test was performed to check possible carry-over.
Standard solutions, must and wine samples were adjusted to pH 3.3 and the ionic strength was increased to improve the extraction efficiency using NaCl (30%). A 4 ml vial contain-ing 2.4 ml of sample (standard, must or wine) was placed in a thermostatic block on a stirrer. The fibre was then exposed to the gaseous phase during the sampling time period (Fig. 4) at temperature of 40±1◦C. As stirring usually improves the
con-Table 1
Validation parameters of the analytical methodology for analysis of monoterpenols and norisoprenoids by HS-SPME using a PA 85m fibre: retention time (RT), Kov´ats retention index, range of concentrations, intercepts (a), slopes (b) and regression coefficients (Aq. Sol.: aqueous solution; EtOH 18%: ethanolic solution at 18% (v/v))
Peak no. Compound RT (min) Kov´ats retention index
Range of concentrations (g l−1)
a b r2
Aq. Sol. EtOH 18%
1 Linalol 46.63 1555 4.4–68.7 −0.0026 0.1562 0.999 0.998
2 ␣-Terpineol 61.29 1704 3.0–18.1 0.2014 0.4111 0.980 0.996
3 Citronellol 69.66 1785 0.3–19.2 0.0095 0.4049 0.996 0.995
4 Nerol 72.05 1819 1.5–14.9 0.0087 0.2859 0.996 0.994
5 -Damascenone 72.60 1830 1.4–10.5 0.0105 0.7678 0.991 0.996
6 Nerylacetone 74.93 1865 0.9–20.8 0.0102 0.4184 0.994 0.995
7 ␣-Ionone 75.66 1868 0.8–12.4 0.0046 0.9139 0.999 0.996
8 Geraniol 77.98 1871 1.4–17.0 0.0052 0.4211 0.997 0.988
9 -Ionone 84.32 1936 1.9–15.1 0.0142 1.1298 0.996 0.985
10 Nerolidol 92.15 2205 2.4–20.5 0.0747 0.3500 0.977 0.992
stant stirring velocity (1250 rpm). After extraction, the SPME fibre was withdrawn into the needle, removed from the vial and inserted into the hot injector port (260◦C) of the GC–MS
sys-tem where the extracted chemicals were desorbed thermally and transferred directly to the analytical column.
The SPME extraction yield was determined as the ratio between the extracted amount (calculated from calibration curves of standards) and the initial concentration of the stan-dards. All standards and samples were analysed in triplicate.
2.5. Chromatographic conditions
The must and wine extracts were analysed by GC–MS using a Varian STAR 3400Cx series II gas chromatograph, equipped with a 30 m×0.25 mm i.d., with a 0.25m film thickness, Stabilwax fused silica capillary column, connected to a Var-ian Saturn III mass selective detector, according to the method described by Cˆamara et al.[45]. Splitless injections were used. The initial oven temperature was set to 40◦C for 1 min. The
tem-perature was increased in three steps: 40–120◦C at 1◦min−1; 120–180◦C at 1.7◦min−1and 180–220◦C at 25◦min−1. Each step was preceded by a small period at constant temperature of 2, 1 and 10 min, respectively. The injector temperature was 250◦C and the transfer line was held at 220◦C. The
detec-tion was performed by a Saturn III mass spectrometer in the EI mode (ionisation energy, 70 eV; source temperature, 180◦C).
The acquisition was made in scanning mode (mass range 30–300 m/z; 1.9 spectra/s). A solvent delay time of 3 min was used to avoid overloading the mass spectrometer with ethanol. For iden-tification of the wine flavour compounds a solution ofn-alkanes (n-octane-n-hexadecane) was injected in the GC–MS system after desorption of an SPME extract of wine, and the analysis was performed using the same instrumental conditions. This allows calculate the Kov´ats retention indexes for each compound and compare with the literature in order to ensure the correct identi-fication of the compounds (Table 1). Comparison with retention times and mass spectra obtained from the sample with those from the pure standards injected under the same conditions were also used (Fig. 1).
2.6. Method development
In order to optimise the analytical method developed, several SPME factors influencing the equilibrium: fibre coating, extrac-tion time and temperature, pH, ionic strength, ethanol content, desorption time and temperature, were previously studied before validating the analytical methodology. Experiments were carried out with aqueous solutions and hydro alcoholic solution (18%, v/v) buffered at pH 3.3 with tartaric acid (5 g l−1) and spiked with a known amount of each compound (three times diluted than global solution). Octan-3-ol was used as internal standard at a concentration level of 0.422g l−1. After select the better conditions for HS-SPME analysis the method was validated by studying the range of linearity, limits of detection and quantifi-cation and accuracy. The analyses of variance (ANOVA) was used for evaluate the occurrence of statistically significant dif-ferences.
2.7. Method validation
Synthetic solutions containing known amounts of terpenoid compounds were extracted and analysed by the proposed proce-dure. The range of concentrations of compounds studied is given inTable 1. The HS-SPME extraction was performed in triplicate. The relative area was plotted against the relative concentration. The linear model is adjusted by the least-squares method.
The repeatability is determined by six replicates analysis of the wines by the proposed method. For each assay the aver-age values and the relative standard deviation (R.S.D.) were calculated. To evaluate the recovery percent of the analytical methodology, a wine sample fortified with known amounts of the terpenoid compounds (two levels) were extracted and anal-ysed by the proposed procedure.
Fig. 1. Total ion chromatogram of a standard ethanolic solution at 18% (v/v) of monoterpenols and C13norisoprenoids extracted using a PA 85m fibre in the dynamic headspace sampling mode. The sample volume was 2.4 ml (vial 4 ml) containing 30% of NaCl. The SPME sampling time: 120 min; sampling temperature: 40◦C; desorption temperature: 260◦C; desorption time: 5 min (for peak identification seeTable 1).
on the linear calibration curve. The limit of quantification (LOQ) can also be estimated as the concentration of analyte producing a signal 10 times that of the noise.
2.8. Quantification
For quantification of terpenoid compounds “synthetic wines” containing known amounts of these compounds, were extracted and analysed by the proposed procedure. The results were used for the construction of calibration graphs. However, considering the effect of ethanol content in the extraction yield, for terpenoid must samples quantification were used calibration graphs with the standards in aqueous solution (pH 3.3; 30% NaCl) and for ter-penoid wine samples quantification were used calibration graphs with the standards in hydro alcoholic solution (18%, v/v; pH 3.3; 30% NaCl).
3. Results and discussion
3.1. Method development
3.1.1. Selection of SPME fibre
Four commercially available SPME fibres differing in the solvent phase coating were tested and compared in this study to determine which fibre most effectively extracted the terpenoid compounds [100m poly(dimethylsiloxane) (PDMS), 65m poly(dimethylsiloxane)-divinylbenzene (PDMS/DVB), 75m carboxene-poly(dimethylsiloxane) (Car/PDMS) and 85m poly(acrylate) (PA 85m)]. The results of the fibre compari-son study are shown inFig. 2.
PDMS, PDMS-DVB and Car-PDMS fibres were inefficient for the most of the terpenoid compounds under study, which
showed a relatively lower extraction efficiency than the PA 85m coated fibre.
As shown inFig. 2, the most suitable fibre for the extraction of the studied compounds was the PA 85m coated fibre that extract all the analytes with good efficiency. Thus, the PA 85m coated fibre was chosen for further optimisation and validation studies.
3.1.2. Effect of extraction temperature
In order to find the best temperature for extracting the ter-penoid compounds, the effect of this parameter in the extraction of the analytes was checked.Fig. 3reports the results obtained with three experiments with salt saturated standard solution of terpenoid compounds to compare the effect of three distinct tem-perature: 28, 40 and 60◦C, in the extraction yield. The best
results were obtained for an extraction temperature of 40◦C.
Fig. 2. Comparison of the extraction efficiency of terpenoid compounds in water solution by HS-SPME with different fibres. The sample volume was 2.4 ml (vial 4 ml) containing 30% of NaCl. The SPME sampling time: 60 min; sampling temperature: 40◦C; desorption temperature: 260◦C; desorption time: 5 min
Fig. 3. Influence of temperature of extraction on the relative amount of the analytes studied. The sample volume was 2.4 ml (vial 4 ml) containing 30% of NaCl. The SPME sampling time: 60 min; desorption temperature: 260◦C;
desorption time: 5 min (Ac/Ais: ratio of compound area−Ac/area of internal standard−Ais) (relative standard deviation range between 2.8% (linalool at 60◦C) and 10.8% (citronellol at 28◦C)).
High temperatures could lead to the formation of artefacts caused by degradation. All the extractions were carried out in triplicate. The temperature effect is not the same for all the compounds under study. High temperatures are supposed to release more analytes into the headspace, allowing better extraction during the increase with increasing temperature due to the enhanced mass transfer (kinetics). However they can adversely affect the absorption of analytes by the coating due the thermodynamic reasons (decrease of partition coefficients) and the extraction by the fibre coating decreases as the temperature rises.
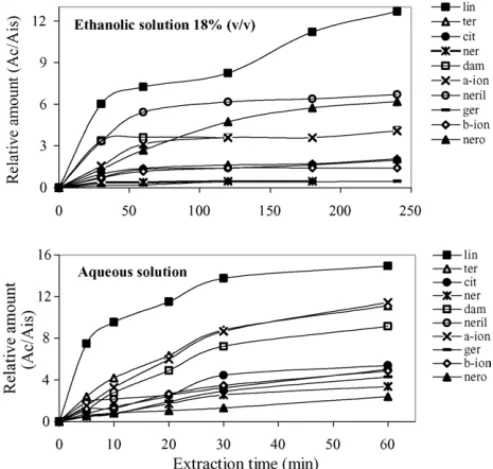
3.1.3. Extraction-time profile
As the diffusion of the analytes through the three system phases is essential in HS-SPME technique, the effect of the time in the extraction of the analytes was optimised for aqueous and hydro alcoholic (18%, v/v) standard solution. The optimal time for extraction should be the time of equilibrium since the mech-anism of SPME is based on the equilibrium between analyte and the polymeric phase of the fibre.
Different extraction times—from 5 to 360 min, were exam-ined and compared at optimum temperature (40◦C) using the PA
85m fibres in the headspace-sampling mode.Fig. 4shows the influence of the time in the extraction of terpenols by PA-85m fibre.
It is apparent that the extraction time profile depends on the individual analyte. Results showed that some compounds reached the equilibrium extraction between 30 and 40 min while others increase continuously in all the time considered. Although in principle it is desirable to continue extraction until equilib-rium is achieved, in routine analysis there is often insufficient time to do so. Based on the curves fromFig. 4, and considering a compromise between the duration of the analysis and the time of the extraction, an extraction time of 60 min for must and 120 min for wine samples was selected for subsequent analysis, because this provides sufficient extraction (>80%) of the analytes. After these time the extraction was not significantly improved.
3.1.4. Effects of salt concentration
The suitability of the headspace SPME technique for the extraction compounds depends on the transfer of the analyte
Fig. 4. Extraction time profiles for the compounds under study by dynamic headspace SPME using the PA 85m fibre. The SPME sampling temperature: 40◦C; desorption temperature: 260◦C; desorption time: 5 min.
from sample to the gaseous phase and therefore to the fibre. This process can be optimised by the increase of the ionic strength. Sodium chloride amounts of 0, 10, 20, 30 and 40% (w/v) were tested.Fig. 5shows the salt effect on the HS-SPME absorption for the compounds investigated in these study.
The maximum extraction yields for individual terpenoid com-pounds were observed at different salt concentration. Primary it was observed that the chromatographic signal increased as the amount of NaCl increase, reaching a maximum value and then decrease with further increase in salt concentration. Initially the analyte recovery is enhanced due to “salting-out” effect whereby water molecules form hydration spheres around the ionic salts molecules that reduce the concentration of water available to dissolve analyte molecules. This behaviour is felt especially for analytes with low hydrophobicity. By other hand the polar molecules may participate in electrostatic interactions with the salt ions in solution, thereby reducing their ability to move into
Fig. 5. Effect of salt (NaCl) concentration on the extraction efficiency of flavour compounds in study in 18% ethanol solution, by dynamic headspace SPME using a PA 85m fibre. The sample volume: 2.4 ml (vial 4 ml); the SPME sampling temperature: 40◦C; the SPME sampling time: 120 min; the desorption
temperature: 260◦C; and the desorption time: 5 min (relative standard deviation
Fig. 6. Effect of pH on the extraction yield. The SPME sampling temperature: 40◦C; the SPME sampling time: 120 min; the desorption temperature: 260◦C;
and the desorption time: 5 min (standard deviation ranging between 0.05 (-damascenone at pH 1.2) and 0.6 (linalool at pH 3.9)).
the fibre coating. Finally, 30% of NaCl was added to all standards and samples in further experiments.
3.1.5. Effect of pH
A strong dependence of the extraction yield on the pH value is observed for the acidic and basic compounds. Such compounds may only be extracted quantitatively by SPME if they are present in the neutral form. The pH of the extraction mixture is par-ticularly important for compounds possessing a pH dependent dissociable group. It is only the undissociated form that will be extracted by an absorptive type of fibre coating, like PA 85m. To study the effect of pH on the extraction yield by SPME were prepared standard solutions of terpenoids at different pH values: 1.2, 2.7, 3.9 and 5.9.Fig. 6shows the results obtained.
The results of ANOVA shows that there is no statistically significant differences for the different pH values studied, then all the experiments are performed with pH value (3.3–3.4) of real must and wine samples.
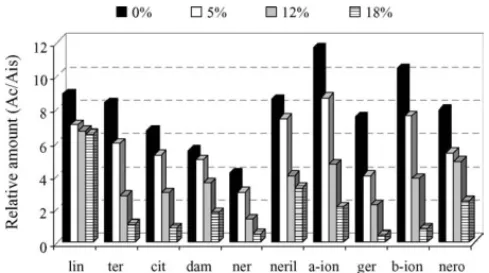
3.1.6. Effect of ethanol content
Because ethanol is one of the major constituents of wines, it will be taken into account for the other compounds extractability. Previous results in the literature describe the influence of the ethanol content on the efficiency of the SPME method[46].
For studying the possible effect of ethanol content on headspace SPME, solutions from three extractions were anal-ysed for each of the four synthetic matrices with different ethanol contents (0, 5, 12 and 18%, v/v).Fig. 7shows that a consistent decrease in the extraction yield was observed with increasing ethanol content for all the terpenoids studied. This decrease is greater for the most polar compounds—nerolidol,-ionone, geraniol and␣-ionone. For linalool and-terpineol the extrac-tion yield is slightly influenced by the ethanol content.
This conclusion reveals the necessity of taking into account the percentage of ethanol in each wine analysed, in order to obtain the calibration curve with standards at the same ethanol content or correct the response for each compound studied.
3.1.7. Desorption temperature and time
The goal of optimising desorption process is typically to elim-inate carryover and improve peak shape. A desorption time and
Fig. 7. Effect of the ethanol content in the efficiency extraction of flavour com-pounds by dynamic headspace SPME. The sample volume: 2.4 ml (vial 4 ml); the SPME sampling temperature: 40◦C; the SPME sampling time: 120 min;
the desorption temperature: 260◦C; and the desorption time: 5 min (standard
deviation range between 0.2 (nerol) and 1.2 (-ionone)).
temperature are selected such that any analyte remaining on the fibre after desorption will not cause variance in the results outside of normal method precision. The required desorption temperature may be close to the temperature of tolerance of the fibre coating, which may shorten the life of the fibre. Preliminary experiments showed that complete desorption was achieved for all the extracted analytes after 6 min of desorption at a temper-ature of 260◦C.
3.2. Validation of the analytical method
Having studied the optimised extraction parameters, calibra-tion graphs using the internal standard method were built and the limits of detection and quantification of the method were esti-mated. All the experiments were carried out using the following analytical conditions: PA 85m fibre with an extraction time of 60 min for musts and 120 min for wine samples, an extrac-tion temperature of 40◦C, a sample volume of 2.4 ml with a salt
content of 30% and a constant stirring (1250 rpm). The analytes were desorbed for 6 min at 260◦C.
3.2.1. Linearity and detection limits
Three replicates of five standard solutions [water solution and 18% (v/v) ethanol–water solution saturated with NaCl and pH adjusted at 3.3] in the range shown inTable 1, all of then with a content of internal standard of 0.422g l−1, were analysed. The mean values were used to construct the calibration graphs by plotting the peak area ratio against the standard concentration. Regression, slope and origin intercept (Table 1) were calculated by linear least-squares regression. Since the inverse of the slope is a measure of the response factor (RF) for each compound, the RF values for␣-ionone and-ionone are very low contrary to linalool and nerol.
Table 2
Limits of detection (LOD), limits of quantification (LOQ) and relative standard deviations (R.S.D.), of the analytical methodology developed (Aq. Sol.: aqueous solution, pH = 3.3 and 30% NaCl; EtOH 18%: ethanolic solution at 18% (v/v), pH = 3.3 and 30% NaCl)
Terpenoids LOD (g l−1) LOQ (g l−1) R.S.D. (%)
Aq. Sol. EtOH 18% Aq. Sol. EtOH 18% Aq. Sol. EtOH 18%
Linalool 2.02 3.02 3.62 10.06 5.09 5.61
␣-Terpineol 2.95 2.89 4.52 9.62 7.19 6.49
Citronellol 0.13 1.61 0.27 5.36 2.52 4.78
Nerol 1.23 1.57 2.41 5.22 9.19 13.68
-Damascenone 0.84 0.42 1.23 1.41 8.50 12.09
Nerylacetone 0.41 2.68 1.07 8.94 9.61 5.94
␣-Ionone 0.42 2.02 1.41 6.75 11.78 5.58
Geraniol 1.47 1.45 2.42 4.86 11.74 6.37
-Ionone 1.34 2.16 2.03 7.20 8.47 14.10
Nerolidol 1.44 1.45 3.17 4.83 14.39 14.20
The calculated LOD were found to be 0.13–2.95g l−1for aqueous solutions and 0.42–3.02g l−1 for hydro alcoholic solution (18%, v/v).Table 2shows the estimated values of LOD and LOQ calculated under the described conditions. These are low enough to determine terpenoid compounds in real samples.
3.2.2. Precision
Under the conditions described above the intermediate pre-cision, expressed by the relative standard deviation (R.S.D.) obtained on six independent analysis of the terpenoid standard solution range between 14.4% for nerolidol and 2.5% for cit-ronellol (Table 2). For the 18% water–ethanol solution (pH 3.3 and 30% of NaCl) the estimated values are similar 14.2% for nerolidol and 4.9% for citronellol.
For sample must the repeatability was 4.8% on average calcu-lated from six replicates. The maximum values were near 10% for geraniol and the minimum was 0.4% for nerylcetone. For wine samples the repeatability was 8.3% on average with a max-imum value of 22.2% for citronellol and the minmax-imum of 2.0% for nerolidol. The results are presented inTable 3.
3.2.3. Accuracy
The recovery of the overall method was tested with a must and wine samples fortified with the analytes at two different levels
(lower and higher concentration of the calibration graphs). Three samples of each were prepared and extracted according to the method described before.Table 3shows the results for recoveries of each analyte. For must samples as can be seen, with exception of␣-terpineol (43.2%) and-ionone (11.1%), the results shows a very good recovery (71.9–117.9%) with a standard deviation less than 5%. Wine samples, besides the higher standard devi-ation when compared with musts, also showed good recovery (74.7–124.4%) except for nerolidol and nerol that have a recov-ery of 31.5 and 49.6%, respectively.
Based on this data, the must and the wine matrices seem to have an effect on the headspace SPME procedure for the compounds studied. This problem can be reduced by using a standard addition calibration method or isotopically labelled internal standards.
3.3. Application to real samples—must and Madeira wines
After validation the analytical method was applied to a thirty six samples of must and the corresponding monovarietal wines from Boal, Malvazia, Sercial and Verdelho varieties to determine the terpenoid content. Each samples was analysed in triplicate. Both, identification by Kov´ats index and by mass spectrum of pure standards were used to identify the terpenoids in real
sam-Table 3
Average (n= 6) recoveries (%) of terpenoid compounds in must and Madeira wine samples at two different levels
Terpenoids Level 1 Level 2
Must Wine Must Wine
Added (g l−1)
Recovery (%)±R.S.D. (%)
Added (g l−1)
Recovery (%)±R.S.D. (%)
Added (g l−1)
Recovery (%)±R.S.D. (%)
Added (g l−1)
Recovery (%)±R.S.D. (%)
Linalol 8.6 86.4±4.0 34.4 99.8±14.5 43.0 89.5±3.7 68.7 93.6±9.5
␣-Terpineol 4.6 43.2±5.4 9.0 90.8±7.7 23.0 48.4±6.3 18.1 94.8±5.7
Citronellol 1.2 105.5±4.1 6.6 102.5±22.2 6.0 100.5±4.9 19.2 97.5±14.2
Nerol 1.9 71.9±2.0 7.5 49.6±3.1 9.5 76.9±4.3 14.1 53.6±10.6
-Damascenone 0.9 117.9±2.9 7.0 124.4±4.7 4.5 108.9±5.9 10.5 115.1±6.7
Nerylacetone 3.5 76.6±1.9 9.9 89.9±5.1 17.5 73.4±3.8 20.8 92.9±7.1
␣-Ionone 1.6 106.7±3.4 8.2 115.9±6.5 8.0 98.7±6.2 12.4 105.9±9.2
Geraniol 2.9 98.5±8.7 5.5 81.4±2.6 14.5 94.7±5.7 17.0 76.4±5.6
-Ionone 3.8 11.1±4.6 7.6 74.7±4.6 19.0 13.1±6.7 15.1 80.7±7.9
Table 4
Average (n= 3) concentrations (g l−1) of dominating terpenoids found in musts of grape varieties under study determined by the developed method: HS-SPME using PA 85m fibre (sample volume: 2.4 ml (vial 4 ml); SPME sampling temperature: 40◦C; SPME sampling time: 60 min; desorption temperature: 260◦C; desorption
time: 5 min)
Terpenoids Boal Malvazia Sercial Verdelho
Mean R.S.D. % Mean R.S.D. % Mean R.S.D. % Mean R.S.D. %
Linalol 4.2 7.7 34.3 9.0 8.1 12.3 23.8 9.4
␣-Terpinol 4.9 7.8 19.6 5.3 13.4 4.3 7.5 5.8
Citronellol 0.5 11.9 0.3 7.6 0.8 10.4 0.5 6.1
Nerol 3.8 5.7 2.9 3.1 1.3 11.9 3.8 3.3
-Damascenone 3.1 15.5 9.2 6.2 5.1 13.5 1.7 10.7
Geraniol 2.9 15.2 4.7 10.9 6.4 10.7 2.7 11.5
-Ionone 4.4 5.3 2.1 5.2 8.3 7.6 4.7 8.7
Nerolidol 53.1 8.4 37.4 11.8 21.0 5.8 16.2 10.2
ples. The compounds quantified were chosen because they can be used for variety characterisation.
The average values for the free terpenoids determined in Boal, Malvazia, Sercial and Verdelho must and wine samples studied, from 2000 harvest, is shown inTable 4. The composition of free terpenoid fraction was different in the varieties studied.
For the year of study, the dominating terpenoids found in the analysed wines were linalool,␣-terpineol and-damascenone. These compounds contribute to the flowery and pleasant, citrus and tropical fruit odours, respectively, of wines.
Wines derived from Malvazia grapes present the highest lev-els of terpenoids mainly due to the content of␣-terpineol and linalool, however these compounds are present at levels lower than its perception threshold. Contrary, Verdelho wines present the lowest concentrations of the free monoterpenols.
4. Conclusions
HS-SPME-GC–MS methodology was found to be fully suit-able for the analysis of free monoterpenols and C13 noriso-prenoids (terpenoids) in musts and wines, due to its selectiv-ity and sensitivselectiv-ity. An optimised methodology was developed, which was based on 85m PA fibre, headspace sampling mode and an extraction time of 60 min for musts and 120 min for wines at 40◦C. The presence of electrolyte in the absorption system
can changing the properties of the phase boundary and decreas-ing the solubility of the hydrophobic compounds in the aqueous phase increasing the sensitivity of the analytical method.
The quantification method used calibration curves obtained from standards extracted in the same experimental conditions as the samples, in order to account for the different extrac-tion yields. The headspace method, in conjugaextrac-tion with GC–MS analysis, provides a high recovery, good linearity over a wide range of concentration and high sensitivity. Moreover, by opti-mising sampling methods, it was possible to obtain representa-tive and reproducible HS-SPME extracts. Using only 2.4 ml of sample, detection limits obtained are in lowg l−1range for all compounds examined in this study. This method offers a num-ber of practical advantages: smaller sample volume, simplicity of extraction and low cost, when compared to other methods currently in use.
All these characteristics make the method useful for wine quality control, and to give information, which could be used, in the wine classification, in the control of wine origin and in winemaking processes.
Acknowledgments
We gratefully acknowledge to Instituto do Vinho da Madeira for the supply of wine samples, and PRODEP for financial sup-port.
References
[1] A. Rapp, H. Mandery, Experientia 42 (1986) 873.
[2] S.P. Arrhenius, L. McCloskey, M. Sylvan, J. Agric. Food Chem. 44 (1996) 1085.
[3] P. Schreier, First Symposium in Vino Analytica Scientia; Ecole Europ´eenne de Chimie Analytique, Bordeaux, France, 1997, p. 17, ISBN: 2-912526-00-0 (abstract book).
[4] R. Baumes, R. Cordonnier, S. Nitz, F. Drawert, J. Agric. Food Chem. 37 (1986) 927–934.
[5] A. Rapp, Fresen. J. Anal. Chem. 337 (1978) 777.
[6] K. Wada, T. Shibamoto, J. Agric. Food Chem. 45 (1997) 4362. [7] A. Ferreira, A. Rapp, J. Cacho, H. Hastrich, I. Yavas, J. Agric. Food
Chem. 41 (1993) 1413.
[8] P. Hardy, J. Agric. Food Chem. 17 (1969) 656.
[9] C. Ortega, R. L´opez, J. Cacho, V. Ferreira, J. Chromatogr. A 923 (2001) 205.
[10] V. Ferreira, R. L´opez, A. Escudero, J. Cacho, Chromatogr. A 806 (1998) 349.
[11] J.M. Nu˜nez, H. Bemelmans, J. Chromatogr. 294 (1984) 361.
[12] R. L´opez, M. Aznar, J. Cacho, V. Ferreira, J. Chromatogr. A 966 (2002) 166.
[13] Y. Zhow, R. Riesen, C.S. Gilpin, J. Agric. Food Chem. 44 (1996) 818. [14] S. Voirin, R. Baumes, J.C. Sapis, C. Bayonnove, J. Chromatogr. 595
(1992) 269.
[15] Z. Gunata, C. Bayonnove, R. Baumes, R. Cordonnier, J. Chromatogr. 331 (1985) 83.
[16] P. Williams, C. Staruss, B. Wilson, R. Massy-Westropp, J. Chromatogr. 235 (1982) 471.
[17] G.P. Blanch, G. Reglero, M. Herraiz, J. Agric. Food Chem. 43 (1995) 1251.
[18] A. Razungles, H. Tarhi, R. Baumes, C. Gunata, C. Tapiero, C. Bayon-nove, Sci. Alimments 14 (1994) 725.
[22] C. Arthur, L. Killam, K. Buchholz, J. Pawlizyn, J. Berg, Anal. Chem. 64 (1992) 1960.
[23] D. De la Calle Garcia, S. Magnaghi, M. Reichenbacher, K. Danzer, J. High Resolut. Chromatogr. 19 (1996) 257.
[24] S.E. Ebeler, M.B. Terrien, C.E. Butzke, J. Sci. Food Chem. 80 (2000) 625.
[25] G. V´as, L. G´al, J. Harangi, A. Dob´o, K. V´ekey, J. Chromatogr. Sci. 36 (1998) 737.
[26] Jan C.R. Demyttenaere, C. Dagher, P. Sandra, S. Kallithraka, R. Verh´e, N. De Kimpe, Chromatogr. A 985 (2003) 233.
[27] D. De la Calle Garcia, M. Reichenbacher, K. Danzer, C. Bartzch, K. Feller, J. High Resolut. Chromatogr. 22 (6) (1999) 322.
[28] D. De la Calle Garcia, S. Magnaghi, M. Reichenbacher, K. Danzer, Vitis 37 (1998) 181.
[29] D. De la Calle Garcia, S. Magnaghi, M. Reichenbacher, K. Danzer, J. High Resolut. Chromatogr. 21 (1998) 373.
[30] J.S. Cˆamara, P. Herbert, J.C. Marques, M.A. Alves, Anal. Chimica Acta 513 (2004) 203.
[31] J.J. Rodriguez-Bencomo, J.E. Conde, M.A. Rodriguez-Delgado, F. Garcia-Montelongo, J.P. P´erez-trujillo, J. Chromatogr. A 963 (2002) 213. [32] M. Mestres, C. Sala, O. Busto, J. Guasch, J. Chromatogr. A 835 (1999)
137.
[33] M. Mestres, M.P. Marti, O. Busto, J. Guasch, J. Chromatogr. A 881 (2000) 583.
[34] M. Mestres, O. Busto, J. Guasch, J. Chromatogr. A 945 (2002) 211. [35] A.P. Pollnitz, G.P. Jones, M.A. Sefton, J. Chromatogr. A 857 (1999)
239.
[36] M. Correia, C. Delerue-Matos, A. Alves, J. Chromatogr. A 889 (2000) 59.
[37] C. Sala, M. Mestres, M.P. Marti, O. Busto, J. Guasch, J. Chromatogr. A 953 (2002) 41.
[38] L.M.T.V. Freire, A.M.C. Freitas, A.M. Relva, J. Microcol. Sep. 13 (2001) 236.
[39] E. Marengo, M. Aceto, V. Maurino, J. Chromatogr. A 943 (2002) 123.
[40] M.A. Pozo-Bay´on, E. Pueyo, P.J. Mart´ın- ´Alvarez, M.C. Polo, J. Chro-matogr. A 922 (2001) 267.
[41] J.J. Rodriguez-Bencomo, J.E. Conde, F. Garcia-Montelongo, J.P. P´erez-Trujillo, J. Chromatogr. A 991 (2003) 13.
[42] T. G´orecki, X. Yu, J. Pawliszyn, Analyst 124 (1999) 643.
[43] R.P. Schwarzenbach, P.M. Gschwend, D.M. Imboden, Environmental Organic Chemistry, John Wiley, New York, 1993, p. 225 (Chapter 11). [44] R.I. Masel, Principles of Adsorption and Reaction on Solid Surfaces,
John Wiley, New York, 1996.
[45] J.S. Cˆamara, A.M. Alves, J.C. Marques, Adv. Mass Spectrom. 15 (2001) 943.