Engineering
ISSN: 1809-4430 (on-line)
_________________________
1 Federal University of Santa Maria (UFMS), Campus of Cachoeira do Sul (CS) /Cachoeira do Sul-RS, Brazil. 2 Federal University of Viçosa (UFV)/Viçosa-MG, Brazil.
3 Federal University of Sergipe (UFS)/São Cristóvão-SE, Brazil.
4 Rural Federal University of Pernambuco (UFRPE), Academic Unit of Garanhuns/Garanhuns-PE, Brazil. *Corresponding author. E-mail: [email protected]
COMPUTATIONAL FLUID DYNAMICS (CFD) SIMULATING HEATED AIR FROM WOOD BURNING INSIDE A POULTRIES BARN
Doi:http://dx.doi.org/10.1590/1809-4430-Eng.Agric.v36n5p768-778/2016
PAULO C. CORADI1*, MÁRCIO A. MARTINS2, DOUGLAS R. DA COSTA3,
RICARDO B. VIGODERIS4, ILDA DE F. F. TINÔCO2
ABSTRACT: Animal welfare is essential for livestock yield gains, which has been ethically justifiable and socially acceptable. Thus, our research aimed to test computational fluid dynamics model (CFD) to simulate heated air within a poultry barn. Data were simulated in CFD software based on Navier-Stokes equations (geometry of 3 m x 6 m, considering a symmetric mesh). As boundary conditions, a temperature of 38ºC was considered for walls where heating pipe outlets are, to the west side, besides a heat flow of zero, in symmetry to the same side. As for the sides east, south and north, walls were taken as isolated, i.e. heat flow equals to zero. The aviary heating system did not achieve a homogeneous temperature distribution, heat flow, heated air pressure and speed. Heated-air convection cells were spotted in the upper part of the building, being little used for thermal comfort by the birds.
KEY WORDS:environment, animals, thermal comfort, airflow.
INTRODUCTION
Brazilian poultry houses are often built without proper thermal insulation. In addition, heating equipment, traditionally used in initial rearing, such as pancake type heaters and furnaces, are inefficient in terms of energy output, and may not provide an environment full of comfort as needed for birds (VIGODERIS, 2006; ABREU & ABREU, 2011). Heated air distribution into the interior of aviaries usually occurs by thermal convection. OSÓRIO et al. (2012) stated that while selecting a heating system, besides cost, other factors should be considered as thermal power generation ability and produced-air quality, which is set by temperature level and concentration of gases (CO and CO2).
Several heaters have been used in poultry houses, including turbo gas, infrared, high-pressure, low-pressure, firewood furnaces with preheated air, coal and firewood ones without air renewal
Heated-air distribution is influenced by heating system, barn building conditions, air temperature and humidity, facility insulation, ventilation system and stocking density (VIGODERIS, 2006; CARVALHO et al., 2012; OSÓRIO et al., 2012).
In commercial poultry farms, traditional heating systems are regularly composed of pancake heaters and gas furnaces, which have been proved to be flawed for proper brooder heating, mainly in southern Brazil, resulting in temperatures below the comfort range for birds (VIGODERIS, 2006). The temperature bands claimed as comfort zone for broilers vary with animal age, among which a range from 32 to 34ºC is ideal for the first rearing week. In contrast, during the second week, this range drops to 28 and 32ºC (VIGODERIS, 2006; MOURA et al., 2010; JENTZSCH et al., 2013).
aerodynamics, food and environmental aspects, but it may be customized to many others (DAMASCENO et al., 2011; MENDES et al., 2011; OLIVEIRA et al., 2014).
Lately, this tool has been applied in agricultural engineering, for example in validating a prediction model for evaporative cooling on porous walls of animal housing (OSÓRIO et al., 2012), studying gas diffusion within grain storage silos (e.g. O3, CO2) (PAES et al., 2011), as well as studies on pressure, temperature and speed distribution of air and fuel mixture in gas furnaces or burners (DAMASCENO et al., 2011), and others.
Therefore, this study aimed to evaluate the efficiency of a firewood furnace air-heating system through simulation in the CFD device for a poultry house interior.
MATERIAL AND METHODS Experimental area
The experiment was carried out in an integrated commercial poultry farm located in the city of Videira, Santa Catarina state, in Brazil. The city lies at 27º 00’30” S latitude and 51º 09’60” W longitude, within a humid temperate zone of average annual temperature between 16 to 17 ºC, Cfb
type as Köeppen’s classification – temperate (mesothermal humid and mild summer). The broiler facility has an area for rearing 18,500 hens of Cobb strain, with average slaughter weight of up to 1.450 kg, over the two full cycles. Testing was made in July, since it is considered the most severe within Brazilian winter.
Facility characteristics
The barn has as measures: 100 m length, 12 m width, 3 m height, and is covered with polyurethane ceiling on longitudinal axes towards an East-West direction. The roof is composed of clay tiles, with inclination of 30% and eaves of 0.50 m. A 0.3-m masonry wall and yellowish curtains close the building sides.
Indoor air-heating system
Barn internal heating was performed through firewood furnace measuring 1.56 m wide, 2.60 m long and 1.65 m high. Distribution piping was 42.0 m long, distribution air from the shed central part along a longitudinal direction, with two outlet openings spaced every 1 m. Heated air flow was of 42.5 m³ s-1, and temperature of 38 ºC furnace exit (Figure 1).
FIGURE 1. Distribution system of the heated air inside the broiler house.
Environmental variables under control
+1%. These recordings were taken every 15 minutes over three central points of each facility, measured at the birds' height (10 to 30 cm), following their growth.
Computational Fluids Dynamics (CFD)
CFD processed data into three steps: pre-processing, processing (equation solution) and post-processing. In pre-processing, a fluid flow model was designed, which involves defining geometry, meshing, fluid properties, problem type (conduction, flow, flow + conduction) and initial and boundary problem conditions. During processing, equations characterizing the problems were solved. Finally, in post-processing, simulation was viewed through plotted figures (graphs and maps).
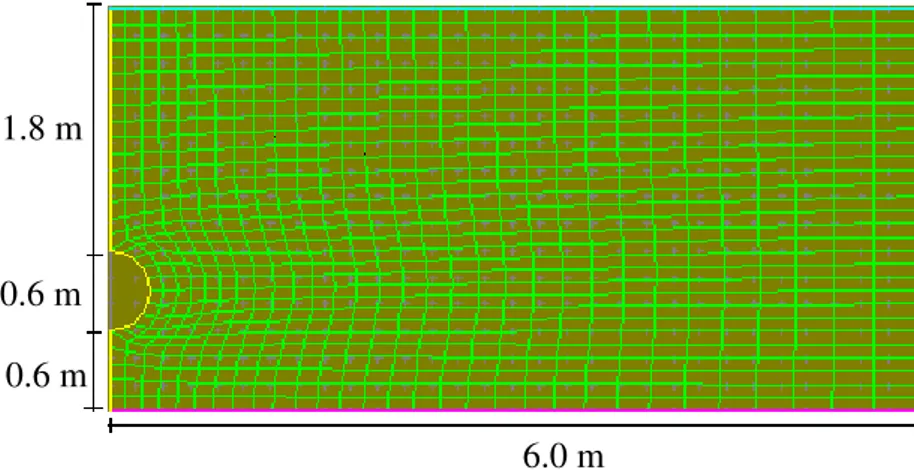
Figure 2 displays the indirect heating system mesh using a firewood furnace for poultry facilities.
FIGURE 2. Symmetric lattice generated by CFD software for simulating the heated air convective system inside broiler house.
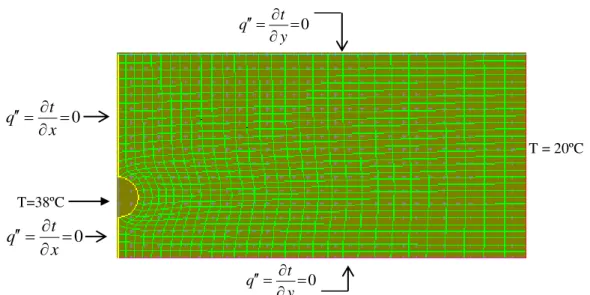
The under study problem was characterized as forced-flow convection of air. Initial environment mean temperature was of 20 ºC, measured by a thermo-hygrograph (TH508, Impact, São Paulo, Brazil). As boundary conditions, a temperature of 38 ºC was assumed, which was also recorded by the thermo-hygrograph from heating pipe outlet wall (western side, Figure 3) with a heat flow of zero, under symmetry conditions. Eastern, southern and northern walls were considered as insulated with heat flow equals to zero.
Given the large dimensions of the system geometry, which interfere with convergence of heating convective cells inside the facility, nondimensionalization became an essential alternative for simulations. To this end, initial temperature (T1) was taken as being of 38 ºC = 1; and final (T2) of 20 ºC = 0, and facility section length (L) = 1.
The following customized physical parameters of air were established for simulations: ρ = 1 kg m-³; c
p = 0.72 J kg-1 ºC-1; k = 0.1 W m-1 ºC-1; μ = 0.1 kg m-1s-1; β = 13.88 1 k-1; q = 0 W m-³; g = 10 m s-².
In which,
ρ: specific weight; cp:specific heat;
k: electrical conductivity; µ: viscosity;
q: heat flow,
β: coefficient of thermal expansion. 0.6 m
0.6 m 1.8 m
The coefficient of volume expansion (β) was estimated as function of the Rayleigh number (Ra,L), through [eq. (1)], given that its convergence happened when (1708 < Ra,L < 5 x 10⁵). Thus, it was adopted (Ra,L) = 104, resulting in β = 13.88 (1/k), enabling convergence and an improved distribution of temperature, pressure, speed, and heat flow.
3 2 1 , L T T g RaL
(1)
In which,
T1:Initial temperature; T2 :Final temperature;
α: Coefficient of thermal diffusivity; L: Section length,
Ra,L:Rayleigh number.
The coefficient of thermal diffusivity was determined by [eq. (2)].
p c k
(2)
Solving convection, at any opening, consists of developing the Navier-Stokes equations, in which thrust forces associated to specific weight variations are responsible for driving fluid. In this study, the following considerations were made to develop the mathematical model:
Flow regime was considered laminar, transient and two-dimensional.
Fluid thermophysic properties were customized, except for coefficient of volume expansion, whose variation is derived from the Rayleigh number.
Viscous dissipation was neglected in the flow and pressure term eliminated from energy equation.
All surfaces of the facility were assumed to be perfectly insulated (VIGODERIS, 2006), except for the heating pipe and the air outlet walls, where heating and cooling temperatures acted, respectively. Equations 3, 4 and 5 feature the flow:
Continuity equation: 0 y v x u (3)
Equation of amount of movement towards x direction:
T T
g iy u x u v x p y u v x u u t
u r
2 2 2 2 1 (4)
Equation of amount of movement towards y direction:
T T
g jy v x v v y p y v v x v u t
v r
2 2 2 2 1 (5) In which,
u: flow speed towards (x),m s-1;
x: coordinate towards horizontal direction, m;
y: coordinate towards vertical direction, m;
p: specific weight, kg m-³;
δ: gradient;
β: coefficient of volume expansion; T: temperature, ºC;
i: unit vector towards (x), j: unit vector towards (y).
Figure 3 shows the convective airflow inside the geometry.
FIGURE 3. Geometry for representation of the convective flow of heated air inside the broiler house.
Equation 6 stands for energy conservation estimation:
2 2 2 2 y x y T v x T u t
T T T
(6)
In which,
α: thermal diffusivity (m² s-1).
Figure 4 displays the heat flow distribution within the geometry.
0 y t q 0 y t q
FIGURE 4. Heat flow distribution inside the geometry.
= 0
u = 0
u = v = 0 u = v = 0
= 0
u = 0
u = v = 0
u = v = 0
0 x t q T=38ºC 0 x t q
RESULTS AND DISCUSSION
Broiler chicks demand a thermal comfortable to enhance their genetic potential; to this end, suitable ranges of temperature and relative humidity should be set for each rearing phase (JENTZSCH et al., 2011). Through Figures 5 and 6, we can see that both the average temperature as air relative humidity varied significantly within the environment for the study period. The highest average temperature and lowest humidity values were recorded between 12 am and 6 pm.
FIGURE 5. Average values of temperature and relative humidity during the period, for the first week of development of broilers.
FIGURE 6. Average values of temperature and relative humidity during the period for the second week of development of poultries.
Furthermore, we could also highlight that minimum values of temperature inside the facility were achieved near 04:30 am, which might have been due to inversion; yet the maximum ones were seen near 1:30 pm. Notwithstanding, we noted that outdoor temperature records were uncomfortable throughout the three weeks of bird life, which pointed us to a need to heat the aviaries.
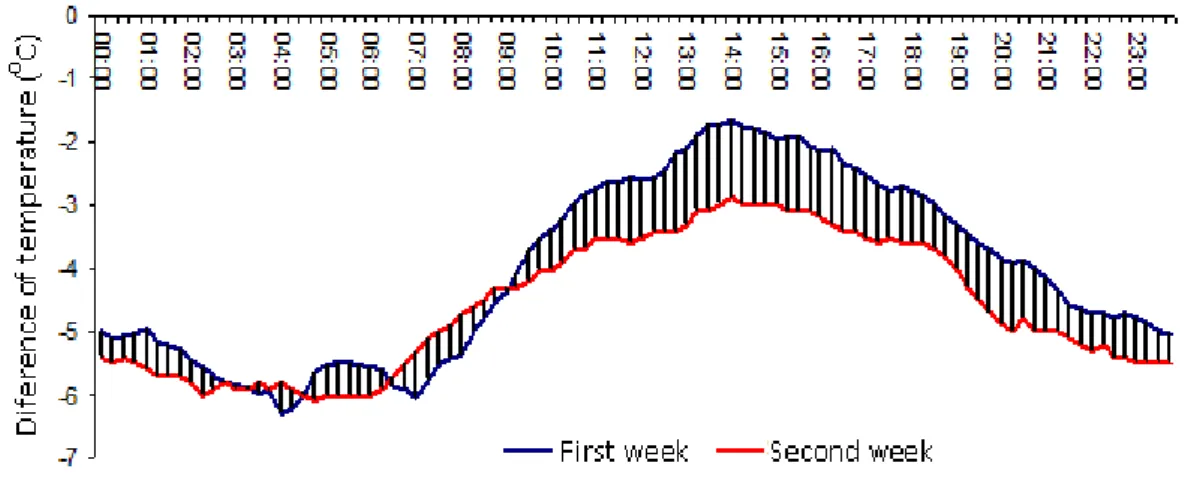
FIGURE 7. Temperature difference (°C) of average values detected in the heated environment in the first two weeks of development of poultries.
We can also highlight that values above zero within the abscissa (Figure 7) denote how long the temperature inside the building was above normal. Moreover, the curves below this axis suggested when the system has not reached an optimum temperature for animal comfort. According CASSUCE et al. (2013), temperature for poultry thermal comfort during the first week of life ranges from 32 to 34 °C, and within the second from 28 to 32 °C. Regarding the relative humidity, the range is between 50 and 70%; yet wind speed goes between 2.29 m and 2.41 m s-1.
Conversely, relative humidity inside the barn remained within the proper range for the birds all the time, showing a slight drop from 69 to 66%, when temperature reached the highest levels during the daytime. These results, however, can be accounted for reductions in ventilation, which, at the same time, renewed air to a satisfactory level without dissipating heat, i.e. without affecting drastically temperature values. These results were observed throughout the entire housing period. Over day, temperature remained under the optimum value for birds, given the levels provided by SOUZA et al. (2011). It is known that environmental factors may cause animal stress; however, effects could be both positive and negative, thus interfering with the performance thereof. It is reported that high temperatures reduce animal food intake, and low ones increase weight gain, yet impair feed conversion (SOUZA et al., 2011; JENTZSCH et al., 2013).
Temperature deficits were higher in the second week 5.5 to -2.0 °C), and lower in the first (-5 to -3 °C). Regarding the period of the day, smaller deficits were recorded between 9 am and 4 pm, when the highest values were registered. It is noteworthy that the temperature amplitude changes between the first and the second week are related to alterations on the thermal comfort zone of the birds, which started to show a comfort range lower than the previous week.
Early studies using CFD in animal facilities were performed by CHOI et al. (1988), in which a simple geometry was used to represent the building; however, the results reached little precision. Small advances in real solutions were made in the following years. HOFF et al. (1992) used this software to model airflow in a rectangular facility, in which heat transfer was modeled using a heated floor. Hereafter, further studies were carried out to validate animal facilities, focusing on providing most accurate CFD models (ZHANG et al., 2000). Only in recent years, there have been developed studies with CFD models to simulate heat and mass transfers throughout a geometric representation, which are applicable in animal production facilities (PAULA et al., 2012; OLIVEIRA et al., 2014). Therefore, when using dynamic models together with estimates provided by CFD, most detailed conditions are achieved for all phenomena occurring therein.
program and aiming to obtain most efficient results for poultry thermal comfort. According to the simulations of temperature, heat flow, air speed, pressure and air stream inside the building, it is notable that the heating system was ineffective mainly for areas in which warming was most required, e.g. near the floor.
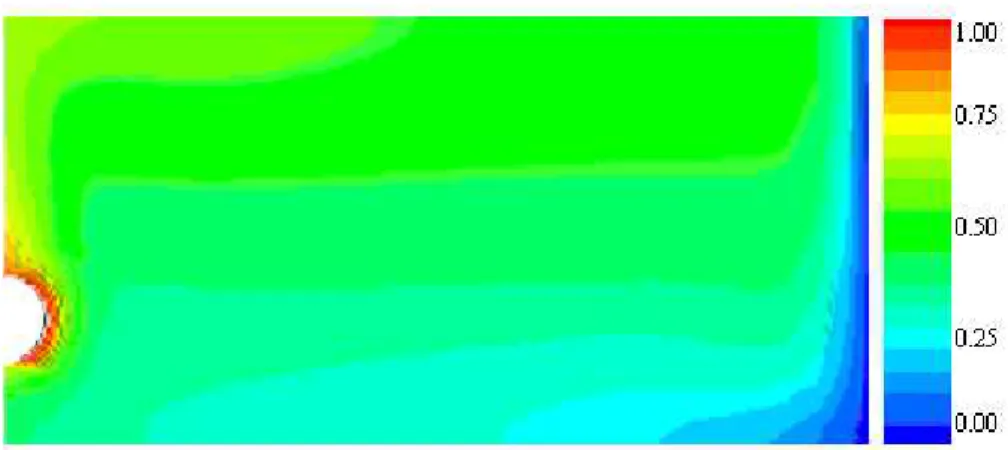
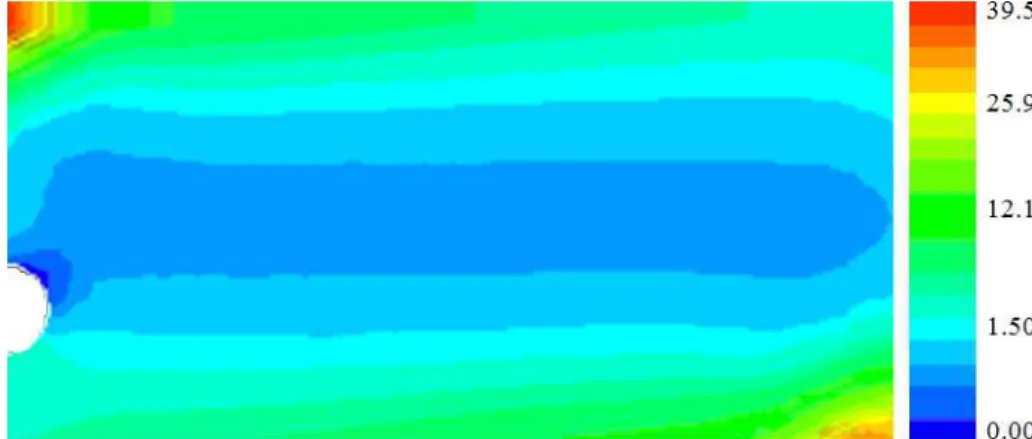
FIGURE 8. Distribution of dimensionless air temperature inside the poultry broiler.
FIGURE 9. Heat flow distribution of the air inside the poultry broiler dimensionless.
FIGURE 11. Distribution of the dimensionless air pressure inside the broiler.
FIGURE 12. Distribution of power lines dimensionless air inside the broiler house.
Among the environmental and thermal variables, air temperature, relative humidity, thermal radiation and air circulation are the ones that directly affect bird performance, since they are homeothermic animals. Environmental variables can have positive or negative effects on poultry production. For instance, high temperature and high relative humidity inside poultry facilities may restrain productivity (VIGODERIS, 2006; YANAGI JUNIOR et al., 2011; OLIVEIRA et al., 2014). Thus, the need to keep the thermal environment within an optimal production range is evident; however, there are few studies using CFD for mass balance in poultry houses. TINÔCO et al. (2010) made simulations of a poultry facility with mechanical ventilation associated to an evaporative cooling system. The authors developed a CFD model to understand the distribution of air temperature and speed. The results of such study showed a good statistical correlation with experimental data, which allowed the authors associating its use to future structural changes, likewise the results of our study.
Temperature and heat flow distributions were irregular, showing layers of different temperature values along the facility geometry. For temperature, we observed that the highest values were measured near symmetrical walls and above the pipes. The lowest temperatures were found to the right walls and bottom side of the building, where virtually there was no convection heating. Part of the heated air was registered between the middle and upper layer of the barn, and the less heated air formed a temperature gradient near the surface of most contact of the birds (Figure 10). The heat flow distribution showed similar result to temperature, i.e. higher values near the walls, forming smaller convective cells within the central part of the building. The same was observed for air speed, pressure and air stream.
CONCLUSIONS
1. Firewood furnace heating provide no homogeneous distribution of temperature, heat flow, pressure and heated-air speed inside the tested poultry facility.
2. Heat convection cells are located in the upper part of the facility, being little exploited for poultries thermal comfort.
REFERENCES
ABREU, V.M.N.; ABREU, P.G. Os desafios da ambiência sobre os sistemas de aves no Brasil.
Revista Brasileira de Zootecnia, Viçosa, MG, v.40, p.1-14, 2011.
CARVALHO, T.M.R.; MOURA, D.J.; SOUZA, Z.M.; BUENO, L.G.F.; LIMA, K.A. Use of geostatistics on broiler production for evaluation of different minimum ventilation systems during brooding phase. Revista Brasileira de Zootecnia, Viçosa, MG, v.41, n.1, p.194-202, 2012. CASSUCE, D.C.; TINOCO, I.F.F.; BAÊTA, F.C.; ZOLNIER, S.; CECON, P.R.; VIEIRA, M.F.F.A. Thermal comfort temperature update for broiler chickens up to 21 days of age. Revista Engenharia Agrícola, Jaboticabal, v.33, n.1, p.28-36, 2013.
CHOI, K.; ALBRIGHT, L.D.; TIMMONS, M.B. An application of the k-ε turbulence model to
predict air distribution in a slot ventilated enclosure. Transactions of the ASAE, St. Joseph, v.31, p.1804-1814, 1988.
DAMASCENO, F.A.; BAÊTA, F.C.; MARTINS, M.A.; OSÓRIO, J.A.; TINOCO, I.F.F. Computational fluid dynamics (CFD) and it´s use for analysis gas distribution inside animal production facilities: a literature review. Revista U.D.C.A Atualidade y Divulgacíon Científica, Bogotá, v.14, p.83-93, 2011.
HOFF, S.J.; JANNNI, K.A.; JACOBSON, L.D. Three-dimensional buoyant turbulent flows in a scaled model, slot-ventilated, livestock confinement facility. Transactions of the ASAE, St. Joseph, v.35, n.2, p.671-686, 1992.
JENTZSCH, R.; BAÊTA, F.C.; TINOCO, I.F.F.; DAMASCENO, F.A.; CECON, P.R.; TIBIRIÇÁ, A.C.G. Predição de parâmetros térmicos ambientais no interior de modelos físicos de galpões avícolas construídos em escalas reduzidas. Interciência, Caracas, v.36, p.1-5, 2011.
JENTZSCH, R.; BAÊTA, F.C.; TINOCO, I.F.F; DAMASCENO, F.A.; OSÓRIO, J.A. Parâmetros arquitetônico-ambientais para construção e testes em modelos reduzidos, representativos de galpões avícolas, com base em similitude. Engenharia na Agricultura, Viçosa, MG, v.21, p.19-30, 2013. MENDES, A.S.; PAIXÃO, S.J.; RESTELATTO, R.; POSSENTI, J.C.; MOURA, D.J.; MORELLO, G.M.; CARVALHO, T.M.R. Effects of initial body weight and litter material on broiler production.
Revista Brasileira de Ciência Avícola / Brazilian Journal of Poultry Science, Campinas, v.13, n.1, p.165-170, 2011.
MOURA, D.J.; BUENO, L.G.F.; LIMA, K.A.O.; CARVALHO, T.M.R.; MAIA, A.P.A. Strategies and facilities in order to improve animal welfare. Revista Brasileira de Zootecnia, Viçosa, MG, v.39, n.1, p.311-316, 2010.
OLIVEIRA, C.E.G.; MARTIN, S.; ZANATTA, F.L.; RIBEIRO, A.C.F.; DAMASCENO, F.A. Características arquitetônicas e tecnológicas de galpões para criação de frangos de corte no Distrito Federal. Engenharia na Agricultura, Viçosa, MG, v.22, p.162-171, 2014.
OSÓRIO, J.A.; TINÔCO, I.F.F.; ROCHA, K.S.O.; MARTINS, M.A.; DAMASCENO, F.A.
Validation of a CFD model for prediction of the efficiency of evaporative cooling in porous panels.
PAULA, M.O.; CAETANO, S.P.; MOREIRA, G.R.; AMORIM, M.M.; DURAN, M.C. Identificação da tipologia construtiva de galpões avícolas no estado do Espírito Santo.
Enciclopédia Bioesfera, Goiânia, v.8, n.14, p.641-653, 2012.
SOUZA, M.G.; OLIVEIRA, R.F.M.; DONZELE, J.L.; MAIA, A.P.A.; BALBINO, E.M.; OLIVEIRA, W.P. Utilização das vitaminas C e E em rações para frangos de corte mantidos em ambiente de alta temperatura. Revista Brasileira de Zootecnia, Viçosa, MG, v.40, n.10, 2011.
TINÔCO, I.F.F.; OSORIO, J.A.S.; GATES, R.S.; DAMASCENO, F.A.; MARIN, O.L. Z. 3D-CFD
modeling of a typical uninsulated and internal misting tunnel ventilated Brazilian poultry house. St. Joseph: ASAE, 2010. p.35-42. (ASAE Paper).
VIGODERIS, R.B. Sistemas de aquecimento de aviários e seus efeitos no conforto térmico
ambiental, qualidade do ar e performance animal, em condições de inverno, na região Sul do Brasil. 2006. 104p. Tese (Doutorado) – Universidade Federal de Viçosa, Viçosa, 2006.
YANAGI JUNIOR, T.; SILVA, E.; BRAGA JUNIOR, R.A.; DAMASCENO, F.A. ; LOPES, M. A.; SILVA, G.C.A.E. Digital surface area assessment of broiler chickens. Engenharia Agrícola,
Jaboticabal,v.31, n.3, p.468-476, 2011.