Gene expression profile during coffee fruit development and
identification of candidate markers for phenological stages
Cristiana de Gaspari‑Pezzopane(1), Nemailla Bonturi(2), Oliveiro Guerreiro Filho(2),
José Laércio Favarin(1) and Mirian Perez Maluf(3)
(1)Universidade de São Paulo, Escola Superior de Agricultura Luiz de Queiroz, Departamento de Produção Vegetal, Avenida Pádua Dias, no 11, CEP 13480‑900 Piracicaba, SP, Brazil. E‑mail: [email protected], [email protected] (2)Instituto Agronômico, Centro de Café Alcides Carvalho, Avenida Barão de Itapura, no 1.481, Caixa Postal 28, CEP 13012‑970 Campinas, SP, Brazil. E‑mail: [email protected], [email protected] (3)Embrapa Café, Centro de Café Alcides Carvalho, Avenida Barão de Itapura, no 1.481, Caixa Postal 28, CEP 13012‑970 Campinas, SP, Brazil. E‑mail: [email protected]
Abstract – The objective of this work was to identify genes that could be used as suitable markers for molecular recognition of phenological stages during coffee (Coffea arabica) fruit development. Four cultivars were evaluated as to their differential expression of genes associated to fruit development and maturation processes. Gene expression was characterized by both semi‑quantitative and quantitative RT‑PCR, in fruit harvested at seven different developmental stages, during three different seasons. No size polymorphisms or differential expression were observed among the cultivars for the evaluated genes; however, distinct expression profiles along fruit development were determined for each gene. Four out of the 28 evaluated genes exhibited a regular expression profile in all cultivars and harvest seasons, and, therefore, they were validated as candidate phenological markers of coffee fruit. The gene α‑galactosidase can be used as a marker of green stage, caffeine synthase as a marker of transition to green and yellowish‑green stages, and isocitrate lyase and ethylene receptor 3 as markers of late maturation.
Index terms: Coffea arabica, cup quality, differential expression, fruit phenology, ripening, qRT‑PCR.
Perfil da expressão gênica durante o desenvolvimento de frutos de café
e identificação de genes marcadores para fases fenológicas
Resumo – O objetivo deste trabalho foi identificar genes que possam ser utilizados como marcadores moleculares para reconhecimento de fases fenológicas, durante o desenvolvimento de frutos do cafeeiro (Coffea arabica). Quatro cultivares foram avaliadas quanto à expressão diferencial de genes associados a processos de desenvolvimento e maturação de frutos. Acaracterização da expressão gênica foi realizada pelas técnicas de RT‑PCR semi‑quantitativa e quantitativa, em frutos coletados em sete estádios de desenvolvimento, durante três safras. Não foi observado nenhum polimorfismo de tamanho ou expressão diferencial entre as cultivares, para os genes avaliados; porém, perfis de expressão distintos durante o desenvolvimento dos frutos foram determinados para cada gene. Quatro entre os 28 genes avaliados apresentaram perfil de expressão constante, em todas as cultivares e safras e, portanto, foram validados como genes candidatos a marcadores fenológicos de frutos de cafeeiro. O gene α‑galactosidase pode ser usado como marcador do estágio de fruto verde, o gene de cafeína sintase como marcador do estádio de transição entre fruto verde e fruto verde‑cana, e o isocitrato liase e o etileno‑receptor 3 como marcadores das fases finais de maturação.
Termos para indexação: Coffea arabica, qualidade de bebida, expressão diferencial, fenologia do fruto, amadurecimento, qRT‑PCR.
Introduction
The phenological cycle of coffee fruit, especially those of Coffea arabica L., exhibits two markedly distinct phases: one reproductive and other vegetative, both occurring simultaneously (Camargo & Camargo, 2001). The reproductive phase is characterized by the occurrence of several blooms, one of which has
a more intense flowering than the others. The major problem associated with this discontinuous flowering
is the nonsynchronization of fruit development and maturation, which affects harvesting and the overall cup‑quality production.
occurring during its development (Pezzopane et al., 2003). The scale was based on photographic images and visual description of each stage. As this criterion is not adequate for physiological and molecular studies, the establishment of other criteria, with
precise identification of phenological stages during
fruit development, is interesting for molecular studies of coffee.
According to physiological parameters, fruit development is a well‑orchestrated process, whose steps are: growth, comprising fruit enlargement; maturation associated with physiological maturity, corresponding to the stage in which fruit continues its development even when removed from the plant; ripening, when global characteristics related to fruit appearance and quality – such as chemical
composition, colour, texture, flavour, aroma – are
determined; and senescence, characterized by a series of events that culminates with cellular death (Castro et al., 2005).
In C. arabica cultivars, fruit takes from 6 to 8 months to complete development. The process initiates at the fecundation with perisperm development and cellular division of endosperm cells. The fruit stages of pinhead and expansion follow this initial development. In the green stage, the elongation of endosperm cells and a gradual loss
of the perisperm tissue are observed. During the final
phase, which corresponds to the yellowish‑green to cherry fruit stages, occurs the pericarp maturation, characterized by endosperm hardening, gradual accumulation of storage proteins, and synthesis of sucrose and complex polycarbohydrates, pigments, and chlorophyll degradation (Pezzopane et al., 2003; De Castro & Marraccini, 2006).
Gene expression during development of both climacteric and nonclimacteric fruit has been widely investigated. Using techniques for large‑scale analysis of gene expression, the role of several genes in regulating fruit maturation and ripening has been established. For instance, an extensive analysis of
Lycopersicum, including a broad metabolic profile and
transcriptome analysis, was performed in developing fruit (Carrari et al., 2006). The analyses showed that metabolite levels are shifted during fruit ripening by a coordination of functional pathways, indicating a precise regulation of metabolic activity. However, transcript accumulation of genes associated with those pathways are not as strictly coordinated as metabolite
accumulation, suggesting that post‑translational
mechanisms may be significant for metabolic
regulation. Overall, a linear association was observed
between ripening‑associated transcripts and specific
metabolites.
Despite the fact that cup‑quality coffee is largely
dependent on fruit development and final chemical
composition, few studies regarding genetic and physiological control of maturation and ripening
are available for coffee, although fruit‑specific
EST collections are available from two large‑scale sequencing projects: Harvest (Lin et al., 2005), and Brazilian Coffee Genome Database (Vieira et al., 2006). An important study used microarrays and real‑time RT‑PCR approaches to characterize
transcriptome profiles of coffee seeds during fruit
development (Salmona et al., 2008). Statistical
analyses of expression profiles from each evaluated
stage allowed gene clustering in functional groups associated with seed development events. Also, the authors suggested the occurrence of genetic mechanisms controlling the transcriptional transitions
throughout fruit development, and identified several
candidate genes to regulate these events.
Besides the contribution to understand the molecular aspects underlying fruit development, knowledge of the genetic control of those processes is important to provide new tools for selecting cultivars with improved agronomic traits, such as uniform
and controlled maturation, and defined chemical
composition of grains.
The objective of this work was to identify genes that could be used as suitable markers for molecular recognition of phenological stages during coffee fruit development.
Materials and Methods
Coffee fruit were sampled from experimental
fields of the Instituto Agronômico (IAC) (22º50'S, 47º00'W, at 854 m) and evaluated during three
3,5 m spacing between rows and 0,8 m between plants. Information regarding cultivar origin and genetic relationships is reviewed by Medina‑Filho et al. (2007).
Fruit were collected from ten coffee plants, at different stages of growing, development and ripening, according to the phenological scale proposed by Pezzopane et al. (2003). Analysed fruit stages were: green, yellowish‑green and cherry, in the 2004/2005 crop season; and ovary, pinhead, expansion and seed endosperm, in the 2005/2006 crop season. Candidates for phenological gene markers were validated from coffee fruit randomly collected from ten plants, during the 2007/2008 harvest, at green, expansion and cherry stages. After harvesting, fruit were immediately frozen and kept at ‑80oC.
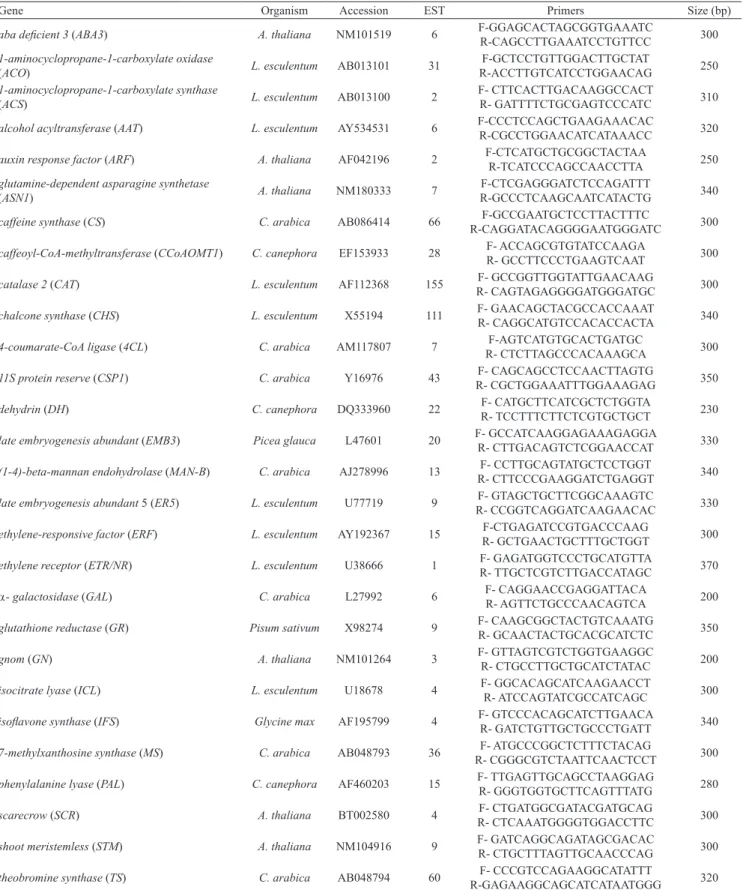
Characterized gene sequences from coffee and other species, associated with fruit development and ripening, were retrieved from the GenBank and used in directed blast searches in Brazilian Coffee Genome Database (Altschul et al., 1990; Vieira et al., 2006). Genes were selected from previous information in the literature, as to their function during fruit development in several plant species. A list of selected genes, accession number and amount of homolog ESTs is on Table 1. Homolog coffee ESTs
were identified and determined based on stringent
similarity parameters – such as e‑value<e‑20 –,
presence of protein‑specific domains, and relative
abundance on libraries containing fruit tissues.
In order to select gene‑specific primers, positive
EST sequences were clustered and realigned with corresponding genes, and highly conserved regions
were identified. Coffee‑based primer pairs were then
selected from those regions.
Total RNA was extracted from 2.0 g of frozen fruit using a LiCl‑based protocol (Chang et al., 1993). RNA
quantification was performed by formaldehyde‑agarose
electrophoresis at 220–340 nm absorbance, using a Shimadzu UV‑1700 spectrophotometer (Shimadzu, Kyoto, Japan).
Gene expression analysis was evaluated both by semi‑quantitative and quantitative RT‑PCR.
Gene‑specific primers are listed on Table 1. A total
of 400 ng RNA DNAse‑free, from each sample, were used for cDNA synthesis using the commercial kit SuperScript III First‑Strand Synthesis SuperMix (Invitrogen, Carlsbad, CA, USA).
Semi‑quantitative RT‑PCR conditions for
amplification of fruit transcripts were: 1 µL of cDNA, 1X reaction buffer, 2 mmol L‑1 MgCl
2, 2 mmol L‑1
dNTP, 1 pmol of each primer, 0.25 U of Taq polymerase. Reactions were performed by 5 min at 95oC, followed by 30 cycles of 1 min at 95oC, 1 min
at 54oC, and 1 min at 72oC. Actin‑specific primers
(forward 5’‑GACCTCACAGATCACCTCAT‑3’, reverse 5’‑GTAGTCTCGTGGATACCAGC‑3’) were used as internal control for both RNA integrity and initial concentration. Transcript evaluation was performed by comparing fragment presence/absence, and by visual intensity of stained band. At least three independent reactions were evaluated for each primer and sample.
Quantitative RT‑PCR (qRT‑PCR) was performed in an AB7300 System (Applied Biosystems, Foster City, CA, USA) using the Sybr Green kit (Invitrogen, Carlsbad, CA, USA), which include both SYBR green
and passive reference ROX fluorescence. Reaction
conditions are the same as described by Maluf et al.,
2009. In order to confirm the presence of single
amplicons, all PCR products were analyzed through a dissociation curve, with temperature varying from 60 to 95oC. Results of qRT‑PCR were analyzed with
the sequence detection software SDS version 1.3.1 (Applied Biosystems), and transcript abundance was
estimated using defined threshold value, baseline,
and fractional cycle number (Ct value) parameters (Maluf et al., 2009). The GAPDH gene was used as the endogenous control (Barsalobres‑Cavallari et al., 2009).
Relative expression quantification was calculated
using average values of three replicates, for each stage,
where each amplification was performed using a fresh
cDNA pool, with the same amounts of cDNA from three different synthesis reactions. Relative expression was calculated using the expansion stage of each cultivar as the calibrator sample.
Gene Organism Accession EST Primers Size (bp)
aba deficient 3 (ABA3) A. thaliana NM101519 6 F‑GGAGCACTAGCGGTGAAATC
R‑CAGCCTTGAAATCCTGTTCC 300 1‑aminocyclopropane‑1‑carboxylate oxidase
(ACO) L. esculentum AB013101 31
F‑GCTCCTGTTGGACTTGCTAT
R‑ACCTTGTCATCCTGGAACAG 250 1‑aminocyclopropane‑1‑carboxylate synthase
(ACS) L. esculentum AB013100 2
F‑ CTTCACTTGACAAGGCCACT
R‑ GATTTTCTGCGAGTCCCATC 310
alcohol acyltransferase (AAT) L. esculentum AY534531 6 F‑CCCTCCAGCTGAAGAAACAC
R‑CGCCTGGAACATCATAAACC 320
auxin response factor (ARF) A. thaliana AF042196 2 F‑CTCATGCTGCGGCTACTAA
R‑TCATCCCAGCCAACCTTA 250
glutamine‑dependent asparagine synthetase
(ASN1) A. thaliana NM180333 7
F‑CTCGAGGGATCTCCAGATTT
R‑GCCCTCAAGCAATCATACTG 340
caffeine synthase (CS) C. arabica AB086414 66 F‑GCCGAATGCTCCTTACTTTC
R‑CAGGATACAGGGGAATGGGATC 300
caffeoyl‑CoA‑methyltransferase (CCoAOMT1) C. canephora EF153933 28 F‑ ACCAGCGTGTATCCAAGA
R‑ GCCTTCCCTGAAGTCAAT 300
catalase 2 (CAT) L. esculentum AF112368 155 F‑ GCCGGTTGGTATTGAACAAG
R‑ CAGTAGAGGGGATGGGATGC 300
chalcone synthase (CHS) L. esculentum X55194 111 F‑ GAACAGCTACGCCACCAAAT
R‑ CAGGCATGTCCACACCACTA 340
4‑coumarate‑CoA ligase (4CL) C. arabica AM117807 7 F‑AGTCATGTGCACTGATGC
R‑ CTCTTAGCCCACAAAGCA 300
11S protein reserve (CSP1) C. arabica Y16976 43 F‑ CAGCAGCCTCCAACTTAGTG
R‑ CGCTGGAAATTTGGAAAGAG 350
dehydrin (DH) C. canephora DQ333960 22 F‑ CATGCTTCATCGCTCTGGTA
R‑ TCCTTTCTTCTCGTGCTGCT 230
late embryogenesis abundant (EMB3) Picea glauca L47601 20 F‑ GCCATCAAGGAGAAAGAGGA
R‑ CTTGACAGTCTCGGAACCAT 330
(1‑4)‑beta‑mannan endohydrolase (MAN‑B) C. arabica AJ278996 13 F‑ CCTTGCAGTATGCTCCTGGT
R‑ CTTCCCGAAGGATCTGAGGT 340
late embryogenesis abundant 5 (ER5) L. esculentum U77719 9 F‑ GTAGCTGCTTCGGCAAAGTC
R‑ CCGGTCAGGATCAAGAACAC 330
ethylene‑responsive factor (ERF) L. esculentum AY192367 15 F‑CTGAGATCCGTGACCCAAG
R‑ GCTGAACTGCTTTGCTGGT 300
ethylene receptor (ETR/NR) L. esculentum U38666 1 F‑ GAGATGGTCCCTGCATGTTA
R‑ TTGCTCGTCTTGACCATAGC 370
α‑ galactosidase (GAL) C. arabica L27992 6 F‑ CAGGAACCGAGGATTACA
R‑ AGTTCTGCCCAACAGTCA 200
glutathione reductase (GR) Pisum sativum X98274 9 F‑ CAAGCGGCTACTGTCAAATG
R‑ GCAACTACTGCACGCATCTC 350
gnom (GN) A. thaliana NM101264 3 F‑ GTTAGTCGTCTGGTGAAGGC
R‑ CTGCCTTGCTGCATCTATAC 200
isocitrate lyase (ICL) L. esculentum U18678 4 F‑ GGCACAGCATCAAGAACCT
R‑ ATCCAGTATCGCCATCAGC 300
isoflavone synthase (IFS) Glycine max AF195799 4 F‑ GTCCCACAGCATCTTGAACA
R‑ GATCTGTTGCTGCCCTGATT 340
7‑methylxanthosine synthase (MS) C. arabica AB048793 36 F‑ ATGCCCGGCTCTTTCTACAG
R‑ CGGGCGTCTAATTCAACTCCT 300
phenylalanine lyase (PAL) C. canephora AF460203 15 F‑ TTGAGTTGCAGCCTAAGGAG
R‑ GGGTGGTGCTTCAGTTTATG 280
scarecrow (SCR) A. thaliana BT002580 4 F‑ CTGATGGCGATACGATGCAG
R‑ CTCAAATGGGGTGGACCTTC 300
shoot meristemless (STM) A. thaliana NM104916 9 F‑ GATCAGGCAGATAGCGACAC
R‑ CTGCTTTAGTTGCAACCCAG 300
theobromine synthase (TS) C. arabica AB048794 60 F‑ CCCGTCCAGAAGGCATATTT
R‑GAGAAGGCAGCATCATAATGGG 320
Results and Discussion
The evaluated cultivars represented both pure
C. arabica lines – Mundo Novo (MN) and Catuaí Vermelho (CV) – and cultivars derived from
interspecific hybrids of C. arabica x C. canephora – Icatu Vermelho (IV) and Obatã (OB). Besides differences in origin, these cultivars also exhibited
specific agronomic traits, such as high (MN and IV)
or short height (CV, OB), precocious (IV) or late maturation (OB), and resistance (OB) or susceptibility (MN and CV) to coffee leaf rust.
Initially, a total of 28 candidate genes were selected, aiming to evaluate genes with different functions, and include those associated with embryo development, fruit chemical composition, and fruit development and maturation (Table 1).
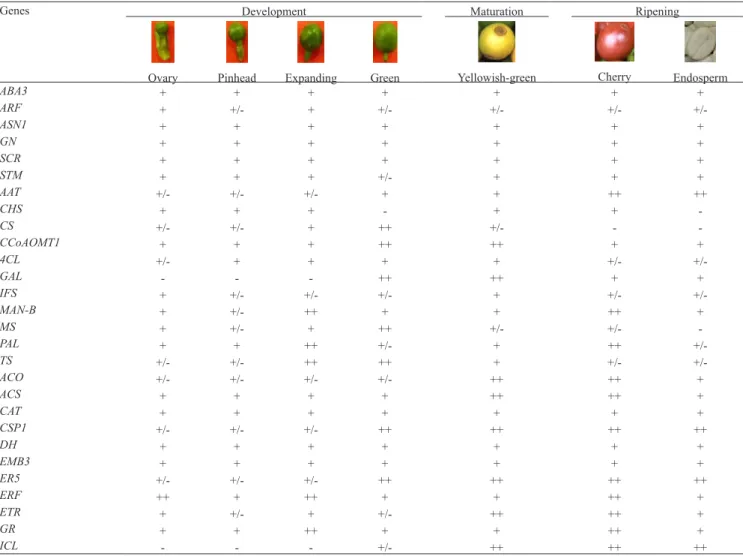
Results on transcripts amplification for all evaluated
genes are summarized on Table 2 and illustrated on Figure 1. Although expression of all genes was
evaluated in the four cultivars, no significant differences
were observed among fruit stages, regarding either size
polymorphisms or expression intensities and profiles.
Therefore, only results related to genes that exhibited a noticeable differential expression for the cultivar Mundo Novo are shown. This cultivar was chosen as the experimental model for all the performed analyses, since it is the oldest cultivar developed by IAC Breeding Program, and also largely cultivated in Brazil.
Almost all evaluated genes exhibited a differential expression pattern along fruit development, although,
in most cases, there was no significant difference among cultivars regarding the transcript accumulation profile.
Genes Development Maturation Ripening
Ovary Pinhead Expanding Green Yellowish‑green Cherry Endosperm
ABA3 + + + + + + +
ARF + +/‑ + +/‑ +/‑ +/‑ +/‑
ASN1 + + + + + + +
GN + + + + + + +
SCR + + + + + + +
STM + + + +/‑ + + +
AAT +/‑ +/‑ +/‑ + + ++ ++
CHS + + + ‑ + + ‑
CS +/‑ +/‑ + ++ +/‑ ‑ ‑
CCoAOMT1 + + + ++ ++ + +
4CL +/‑ + + + + +/‑ +/‑
GAL ‑ ‑ ‑ ++ ++ + +
IFS + +/‑ +/‑ +/‑ + +/‑ +/‑
MAN‑B + +/‑ ++ + + ++ +
MS + +/‑ + ++ +/‑ +/‑ ‑
PAL + + ++ +/‑ + ++ +/‑
TS +/‑ +/‑ ++ ++ + +/‑ +/‑
ACO +/‑ +/‑ +/‑ +/‑ ++ ++ +
ACS + + + + ++ ++ +
CAT + + + + + + +
CSP1 +/‑ +/‑ +/‑ ++ ++ ++ ++
DH + + + + + + +
EMB3 + + + + + + +
ER5 +/‑ +/‑ +/‑ ++ ++ ++ ++
ERF ++ + ++ + + ++ +
ETR + +/‑ + +/‑ ++ ++ +
GR + + ++ + + ++ +
ICL ‑ ‑ ‑ +/‑ ++ ++ ++
Genes associated with embryo development (GN, SCR,
STM, ARF and ASN1) and onset germination (ABA3 and CAT) exhibited expression in all fruit stages, without major differences in transcript accumulation.
Among the genes implicated in final fruit chemical
composition, a decrease of transcript accumulation
at final stages of development was observed for MS,
TS, CS, CCoAOMT1 and 4CL, and was associated with synthesis of caffeine and chlorogenic acids. In contrast, transcript accumulation of genes associated with synthesis of carbohydrates (GAL and MAN‑B) and aromatic compounds (AAT) increased during later stages of development. Expression of genes associated with the synthesis of defence secondary metabolites (PAL, CHS and IFS) did not exhibit a regular profile
during fruit development, indicating that environment
conditions affected more intensely the expression of these genes. In general, although transcript
accumulation profile is stable, small differences can
be observed for some genes and also among cultivars. For instance, transcripts of GAL are more abundant at green stage in all cultivars except for IV, in which a
significant accumulation is observed at green‑yellow
stage. Also, GAL transcript accumulation decreases in cherry stage and in fully mature endosperm of all cultivars. However, genes associated with maturation and germination processes, such as ETR3, ACO, ERF, and ICL exhibited a significant transcript accumulation
in the cherry and fully mature endosperm stages. Based on these semi‑quantitative results, three stages
of fruit development and five genes were selected for
further analyses. The criteria for this selection were
the expression profile uniformity among cultivars,
differential expression among stages, and metabolic role during fruit maturation. The selected genes were
GAL, PAL, ICL, ETR and CS, besides expansion, green, and cherry fruit stages .
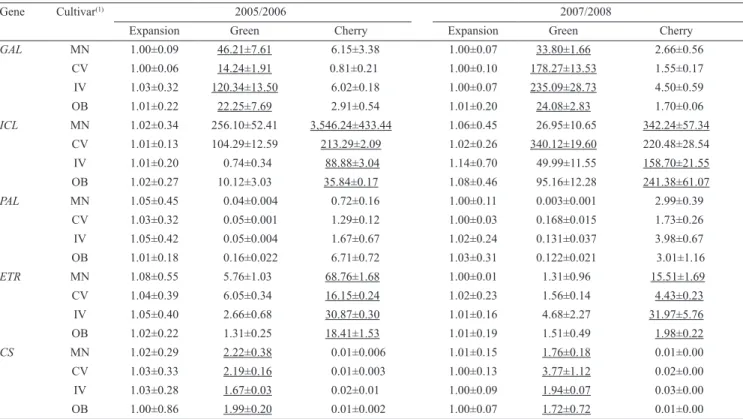
A quantitative RT‑PCR analysis was performed in fruit harvested during 2005/2006 and 2007/2008 seasons, in order to validate the results from semi‑quantitative RT‑PCR. For this, the data sets were
analyzed by two different methods – the first one considering the relative quantification of transcripts,
and the second one considering the absolute transcript amount.
The first method considered the relative quantification
of transcripts, and aimed to verify gene expression
profiles along fruit development in each season. In this
analysis, the initial fruit stage expansion was selected
as the calibrator to establish the accumulation profile. The values of relative quantification are exhibited on Table 3. For all target genes, the expression profile
was identical in fruit harvested during both seasons, since accumulation peaks were observed at the
same fruit stages. Differences on relative transcript amounts observed for all genes may be associated with differences on overall expression activity due to environmental conditions. Transcript accumulation of the CS gene was higher in earlier stages of fruit development, such as expansion and green stages; afterwards, it was drastically reduced. This gene exhibited the more steady expression pattern, as relative
quantification values were constant in both seasons.
The expression of GAL gene increased markedly
on the green stage, and was significantly reduced in
expansion and cherry stages. Accumulation pattern for both ETR and ICL transcripts was very similar, and started at green stage, reaching an accumulation peak during cherry stages. Noteworthy, the cultivar Obatã exhibited very low values of ETR transcripts in fruit harvested during 2007/2008, which indicates the later maturation characteristic of this cultivar (Medina‑Filho
et al., 2007). Transcript accumulation profile of PAL
gene showed two peaks of expression, one during initial stages of fruit development (expansion), and the other during the late stage (cherry). This was the only
Table 3. Relative quantification of gene transcripts in fruit of Arabica cultivars collected at different phenological stages
during, 2005/2006 and 2007/2008 seasons. Peaks of transcript accumulation are subscripted.
Gene Cultivar(1) 2005/2006 2007/2008
Expansion Green Cherry Expansion Green Cherry
GAL MN 1.00±0.09 46.21±7.61 6.15±3.38 1.00±0.07 33.80±1.66 2.66±0.56
CV 1.00±0.06 14.24±1.91 0.81±0.21 1.00±0.10 178.27±13.53 1.55±0.17
IV 1.03±0.32 120.34±13.50 6.02±0.18 1.00±0.07 235.09±28.73 4.50±0.59
OB 1.01±0.22 22.25±7.69 2.91±0.54 1.01±0.20 24.08±2.83 1.70±0.06
ICL MN 1.02±0.34 256.10±52.41 3,546.24±433.44 1.06±0.45 26.95±10.65 342.24±57.34 CV 1.01±0.13 104.29±12.59 213.29±2.09 1.02±0.26 340.12±19.60 220.48±28.54
IV 1.01±0.20 0.74±0.34 88.88±3.04 1.14±0.70 49.99±11.55 158.70±21.55
OB 1.02±0.27 10.12±3.03 35.84±0.17 1.08±0.46 95.16±12.28 241.38±61.07
PAL MN 1.05±0.45 0.04±0.004 0.72±0.16 1.00±0.11 0.003±0.001 2.99±0.39
CV 1.03±0.32 0.05±0.001 1.29±0.12 1.00±0.03 0.168±0.015 1.73±0.26
IV 1.05±0.42 0.05±0.004 1.67±0.67 1.02±0.24 0.131±0.037 3.98±0.67
OB 1.01±0.18 0.16±0.022 6.71±0.72 1.03±0.31 0.122±0.021 3.01±1.16
ETR MN 1.08±0.55 5.76±1.03 68.76±1.68 1.00±0.01 1.31±0.96 15.51±1.69
CV 1.04±0.39 6.05±0.34 16.15±0.24 1.02±0.23 1.56±0.14 4.43±0.23
IV 1.05±0.40 2.66±0.68 30.87±0.30 1.01±0.16 4.68±2.27 31.97±5.76
OB 1.02±0.22 1.31±0.25 18.41±1.53 1.01±0.19 1.51±0.49 1.98±0.22
CS MN 1.02±0.29 2.22±0.38 0.01±0.006 1.01±0.15 1.76±0.18 0.01±0.00
CV 1.03±0.33 2.19±0.16 0.01±0.003 1.00±0.13 3.77±1.12 0.02±0.00
IV 1.03±0.28 1.67±0.03 0.02±0.01 1.00±0.09 1.94±0.07 0.03±0.00
OB 1.00±0.86 1.99±0.20 0.01±0.002 1.00±0.07 1.72±0.72 0.01±0.00
selected gene that did not exhibit an increase/decrease
profile for transcript accumulation. Also, although the
analysis indicates a decrease of transcript accumulation at green stage, the overall differences in values from the other stages are not as expressive as observed in other cultivars.
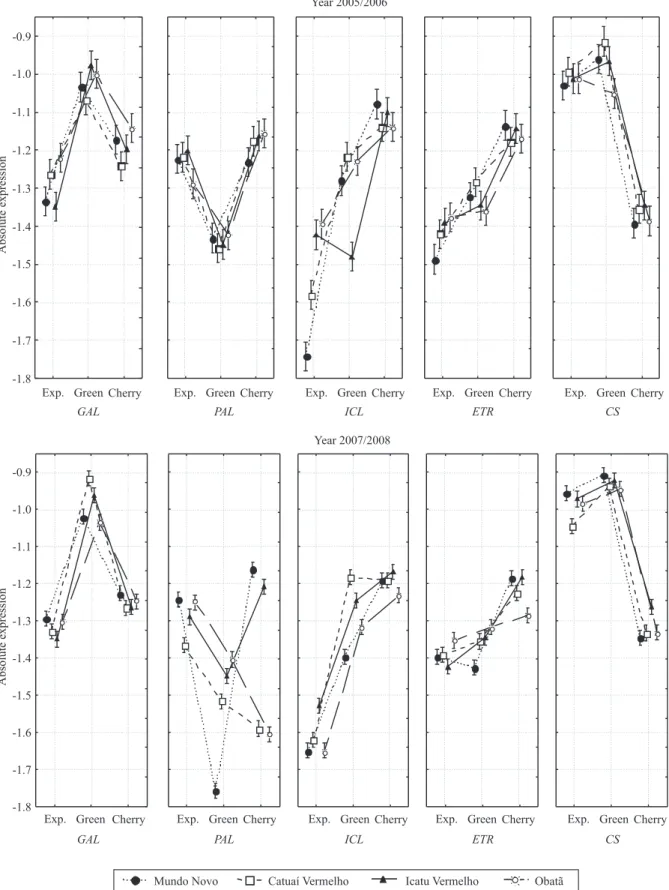
The second method considered the absolute transcript amount, in order to establish how consistent were the gene expression values in each cultivar, and whether this expression was stable from year to
year. The absolute quantification was calculated by
dividing the Ct value, detected for a target gene, by the Ct from the endogenous control gene (GAPDH).
The expression profiles for each gene, in 2005/2006
and 2007/2008, are shown in Figure 2. For all target genes, the absolute transcript amounts in each fruit stage were very similar, in all cultivars and seasons.
This analysis confirmed the accumulation profile detected by the transcript relative quantification
analyses. Peaks of transcripts were observed at the same fruit stages, in all cultivars, suggesting the occurrence of a conserved mechanism for gene regulation during fruit development. Differences in
transcript accumulation profiles were observed in two
cases: ICL expression in IV cultivar, in the 2005/2006 crop season (Figure 2 A), when the green stage showed lower transcript levels than the expansion stage; and PAL expression in fruit of all cultivars harvested on 2007/2008 year (Figure 2 B), when only
the cultivar Mundo Novo exhibited the same profile
as the 2005/2006 crop season. These differences are probably due to activation of a differential response to environmental conditions, since the cultivars have different genetic backgrounds.
The results of gene expression shown here, especially those related to genes involved in maturation and
ripening, corroborate previous classification of coffee
as a climacteric species, since coffee fruit exhibited a rapid increase of ethylene levels at the yellowish‑green stage, followed by a decrease at cherry stage (Pereira
et al., 2005). Also, based on the expression profiles
of the analyzed genes, three major transcriptional
phases were established. The first phase comprehends
fruit differentiation from ovary to expansion fruit stages; the second phase involves the growing and chemical composition of fruit, including green and yellowish‑green fruit; and the third phase is represented by maturation and ripening, and the cherry and fully developed endosperm stages.
The observed transcriptional phases corroborate those suggested by Salmona et al. (2008), in which a transcriptional network controlling seed development in Coffea is proposed. These authors suggest that this network is controlled by two factors: one including perisperm and endosperm development stages, or from pinhead to green stages; and the other including maturation and ripening stages, or from cherry to fully
developed endosperm. Although, in our study, the first
factor was separated in two, the physiological events associated to these stages, such as embryogenesis, grain
enlargement and filling, are the same. However, the
analyses indicated that the last two phases were further
associated with specific gene expression. Therefore,
expression of genes associated to embryogenesis was observed during all fruit stages. Also, expression of genes involved with chemical composition was preferentially observed during green and yellowish‑ green stages. Maturation and ripening‑related genes, such as those involved in ethylene signalling and response and seed desiccation, accumulated at later stages, especially in cherry fruit. Interestingly, genes involved in the synthesis of defence‑related compounds exhibited an irregular expression pattern, indicating that their expression may be affected by environmental factors, as peaks of transcripts were observed during dry and cool weather (April–June).
It is remarkable that all selected genes exhibited
a consistent gene expression profile, despite the fact
that the evaluated cultivars had different genetic backgrounds (Figure 2). Certainly, some small
differences on expression profile were observed, which
were minor occurrences – such as a decrease on ICL
transcripts accumulation in green fruits of cultivar
Icatu Vermelho (Figure 2 A) –, and probably, reflected punctual environmental influence. Nevertheless, significant differences were observed on the transcript quantification values (Table 3). In this case, the
differences were observed not only among the cultivars but also in a same cultivar, from year to year. These differences may be associated with characteristics such
as maturation time and final chemical composition, which are specific to each cultivar (Medina‑Filho et al.,
2007).
Out of the five genes selected as potentially
phenological markers, only the PAL gene did not
exhibit a regular expression profile in different years
Figure 2. Expression profile of marker genes based on statistical analysis of transcript absolute quantification in
These differences may be associated with environmental effects and genetic effects, since cultivars of same
background exhibited a similar expression profile.
Also, PAL is a gene family, and the resulting enzyme, phenylalanine ammonia‑lyase, is involved in several metabolic processes, including synthesis of defence
compound precursors, cell‑wall lignification, among
others (Logemann et al., 1995).
The other genes exhibited a regular profile in all
evaluated cultivars. CS expression is concentrated at early stages, decaying rapidly in cherry fruit (Maluf et al., 2009). Caffeine synthesis occurs during the same stages and, although the levels are constant until complete maturation, there is no caffeine
synthase activity in mature fruit (Suzuki & Waller,
1984; Koshiro et al., 2006). GAL encodes the enzyme α‑galactosidase, responsible for the metabolism of cell‑wall polysaccharides, such as galactomannan/ mannan (Zhu & Goldstein, 1994; Marracinni et al., 2005). The synthesis occurs during the initial and green stages (Pré et al., 2008; Joëtet al., 2009), when
GAL transcripts accumulated in the present work. Expression of ETR, a member of ethylene‑receptor gene family (Bustamante‑Porras et al., 2007), increased
significantly from green to cherry fruit, since they
are required during maturation stages, after a peak of ethylene synthesis (Pereira et al., 2005; Chaves & Mello‑Farias, 2006). The enzyme isocitrate lyase (ICL), a member of the glioxylate cycle, is associated with germination (Bytof et al., 2007). In the present work, although gene expression was observed since early stages, major accumulation occurred in cherry fruit (Figure 2).
Quantification of gene‑marker expressions, in
a given fruit sample, will help to establish more
efficiently the maturation stages of these fruit. Together with pos‑harvesting processing, this identification can
contribute to the development of coffee grains with improved cup quality.
Conclusions
1. The α‑galactosidase gene can be used as a marker of green stage; the caffeine synthase as a marker of transition to green and yellowish‑green stages; and the
isocitrate lyase and ethylene receptor 3 as markers of late maturation.
2. These genes, in association with phenological and agronomic attributes, can be used as molecular
parameters to assist the selective harvesting, and to
help in the identification of specific ripening conditions and possible final chemical grain composition.
Aknowledgments
To the Consórcio Brasileiro de Pesquisa e
Desenvolvimento do Café, for financial support.
References
ALTSCHUL, S.F.; GISH, W.; MILLER, W.; MEYERS, E.W.; LIPMAN, D.J. Basic local alignment search tool. Journal of Molecular Biology, v.215, p.403‑410, 1990.
BARSALOBRES‑CAVALLARI, C.F.; SEVERINO, F.E.; MALUF, M.P.; MAIA, I.G. Identification of suitable internal control genes for expression studies in Coffea arabica under different experimental conditions. BMC Molecular Biology, v.10, 2009. Doi: 10.1186/1471‑2199‑10‑1.
BUSTAMANTE‑PORRAS, J.; CAMPA, C.; PONCET, V.; NOIROT, M.; LEROY, T.; HAMON, S.; KOCHKO, A. Molecular characterization of an ethylene receptor gene (CcETR1) in coffee trees, its relationship with fruit development and caffeine content. Molecular Genetics and Genomics, v.277, p.701‑712, 2007.
BYTOF, G.; KNOPP, S.‑E.; KRAMER, D.; BREITENSTEIN, B.; BERGERVOET, J.H.W.; GROOT, S.P.C.; SELMAR, D. Transient occurrence of seed germination processes during coffee post‑harvest treatment. Annals of Botany, v.100, p.61‑66, 2007. CAMARGO, Â.P. de; CAMARGO, M.B.P. de. Definição e esquematização das fases fenológicas do cafeeiro arábica nas condições tropicais do Brasil. Bragantia, v.60, p.65‑68, 2001.
CARRARI, F.; BAXTER, C.; USADEL, B.; URBANCZYK‑WOCHNIAK, E.; ZANOR, M.I.; NUNES‑NESI, A.; NIKIFOROVA, V.; CENTERO, D.; RATZKA, A.; PAULY, M.; SWEETLOVE, L.J.; FERNIE, A.R. Integrated analysis of metabolite and transcript levels reveals the metabolic shifts that underlie tomato fruit development and highlight regulatory aspects of metabolic network behavior. Plant Physiology, v.142, p.1380‑1396, 2006.
CASTRO, P.R.C.; KLUGE, R.A.; PERES, L.E.P. Manual de
fisiologia vegetal: teoria e prática. Piracicaba: Agronômica Ceres, 2005. 650p.
CHANG, S.; PURYEAR, J.; CAIRNEY, J. A simple and efficient method for isolating RNA from pine trees. Plant Molecular Biology Report, v.11, p.113‑116, 1993.
CHAVES, A.L.S.; MELLO‑FARIAS, P.C. Ethylene and fruit ripening: from illumination to the control of gene expression, more than a century of discoveries. Genetics and Molecular Biology, v.29, p.508‑515, 2006.
JOËT, T.; LAFFARGUE, A.; SALMONA, J.; DOULBEAU, S.; DESCROIX, F.; BERTRAND, B.; KOCHKO, A.; DUSSERT, S. Metabolic pathways in tropical dicotyledonous albuminous seeds: Coffea arabica as a case study. New Phytologist, v.182, p.146‑162, 2009.
KOSHIRO, Y.; ZHENG, X.‑Q.; WANG, M.‑L.; NAGAI, C.; ASHIHARA, H. Changes in content and biosynthetic activity of caffeine and trigonelline during growth and ripening of Coffea arabica and Coffea canephora fruits. Plant Science, v.171, p.242‑250, 2006.
LIN, C.; MUELLER, L.A.; MCCARTHY, J.; CROUZILLAT, D.; PÉTIARD, V.; TANKSLEY, S.D. Coffee and tomato share common gene repertoires as revealed by deep sequencing of seed and cherry transcripts. Theoretical and Applied Genetics, v.112, p.114‑130, 2005.
LOGEMANN, E.; PARNISKE, M.; HAHLBROCK, K. Modes of expression and common structural features of the complete phenylalanine ammonia‑lyase gene family in parsley. Proceedings of National Academy of Sciences, v.92, p.5905‑5909, 1995.
MALUF, M.P.; SILVA, C.C. da; OLIVEIRA, M. de P.A. de; TAVARES, A.G.; SILVAROLLA, M.B.; GUERREIRO‑FILHO, O. Altered expression of the caffeine synthase gene in a naturally caffeine‑free mutant of Coffea arabica. Genetics and Molecular Biology, v.32, p.802‑810, 2009.
MARRACCINI, P.; ROGERS, W.J.; CAILLET, V.; DESHAYES, A.; GRANATO, D.; LAUSANNE, F.; LECHAT, S.; PRIDMORE, D.; PÉTIARD, V. Biochemical and molecular characterization of α‑D‑galactosidase from coffee beans. Plant Physiology and Biochemistry, v.43, p.909‑920, 2005.
MEDINA‑FILHO, H.P.; BORDIGNON, R.; GUERREIRO‑FILHO, O.; MALUF, M.P.; FAZUOLI, L.C. Breeding of Arabica coffee
at IAC, Brazil: objectives, problems and prospects. Acta Horticulturae, v.745, p.393‑408, 2007.
PEREIRA, L.F.P.; GALVÃO, R.M.; KOBAYASHI, A.K.; CAÇÃO, S.M.B.; VIEIRA, L.G.E. Ethylene production and acc oxidase gene expression during fruit ripening of Coffea arabica L. Brazilian Journal of Plant Physiology, v.17, p.283‑289, 2005.
PEZZOPANE, J.R.M.; PEDRO‑JÚNIOR, M.J.; THOMAZIELLO, R.A.; CAMARGO, M.B. de P. Escala para avaliação de estádios fenológicos do cafeeiro arábica. Bragantia, v.62, p.499‑505, 2003.
PRÉ, M.; CAILLET, V.; SOBILO, J.; MCCARTHY, J. Characterization and expression analysis of genes directing galactomannan synthesis in coffee. Annals of Botany, v.102, p.207‑220, 2008.
SALMONA, J.; DUSSERT, S.; DESCROIX, F.; KOCHKO, A.; BERTRAND, B.; JOËT, T. Deciphering transcriptional networks that govern Coffea arabica seed development using combine d cDNA array and real‑time RT‑PCR approaches. Plant Molecular Biology, v.66, p.105‑124, 2008.
STATSOFT. Statistica for Windows. Version 6.0. Tulsa: StatSoft, 1998.
SUZUKI, T.; WALLER, G.R. Biosynthesis and biodegradation of caffeine, theobromine, and theophylline in Coffea arabica L. fruits. Journal of Agricultural and Food Chemistry, v.32, p.845‑848, 1984.
VIEIRA, L.E.G.; ANDRADE, A.C.; COLOMBO, C.A. et al. Brazilian coffee genome project: an EST‑based genomic resource. Brazilian Journal of Plant Physiology, v.18, p.95‑108, 2006.
ZHU, A.; GOLDSTEIN, J. Cloning and functional expression of a cDNA encoding coffee bean alpha‑galactosidase. Gene, v.140, p.227‑231, 1994.