1. Recebido para publicação em 07/08/2001. Aceito para publicação em
11/09/2003 (000711).
2 Laboratory of Mycotoxicology, Food Science and Technology Department,
Centre of Agricultural Sciences, Federal University of Santa Catarina, POBox 476, Florianópolis, SC, Brazil. Fax +55 (0)48.331.9943, e-mail: [email protected]
* A quem a correspondência deve ser enviada.
COMPARISON OF METHODS BY TLC AND HPTLC FOR
DETERMINATION OF AFLATOXIN M
1IN MILK AND B
1IN EGGS
1V. M. SCUSSEL
21 - INTRODUCTION
Aflatoxin M1 (AFM1), a metabolite of aflatoxin B1
(AFB1), was first detected in milk of lactating cows that
had ingested AFB1 contaminated feed. The AFM1 was
also detected in the animals urine and faeces. As for cows, when chicken are fed with contaminated feed, AFB1 can be transferred, to the egg, in that case, without
modification on its chemical structures [1,2,7,11]. Studies have indicated that the toxicity of AFM1 is
of the same order of magnitude as that of AFB1
[2,15,16,34] and that AFM1 is also a potent
hepatocarcinogen in laboratory animals [28]. Therefore, the contamination of dairy products with AFM1 has been
recognised as a significant human health hazard,
particularly for babies, since milk is their basic food and the young of most animal species is more susceptible than the adult animal to its effect. The conversion ratio of the AFB1 ingested to the AFM1 found
in the milk is between 0.5 and 3% [4]. As far as the Regulations and maximum residue level (MRL) are concerned, the United States have declared a risk assessment for AFM1 with an MRL in milk for human
consumption of 0.5µgkg-1 (US Food and Drug
Administration Guidelines for Acceptable Levels of Aflatoxin in Food and Feed), the same for Brazil [9] and the Economic European Community (EEC) proposal on MRL of AFM1 is 0.05µgkg
-1
for milk and milk products [29, 33], on the other hand, there is not legislation for AFB1 contaminationin eggs.
The detection of mycotoxins often involves a combination of adsorption and fluorescence properties, being therefore, the AFM1 and AFB1 detected by their
inherent fluorescence by thin layer chromatography (TLC), high performance thin layer chromatography (HPTLC) or high performance liquid chromatography (HPLC). The physico-chemical properties based
RESUMO
COMPARAÇÃO DE METODOLOGIA PARA ANÁLISE DE AFLATOXINA M1 EM LEITE E AFLATOXINA B1 EM OVOS POR CCD E CCDAE. Aflatoxinas M1 (AFM1) e B1 (AFB1) foram analisadas em leite e ovos respectivamente, por diferentes métodos oficiais da AOAC e modificações usando detecção por cromatografia em camada delgada (CCD) e CCD de alta eficiência (CCDAE). Os métodos modificados: Blanc e Romer, apresentaram-se mais apropriados para análise de AFM1 em leite. Ambos reduziram formação de emulsão, produziram extratos limpos, sem formação de caudas. Inclusive, a precisão e acuidade aumentaram, especialmente quando a quantificação foi realizada por CCDAE. O uso de solventes ternários, no método de Blanc, foi vantajoso. Este solvente extrai AFM1 diretamente da primeira fase (extração), deixando outros compostos na camada binária, evitando emulsão, reduzindo assim, perda da toxina. O RSD% foi muito baixo com 16 e 7%, respectivamente. Quanto ao ovo, AFB1 e extrato final, ambos os métodos necessitam mais estudos. Embora esta matriz induza a formação de emulsão com conseqüente perda de toxina, o método de Romer modificado apresentou extrato razoavelmente limpo com recuperação de 92 e 96% para CCD e CCDAE, respectivamente. A maioria dos métodos estudados não apresentou o desempenho esperado porque as amostras possuem conteúdo elevado de trigliceridios, colesterol, caroteno e proteínas. Embora, a maioria das metodologias para AFM1 seja baseada em CLAE; o uso de CCD para de determinação de AFM1 e AFB1 é particularmente recomendada para aqueles, inexperientes em análises de alimentos e micotoxinas e especialmente, laboratórios que não podem adquirir equipamento sofisticado.
Palavras-chave: aflatoxina; AFM1; AFB1; CCD; CCDAE; leite; ovos.
SUMMARY
Milk and egg matrixes were assayed for aflatoxin M1 (AFM1) and B1 (AFB1) respectively, by AOAC official and modified methods with detection and quantification by thin layer chromatography (TLC) and high performance thin layer chromatography (HPTLC). The modified methods: Blanc followed by Romer, showed to be most appropriate for AFM1 analysis in milk. Both methods reduced emulsion formation, produced cleaner extracts, no streaking spots, precision and accuracy improved, especially when quantification was performed by HPTLC. The use of ternary mixture in the Blanc Method was advantageous as the solvent could extract AFM1 directly from the first stage (extraction), leaving other compounds in the binary mixture layer, avoiding emulsion formation, thus reducing toxin loss. The relative standard deviation (RSD%) values were low, 16 and 7% when TLC and HPTLC were used, with a mean recovery of 94 and 97%, respectively. As far as egg matrix and final extract are concerned, both methods evaluated for AFB1 need further studies. Although that matrix leads to emulsion with consequent loss of toxin, the Romer modified presented a reasonable clean extract (mean recovery of 92 and 96% for TLC and HPTLC, respectively). Most of the methods studied did not performed as expected mainly due to the matrixes high content of triglicerides (rich on saturated fatty acids), cholesterol, carotene and proteins. Although nowadays most methodology for AFM1 is based on HPLC, TLC determination (Blanc and Romer modified) for AFM1 and AFB1 is particularly recommended to those, inexperienced in food and feed mycotoxins analysis and especially who cannot afford to purchase sophisticated (HPLC,HPTLC) instrumentation.
techniques for mycotoxins, TLC and HPTLC, are simple, sensitive and less subject to interference by co-extractives than HPLC. Two dimensional thin layer chromatography (2D TLC) has greatly improved the separation ability of the thin layer techniques. However, one should take into account that the presence of a spot on the TLC/HPTLC plate can only be considered as presumptive evidence of identification, and further confirmation tests are required. Although several HPLC methods have been developed for AFM1 analysis [10,
12, 30, 31, 32], and by immunoassay [8] still TLC methods can be recommended when no HPLC equipment is available [17, 29].
Considering that (a) feeding milking cows and laying hens with highly AFB1 contaminated feed cause its
transfer as AFM1 to milk and AFB1 to eggs, respectively,
(b) many laboratories still do not have HPLC equipment, (c) the high lipid or protein content of the milk and egg matrixes that lead to emulsion formation, thus loss of the compost of interest, and (d) contamination of ani-mal feed and itheir ingredients with AFB1 in Brazil has
been reported [13, 14, 19, 20, 21, 24, 25, 26, 27], a study on the official methodology available in the literature and modified methodology for whole fluid milk and eggs were carried out in order to find out a method that could be fast, simple, reduce emulsion formation, produce a clean extract, as well as sensible and accurate. In addition a comparison on the final extracts behaviour on TLC and HPTLC plates under UV light also was carried out.
2 - MATERIALS AND METHODS
2.1 - Materials
Sample: (a) whole fluid cow milk and (b) egg from
white Leghorn laying hen samples spiked at level of 0.5µg kg-1 of (a) AFM
1 and (b) AFB1, respectively.
Standards: AFB1 and AFM1 (0.1mg) pure standards
from Sigma.
Reagents and solvents: all reagent and solvents
used for the TLC and HPTLC methods were p.a. grade.
Aluminium TLC and HPTLC plates: coated with
silica gel G60. Dimensions for TLC: 200 x 200 and/or 100 x 100mm and for HPTLC: 100 x 200mm (lenght x width), Merck.
Apparatus: Centrifuge: international size 2, Vortex.
Heating block: Aluminium 254mm thick x 254mm wide. Drilled 190mm deep on 762mm centres to accommodate vials. High speed blender: 1 L jar, drill 32 mm hole ca. 1cm from centre of lid to permit escape of vapours. Chromatographic tubes: 22 x 500 (id) (width x length). Microcaps: 1, 2, 5 and 10µL, Drummond Scientific
Company. For HPTLC: autosampler Camag TLC model 27220; Camag HPTLC linear developing tank (5 ml solvent capacity); fluorodensitometer: capable of scanning in reflectance mode by fluorescence, equipped with Hg lamp, monochrometer for adjustment to excitation 366nm and emission cut off filter 420nm Camag TLC Scanner II;
and Hewllet Packard integrator. Part of this work was carried out in England at Natural Resources Institute (NRI), the former Tropical Development Research Institute (TDRI).
2.2 - Methodology of analysis for AFM1 in milk
The methods studied for analysis of AFM1 in milk
were: AOAC I (AFM1 in Milk and Cheese - Final Action), AOAC II (AFM1 in Dairy Products - Final Action), AOAC II/ NRI (AOACII modified by NRI), AOAC III (Peanut and Peanut Products BF Method - Final Action), Romer/NRI, and modified Blanc Method [3,4,5,6,18]. Table 1 summarises the characteristics of those methods studied. The final extracts from all methods were quantified by TLC and HPTLC. The AFM1 spiked samples
of milk and AFB1 spiked eggs were analysed ten times
using each method.
TABLE 1. Summary of the methods compared for AFM1 in milk
TLC = thin layer chromatography
HPTLC = high performance thin layer chromatography
a UV detection at 365nm b one dimensional c two dimensional d HPTLC used in all methods
2.2.1 - AOAC official methods
The materials and methods for the analytical proce-dure of the AOAC Method I, AOAC Method II and AOAC III, were essentially the same as given by Methods of Analysis of the AOAC [3]. Table 1 shows the solvent used for extraction, the chemicals and column packing for the cleanup step and the type of TLC used for separation. For the quantification step the AOAC I method can be carried out either by visual or densitometric reading.
2.2.2 - AOAC and romer methods modified
The AOAC Method II modified by NRI, follows the AOAC procedure for the initial extraction and clean up, but the cellulose column chromatography clean up step was taken out. The quantification was carried out by two dimensional thin layer chromatography (2DTLC) using the solvent systems: ethanol: methanol: water (EMW) (94:4.5:1.5) in the first direction and chloroform: acetone: isopropanol (CAI) (86:4:10) in the second direction. The Romer/NRI Method had some slight modifications from the published Romer Method [18] and these were: (a) the amount of water added at the sample preparation step, (b) no addition of basic copper
Method Extraction Cleanup Separationa
Solvent Chemical Column TLC HPTLC
• AOAC I CHCl3 - Silica gel 1,2Db,cTLC d
• AOAC II Acetone Lead acetate Cellulose 1DbTLC
• AOAC II/NRI Acetone Lead acetate - 2DcTLC
• Romer/NRI Acetone Ferric gel - 2DTLC
• AOAC III MeOH/H2O - - 1DTLC
carbonate at the cleanup step and (c) no addition of the potassium hydroxide/potassium chloride washing at the final extraction step. Also 2DTLC was used instead of one dimensional (1DTLC) and the solvent systems were EMW in direction I and CAI in direction 2.
2.2.3 - Modified blanc method
The basic principle of the Blanc Method [4] is the extraction of AFM1 using a ternary mixture
* of water,
methanol and chloroform [28]. The proportion of each solvent depends on the actual material to be extracted. The extraction occurs in the chloroform monophase. After extraction the equilibrium is changed to diphasic by adding more chloroform. The whole of the chloroform layer is recovered and it is assumed that the total aflatoxin is contained in that layer. Modifications were made to the method in order to make it easier and cheaper whilst maintaining its sensitivity and speed. It was taken out the use of pressure during the column clean-up step by using a wider chromatographic column (diameter of 2cm) with twice the amount of the packing material i.e., 10g of silica-gel used in the original column. The one dimensional TLC was substituted by 2DTLC and HPTLC [23].
2.3 - Methodology of analysis for AFB1 in eggs
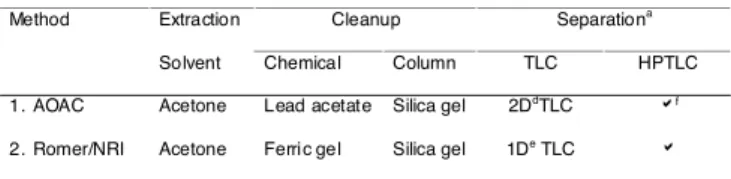
The methods compared for AFB1 analysis in eggs were
the official method AOAC (AFB1 in Eggs Final Action) and Romer modified by NRI which, as for AOAC I method from milk, the quantification can be done either by vi-sual or densitometric reading. Details of the first method are found in the AOAC [3] and for the Romer/NRI are as in Section 2.2.1. Those methods are outlined in Table 2.
TABLE 2. Summary of the methods compared for AFB1 in eggs
TLC = thin layer chromatography
HPTLC = high performance thin layer chromatography
a UV detection at 365nm b one dimensional c two dimensional d HPTLC used in all methods
2.4 - Final extract application on plates
For TLC: the extracts were applied manually on 200 x 200 and 100 x 100mm plates for one dimensional (1D) and two dimensional (2D), respectively, as well as with standards at different concentrations, inclusive internal standard [3], using microcaps (see details on Section 2.1).
For HPTLC: extract and standards were applied automatically on plates 100 x 200mm, using a TLC autosampler (Camag). The final extract spot size (diameter) produced by the HPTLC autosampler was consistently of 1.5 to 2mm, different of that manually applied on 1DTLC
that presented various spot sizes (ca. 5 to 10mm diameter), depending on the extracts appearance (clean, oily or dirty), as they take longer to dry.
2.5 - Confirmation methods
All the methods studied were checked at the end of their procedures for confirmation of the fluorescent spots detected, if they were of AFB1, AFM1 or impurities:
(a) aflatoxin derivatisation (AFB2a) prior to development
of the TLC plate using hydrochloric acid or trifluoroacetic acid (AFM1), (b) using AFB1 or AFM1 internal standards
and (c) spraying the TLC plates with sulphuric acid solution that changes AFM1 or AFB1 spot color [3, 22].
3 - RESULTS AND DISCUSSION
3.1 - Methodology of analysis of AFM1 in milk
The recovery of AFM1 from the spiked milk samples
using the six different methods, as well as the comparison of their different parameters (time, emulsion formation, extract appearance, plate background, and type of TLC used) are shown in Tables 3 and 4, respectively. The official AOAC I Method, which does not has a cleanup step (Table 1), presented the greatest disadvantage of all methods studied since it consistently gave a stable emulsion and an oily final extract leading to the lowest mean recovery (40 and 65% for TLC and HPTLC, respectively) and the highest RSD of all methods. The quantification using either, TLC or HPTLC plates, was difficult due to co-extractives in the final extract, producing spot streaking even when using the alternative: 2DTLC for visual reading. The densitometric quantification of 1DTLC provided reading error of the spot fluorescence (detection of the fluorescence from co-extractives with similar wavelength to the toxins, together with AFM1), different
of that obtained on the 2DTLC cleaner spots by visual reading. The RSD% for both readings, visual and densitometric, were high with 48 and 39, respectively, indicating variation on reading: min. 35; max. 82 and min. 39; max. 88% mean recovery for TLC and HPTLC, respectively, the last being lower than the previous as that technique provides a better spot shape and much smaller size than TLC leading to a more accurate fluorescence detection than the visual (the extract is manually applied on the plate).
On the other hand, the AOAC II was too time consuming due to its cleanup step: an open column (22 x 500mm) packed with cellulose (10g) that lead to a reduced sample extract flow rate, as well as of the washing and elution solvent systems through its packing material. Apart from that, the AOAC II provided a very clean extract and a quite good TLC separation of the toxin (no streaking and good spot shape) with a better recovery than the previous method, either for visual or densitometric reading, (mean recovery of 72
* Ternary mixtures have particularly to be mono or diphasic, depending on the proportion of the components.
Method Extraction Cleanup Separationa
Solvent Chemical Column TLC HPTLC
1. AOAC Acetone Lead acetate Silica gel 2DdTLC
f
and 79% and RSD 26 and 15%, respectively). No spot interference by co-extractives was observed. Although it is still among the AFM1 methodology, this method
retains its official status but is carried out only by reference [3].
When the AOAC II was modified by NRI, in order to improve time and material, the recovery changed. The use of that modified Method II without the cellulose column cleanup step, greatly reduced the time and materials required for analysis, although, that meant some emulsion formation, dirty final extract and the need of two dimension (2DTLC) for purifying/ cleaning the AFM1 spot. That technique (2D) was
excellent on separating AFM1 from other impurities,
on the other hand, it tends to give diffused and sometimes distorted (i.e., not round) spots which lead to difficulties on the quantification step, hence, inaccuracies can arise when visual reading is used. The same can occur for HPTLC technique, as the toxin is eluted only at one direction on the plate (1DHPTLC) thus, some co-extractives are still present and one may get over-reading results leading to error. Furthermore, the 2DTLC has the disadvantage of only one sample can be tested per plate, different to those several (ca. 3) samples per plate on 1DTLC and ca. of 60 on HPTLC plates (30 spots each side of the HPTLC plate plus standards). The mean AFM1 recovery was
higher than AOAC II with 80% (min. 70; max. 87%) and 92% (min. 87; max. 96%) and RSD of 25 and 12% for TLC and HPTLC, respectively.
TABLE 3. Recovery of AFM1 from spiked milk samples
a n = 10 from TLC separation and visual readings b minimum
c maximum
d relative standard deviation
e carried out 5 times only (column cleanup = time consuming)
TABLE 4. Comparison of method parameters milk
TLC = thin layer chromatography
HPTLC = high performance thin layer chromatography
a UV detection at 365 nm b one dimensional c two dimensional
d densitometer quality of fluorescence reading (d.1 = bad, d.2 = good, d.3 = very good)
The Romer/NRI Method showed a substantial reduction of the time spent for the analysis with a mean recovery of 90% (min. 79%; max. 95%) and 96% (min. 90; max. 96%) and of a quite good RSD of 15 and 8% for TLC and HPLTC, respectively. However, with the disadvantage of the extracts not been always clean and needed 2DTLC (as for AOAC/NRI). The alkaline and ferric chloride cleanup greatly improved the quality of the final extract, when compared to the previous method. From the methods studied for milk, the Romer/NRI method was the shortest among them.
The AOAC III (Method developed for peanuts and its products) presented a reasonably good method for milk with a recovery of 75% and RSD of 27% for TLC. The same occurred, as for some of the previous methods studied, due to the fact that milk tends to form a stable emulsion when mixed with the solvents, it led to a difficult separation of AFM1 (even using centrifugation)
and a dirty final extract. That method has not got an efficient cleanup procedure especially for matrixes rich on protein such as milk.
The mean recovery for the modified Blanc Method was the best among the methods studied (was 97% with a RSD of 7% for HPTLC and 94% with RSD of 16% for TLC), although the time taken per sample was slightly longer (3h.) than that for the Romer/NRI Method (2½h). By using the Blanc ternary solvent mixture for AFM1
extraction, no emulsion is formed leading to a reduction of AFM1 loss. In addition, using an HPTLC for detection
in the modified Blanc Method, the accuracy of fluorescence intensity reading improves. All that leading to a limit of detection (LOD) and limit of quantification (LOQ) of 0.001µgkg-1. The HPTLC equipments cost will
reduce, as a large number of samples can be quantified per HPTLC plate run. It is important to emphasize that the RSD% for the HPTLC is lower because in an com-plete HPTLC procedure either, the autosampler improves the extract application quality and the linear develop-ment tank leads to a high quality toxin separation improving the repeatibility, reproducibility, accuracy of the scanner detection and quantification.
3.2 – Methodology of analysis for AFB1 in eggs
For the egg samples and AFB1 extraction and
separation, the high content of lipids and proteins still is the main problem on the toxin extraction, leading to emulsion formation, producing an oily/dirty extract and error on recovery quantification either for the AOAC (developed for eggs First Action) and Romer/NRI methods. Despite of the use of lead acetate and ferric chloride respectively, inclusive silica gel column at the cleanup steps, the behavior of egg final extract rich on lipid co-extractives on IDTLC plates was disastrous (spot streaking and over-reading of fluorescence from AFB1 and of co-extractives), leading to error, or not being
possible to read the spot fluorescence at all (Table 5 and 6). The 2DTLC improves spot purity and provides a better visual reading, however, when HPTLC is used the plate is developed on one direction only reproducing the same problem as for visual 1DTLC reading. Although
Met hod Time Emulsion Extract Plate Background TLC/
(Hours) Formation Appearance Streaking Size HPTLCa
1. AOAC I 3½ - 4 + Oily Yes Good 1Db/+d. 1
2. AOAC II 4½ - 5 +/- Clean No Good 1D/+++d.3
3. AOAC II/NRI 3 - 3½ + Dirty Yes Spread 2Dc/+d.1
4. Romer/NRI 2½ +/- Clean/dirty Yes/no Spr/good 2D/++d.2
5. AOAC III 3 + Dirty Yes Good 1D/+d. 1
6. Modified Blanc 3 - Clean No Good 1D/+++d.3
Method Extraction Cleanup Separationa
Solvent Chemical Column TLC HPTLC
1. AOAC I CHCl3 - Silica gel 1,2Db,cTLC d
2. AOAC II Acetone Lead acetate Cellulose 1DbTLC
3. AOAC II/NRI Acetone Lead acetate - 2DcTLC
4. Romer/NRI Acetone Ferric gel - 2DTLC
5. AOAC III MeOH/H2O - - 1DTLC
emulsion formation was a problem in the first step of the AOAC method, the recovery was 83 and 98% for TLC and HPTLC, respectively. The min. and max. recovery was 80 and 98% (RSD of 30 and 44%) and 99 and 132% (RSD 44%). Despite of that, the Romer/NRI Method extraction and detection presented a better performance than the AOAC method for eggs.
Considering that (a) even when HPTLC was used instead TLC, the performance of the final egg extract did not improve, and (b) the co-extractives interfered on the reading, leading to higher recovery than the spiked samples (for the two methods) it is necessary further study on the extraction of AFB1 from egg matrix
TABLE 5. Recovery of AFB1 from spiked egg samples
a n = 10 obtained from TLC separation and visual readings b minimum
c maximum
d relative standard deviation
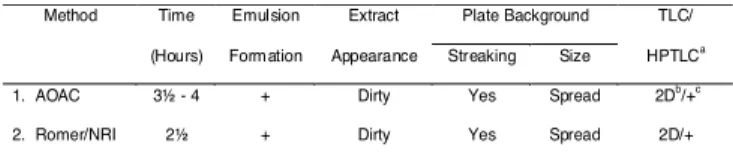
TABLE 6. Comparison of method parameters eggs
TLC = thin layer chromatography
HPTLC =high performance thin layer chromatography
a UV detection at 365nm b two dimensional
c densitometer quality of fluorescence reading (+ = bad)
As far as the choice for a chromatographic based methodology is concerned, HPLC methods with fluorescence detection are the most used and reported in the literature for AFM1. Although, when there is a
lack of that equipment, laboratories must try to find out alternatives and they may use TLC in order to quantify AFM1. The Romer/NRI and Blanc methods seem
to present adequate extraction and detection with good recovery. If the equipment is available, HPTLC can improve accuracy, repeatability and speed, improving therefore the quality and reliability of toxin data obtained. It is important to emphasise that the fluorescence intensity of emission for aflatoxins vari-es among them: the AFB2 is 8 times more intense than
the AFB1 and AFM1 and AFM2 are 3 fold more fluorescent
than AFB1 and AFB2 which is advantageous to those
using the TLC detection technique in their laboratories (if AFM1 is more fluorescent, it can be visible at lower
concentrations than AFB1).
Concerning to the safety of the analyst and the solvents used, the AOAC I and modified Blanc method use chloroform as the solvent for AFM1 extraction. That
solvent is carcinogenic being in nowadays substituted: dichoromethane can be used instead. The AOAC II and
AOAC II/NRI (for milk) and AOAC (for egg) use for cleanup lead acetate which should also be changed.
As far as international proposed methods of analysis for aflatoxin AFM1 in milk and milk products are
concerned, the only reference methods recommended are the AOAC methods and certified reference material for milk powder are available for methodology checking at levels of 0.05, 0.31 and 0.76µgkg-1 [29].
While HPLC technique has excellent sensibility (able to detect very low amounts), reproducibility and is applicable to automation, it can bring specific problems such as: requirement of highly clean extracts, only one sample to be analyzed at time, running costs are high and highly trained personnel are normally necessary to operate the equipment and interpretation the results. The HPTLC is fast, sensible, reproducible, automatic and the most advantage: it can read ca. 60 samples per plate.
4 - CONCLUSION
Milk: taking into account (a) the extraction step
(b) emulsion formation, (c) the appearance of the extract, (d) its cleanliness and behaviour during the TLC proce-dure, (e) the precision, (f) cost and (g) analysis time/ sample of each method, the modified Blanc and Romer/ NRI were the methods that presented the best performance among all methods studied for AFM1
analysis in whole fluid milk. Inclusive presenting very low and consistent LOD and LOQ (modified Blanc = 0,001 and Romer/NRI = 0.005µgkg-1) thus being able to attend
the demand of most stringent international regulations for AFM1 such as Germany, The Netherlands, Sweeden
(MRL: 0.05µgkg-1 for whole milk) and Germany (MRL:
0.01µgkg-1 for dairy food for infants) [9]. Especially if the
modified Blanc method is used with HPTLC technique. The use of ternary mixture in the Blanc method is advantageous as the solvent can extract AFM1 directly
from the first stage, reducing losses through exhaustive liquid-liquid partition, a step that leads to a reduction of the LOD. The AOAC/NRI method could also be used for milk, if provided a suitable cleanup solvent system is used to substitute the cellulose column and to enable 1DTLC for quantification.
Egg: although, the Romer/NRI method seemed to
be better than the AOAC method on the comparative study for AFB1 determination in eggs, emulsion occurred
on both methods assayed, leading to loss of toxin. The time required to carry out the Romer/NRI method was shorter than for the AOAC method. It is important to emphasise that the Romer method developed for peanuts (rich on triglicerides) modified by NRI was chosen for comparison of its behavior on toxin deter-mination from milk and egg matrixes, due to the fact that they have high lipid content, either triglicerides, cholesterol and carotene. The difference is that the fatty acid in those animal samples are saturated, therefore more difficult to extract than the oil (poli unsaturated fatty acids) on the peanut samples. On the other hand, those matrixes also have high content of protein.
Method Recovery (%) RSDd
Meana Min.b Max.c (%)
TLC HPTLC TLC HPTLC TLC HPTLC TLC HPTLC
1. AOAC 83 98 80 98 98 112 30 44
2. Romer/NRI 92 96 75 93 92 96 25 20
Method Time Emulsion Extract Plate Background TLC/
(Hours) Formation Appearance Streaking Size HPTLCa
1. AOAC 3½ - 4 + Dirty Yes Spread 2Db /+c
Despite of that, it did not performed as expected perhaps for eggs due to the emulsion formation. In addition, both matrixes are also rich on protein, which could be reduced by the Romer cleanup step.
Although the recent preference for HPLC methods, the TLC has special advantages that makes it still be very popular, such as the possibility of carrying out in situ derivatization procedures to confirm the presence of the toxins and the fact that the analyst has a certain contact with the result of the separation, because the human eye itself can act as a detector. Inclusive the limit of detection (LOD) for plate reading on TLC and HPTLC are similar (ca. 0.4ng) [5,6]. TLC is particularly recommended to those, inexperienced in food and feed analysis for mycotoxins and who cannot afford to purchase sophisticated (HPLC, HPTLC) instrumentation such as in developing countries.
5 - REFERENCES
[1] ALLCROFT, R.; CARNAGHAM, R.B.A. Groundnut toxicity: An examination for toxin in human food products from animal fed toxic groundnut meal.Veterinary Record, v. 75, p. 259 263, 1963.
[2] ALLCROFT, R. Excretion of aflatoxin in a lactating cow. Food Cosmetic Toxicology, v. 6, p. 893 901, 1980.
[3] AOAC (Association of Official Analytical Chemists).
Official Methods of Analysis of AOAC International. 17th ed., Horwitz, W. (ed.), Gaithersburg, Maryland, USA; 2000: vol II, chap. 49.
[4] BLANC, M. Methode rapide de dosage de laflatoxine M1 dans le produits laitiers. Industries Alimentaires et Agricoles, v. 97, p. 893 901, 1980.
[5] COKER, R. JONES; B.D.; NAGLER, M.J. NRI Mycotoxins
Training, Section B: n. 10, England, UK, 1983a. Na-tural Resources Institute (NRI).
[6] COKER, R.; JONES, B.D.; NAGLER, M.J. NRI
Mycotoxins Training, Section B: n. 11, England, UK, 1983b.Natural Resources Institute (NRI).
[7] DELLA ROSA, H.V. Determinação de Aflatoxinas M1
em Leite por Fluorodensitometria. São Paulo, 1979. Tese de Mestrado em Ciência de Alimentos, Universi-dade de São Paulo (USP).
[8] DILLEY, C.L.; DIXON-HOLLAND, D.D. Rapid residue
test for aflatoxin M1 and sulfamethazine in dairy products, Food Technology, v. 44, p. 122, 1990. [9] FAO (Food and Agriculture Organization of the United
Nations). Worldwide regulations for mycotoxins –
A compendium. Rome: FAO, 1997. FAO Food and Nutrition Paper, 64.
[10] GIFFORD, L.A.; WRIGHT, C.; GILBERT, J. Robotic
analysis of aflatoxin M1 in milk. Food Additives and Contaminants,v. 7, p. 829 836, 1990.
[11] HOLZAPFEL, C.W.; STEYN, P.S.; PURCHASE, I.F.H. Isolation and extraction of aflatoxin M1 and M2.
Tetrahedron Letters, v. 25, p. 2799, 1966.
[12] HORWITZ, W.; ALLEN, R.; NESHEIM, S. Reliability of
mycotoxin assays: an up to date. Journao of AOAC
International, v. 76, p. 461-491, 1993.
[13] MALLMANN, C.A. Laboratório de Analises
Micotoxicológicas LAMIC. Disponível em: Http:/
www.ufsm.br/mycotoxins. Acesso em: 09/12/1999.
[14] MENEGAZZO, R.; LAZZARI, F.A. Micotoxinas em mi-lho para rações na região Sul do Brasil. In: Congresso Nacional de Milho e Sorgo, XXI, Londrina, PR. Anais. Associação Brasileira de Milho e Sorgo, Londrina, 1996, p.341.
[15] PURCHASE, I.F.H. Acute toxicity of aflatoxin M1 and
M2 in one-day-old ducklings. Food Cosmetic
Toxicology, v. 5, p. 339 342, 1967.
[16] PURCHASE, I.F.H. Aflatoxin residues in food of ani-mal origin. Food Cosmetic Toxicology, v. 10, p. 531, 1972.
[17] RODRIGUEZ-AMAYA, D.B. CCD vs CLAE: Uma análise crítica e comparativa. In: Cruz (ed.). Micotoxinas - Pers-pectiva Latinamericana, Rio de Janeiro, RJ: UFRRJ, 1996. p. 59 - 77.
[18] ROMER, T.R. Screening method for the detection of aflatoxins in mixed feeds and other agricultural commodities with subsequent confirmation and quantitative measurement of aflatoxins in positive
samples. Journal of the Association of Official
Analitical Chemists, v. 58, p. 500 506, 1975. [19] SABINO, M. Variações de níveis de aflatoxina B1 em
alimentos e rações animais no período de 1971 a 1979.
Revista do Instituto Adolfo Lutz, v. 40, p. 153, 1980. [20] SABINO, M.; PRADO, G.; COLEN, G. Ocorrência de aflatoxinas, ocratoxina A e zearalenona em milho de
Minas Gerais: Parte 1. Revista do Instituto Adolfo
Lutz, v. 46, p. 65-71, 1986.
[21] SABINO, M.; PRADO, G.; INOMATA, E.I.; PEDROSO, M.O.; GARCIA, R.U. Natural occurence of aflatoxins
in maize in Brazil: Part II. Food Additives and
Contaminants, v. 6, p. 327-31, 1989.
[22] SCHULLER, P.L.; OCKHUIZEN, T.; WERRINGLOER,J. e MARQUARDT, P. Aflatoxin B1 und histamine in wein. Arzneim Forsch, v.17, 888-891, 1967.
[23] SCUSSEL, V.M. Comparison of methods for analysis of
aflatoxin in dairy products. Tropical Development
Resources Institute Mycotoxin Training Course, England, 1983.p12. Project Work.
[24] SCUSSEL, V.M.Fungos e Micotoxinas Associados a Grãos
Armazenados. In: Lorini, L.; Miike, H.L.; Scussel, V.M.
(ed.) Armazenagem de Grãos. Campinas, SP: IBG, 2002.
Seção 9. p.672 804.
[25] SCUSSEL, V.M.; RODRIGUEZ-AMAYA, D.B. Incidên-cia de Aflatoxinas em milho (Zea mays, L.) e produtos derivados, comercializados na região de Campinas,
Es-tado de SP. Boletim de Ciênc. Tecnol. Aliment., v.
6, p. 75-85, 1986.
[26] SCUSSEL, V.M.; BARATTO, W.R.; TONIN, M. Levels of aflatoxin contamination in dairy cow feed and their possible transfer to milk. International Symposium on Phytochemistry and Agriculture, 28th. Wageningen, The
Netherlands. Anais. The Phytochemical Society of
Europe, Wageningen, 1992. p. 22.
[27] SCUSSEL, V.M.; VOLPATO, O.; COSTA, L.L.F.; SILVA, E.L. Fungi and aflatoxin production in beans from Brazil. Revue de Medicine Veterinaire, v. 6, p. 531, 1998.
[28] SHIH, C.N.; MARTH, E.H.A Procedure for rapid recovery
of aflatoxin from cheese and other foods. Journal of Milk and Food Technology, v. 34, p. 119, 1971. [29] SMITH, J.E.; LEWIS, C.W.; ANDERSON, J.G.;
SOLOMONS, G.L. Mycotoxins in Human Nutrition
and Health. Directorate-General XII, Sciences, Research and Development, EUR16048 EN, 1994, 300 pp. [30] STUBBLEFIELF, R.D.; HOUSTEAD, J.P.; SHOTWELL,
swine grown in regions reporting 1988 aflatoxin
contaminated corn. Journal of the Association of
Official Analitical Chemists, v. 74, p. 879-899, 1991. [31] SYLOS, C.M.; RODRIGUEZ-AMAYA, D.B.; CARVALHO, P.R.N. Occurrence of aflatoxin M1 in milk and dairy
products commercialised in Campinas, Brazil, Food
Addit. Extenso Contam. v. 13, p. 169-172, 1996. [32] TUNISTRA, L.G.M.T.; KIENHERIS, P.G.M.; DOLS, P.
Automated liquid chromatographic determination of
aflatoxin M1 in milk using on-line dialysis for sample
preparation. Journal of the Association of Official
Analitical Chemists, v. 73, p. 969 973, 1990. [33] WHO (World Health Organization). Safety Evaluation of
Certain Mycotoxins in Food. Food Additives Series
47. Rome: FAO, 2001. Food and Nutrition Paper, 74. [34] WOGAN G.N.; PAGLIALUNGA S. Carcinogenicity of
synthetic aflatoxin M1 in rats. Food Cosmetic