AbstrAct: The present study aimed to estimate the genetic divergence among corn half-sib progenies seeking to direct recombination between contrasting and superior progenies for green corn production. Ninety-six progenies were evaluated in a randomized block design with 3 replications, and 18 characteristics associated with agronomic adaptation and green corn yield were measured. The genetic divergence was estimated using generalized square Mahalanobis distance and the progenies grouped by UPGMA and Tocher’s methods. The joint analysis
PlAnt breeding - Article
Genetic dissimilarity and definition of
recombination clusters among green corn
half-sib progenies
Danilo Fernando Guimarães Silva1, Caroline de Jesus Coelho1, Cristiane Romanek1, José Raulindo
Gardingo2, Anderson Rodrigo da Silva3, Brenda Luiza Graczyki1, Eduardo Augusto Teixeira Oliveira1,
Rodrigo Rodrigues Matiello1,2*
1. Universidade Estadual de Ponta Grossa - Programa de Pós-Graduação em Agronomia - Ponta Grossa (PR), Brazil. 2. Universidade Estadual de Ponta Grossa - Departamento de Fitotecnia e Fitossanidade - Ponta Grossa (PR), Brazil. 3. Instituto Federal Goiano - Agronomia - Urutaí (GO), Brazil.
*Corresponding author: [email protected]
Received: Aug. 3, 2015 – Accepted: Jan. 26, 2016
of variance showed genetic variability among the progenies for the characteristics evaluated. The UPGMA method was more sensitive than Tocher’s, since it led to the formation of 11 groups genetically dissimilar compared to the 5 ones of Tocher’s method. The grouping allowed to identify superior and contrasting progenies for green corn production. The recombination of these progenies allows increasing genetic variability and the frequency of alleles favorable to the green corn production.
intrOdUctiOn
Commercial production of corn is widespread in Brazil. It is widely used in human nutrition and consumed as corn on the cob in natura, prepared as homemade sweets such as pamonha, curau, juice, cake, ice cream, and the industrialized canned version (Pereira Filho 2002).
In Brazil, of the 479 maize genotypes available in the market for the 2013/2014 crop, only 15, among hybrids and open pollinated varieties, were recommended for the production of green corn (Cruz et al. 2013). A research indicated lack of cultivars to meet market demand and, therefore, the necessity to intensify breeding programs to select genotypes that meet the requirements of corn producers and consumers (Dovale et al. 2011; Pereira Filho 2002).
The starting point for successful breeding programs is the genetic variability, which is maximized by interbreeding different genotypes associated with agronomic traits of interest for the selection (Ertiro et al. 2013). The genetic divergence among individuals or populations is estimated by biometric models, usually analyzed by multivariate statistical methods with multiple information of each access expressed in dissimilarity measures (Sudré et al. 2005). Among dissimilarity measures, there is the generalized squared Mahalanobis distance (Mahalanobis 1936), which takes into account the correlations between the evaluated traits (Cruz and Carneiro 2006).
Hundreds to thousands of individuals are evaluated in the breeding process, seeking to identify superior and different genotypes for traits of interest, which will be intended for recombination. These individuals are more easily identified by using clustering methods to obtain genotype groups with similar and diverging traits within clusters. The UPGMA and Tocher’s methods are the most used for this purpose (Cruz and Regazzi 1994; Cruz and Carneiro 2006; Kopp et al. 2007).
It is noteworthy that grouping results for half-sib progenies adapted to the production of corn, using hierarchical and/or optimization methods, were not found in the literature. Thus, this study aimed at estimating the genetic divergence among half-sib progenies via hierarchical and optimization methods as well as assessing the consistency of the groups by Fisher’s discriminant analysis, seeking to direct the recombination process between the most divergent corn progenies and with
the highest frequency of favorable alleles for green corn production.
MAteriAl And MetHOds
The 2 experiments were established as a randomized experimental design in blocks with 3 repetitions on October 5, 2012 and November 22, 2012. The experiments were conducted using no tillage system in the experimental area of the “Capão da Onça” Farm School, Ponta Grossa, Paraná State, located between lat 25°05′36.68″S and lat 25°05′41.25″S and long 50°03′17.11″W and long 50°03′11.16″W, at an altitude of 1,015 m. The soil is classified as Cambisol haplic Tb Hapludox with clayey texture (Embrapa 2006). The average temperatures are 21.4 and 13 °C in the hottest and coldest months, respectively, with 1,574 mm average annual rainfall (IAPAR 2012).
A total of 98 genotypes were used, of which 96 half-sib progenies and 2 commercial cultivars as controls, the hybrid AG 1051 (AGROCERES) and the open pollinated variety Cativerde 02 (CATI/SP). The 96 half-sib progenies originated from 126 ears obtained in the 2006/2007 harvest that resulted from the random inbreeding of 34 varieties of landrace maize, which were subjected to cycles of selection among and within half-sib progeny through the recurrent selection methodology. The experimental unit consisted of two 4-m-long rows spaced 0.9 m from one another, with final density of 55,000 plants∙ha−1.
The genotypes were evaluated for phenological and morphological traits: male and female cycle in days (MC and FC); plant height in meters (PH); main ear insertion height in meters (EIH). From the R3 stage (milky grain), manual harvest was carried out to evaluate the productive and qualitative traits in commercial and husked ears (dehusked ear length ≥ 15 cm and free from pest damage); number of husked ears in thousands of ears∙ha−1 (NE);
percentage of commercial husked ears (%HE); yield of husked ears expressed as t∙ha−1 (YIELD); ear weight in
grams (EW); husked ears length and diameter in cm (EL and ED); number of commercial ears in thousands of ears∙ha−1 (NCE); percentage of commercial ears
(%CE); yield of commercial ears in t∙ha−1 (CYIELD);
of kernel rows per ear (NKR); and fresh kernel mass in grams (FKM). The data of phenotypic variables were submitted to individual and joint analysis of variance. The homogeneity of the residual variances was checked by the maximum F-test.
The dissimilarity measure adopted to estimate the genetic divergence among the genotypes was the generalized squared Mahalanobis distance (D2) due to
the assumption that the studied characters are correlated. The generalized squared Mahalanobis distance (D2) allowed
to quantify the relative contribution of characters to genetic diversity, for each trait, for the total dissimilarity observed between progenies using the criterion proposed by Singh (1981).
From the generalized squared Mahalanobis distance (D2), we proceeded to cluster the genotypes by the
UPGMA method. The Mojena’s (1977) method was used to determine the cutoff point in the dendrogram. The procedure is based on the relative size of fusion levels or distances in the dendrogram. The method consists of selecting the number of groups in the j stage to satisfy the following inequality: αj > θk, where αjis the value of the fusion level corresponding to stage j (j = 1, 2, ..., g − 1) and θkis the reference cutoff value, expressed by: θk=+ k σα,
where and σαare the unbiased estimates of the mean and standard deviation of α values. We adopted k = 1.0 to define the number of groups, according to Milligan and Cooper (1985).
The cophenetic matrix of the Tocher’s method was obtained using the methodology developed by Silva and Dias (2013), who propose to acquire a matrix similar to the cophenetic one from the hierarchical methods, through the intra and intergroup average distances. The cophenetic correlation coefficients were obtained from the original distances and cophenetic matrices. The cophenetic correlation coefficients were subjected to Mantel (1967) randomization test (α ≤ 0.05) based on 5,000 permutations. The linear discriminant Fisher (1936) functions were estimated to confirm the consistency of the corn progeny clustering (UPGMA and Tocher) using the linear combinations of “p” original variables of “g” groups, assumed to have normal distribution with homogeneous covariance matrices.
The separation power of clustering methods was evaluated from the Apparent Error Rate (AER) obtained with the Fisher’s discriminant functions according to:
where: n is the total number of classifications (n = 98) and ei is the number of erroneous classifications in each
cluster.
All statistical analyses were performed using the R software version 2.15.2 (R Development Core Team 2012).
resUlts And discUssiOn
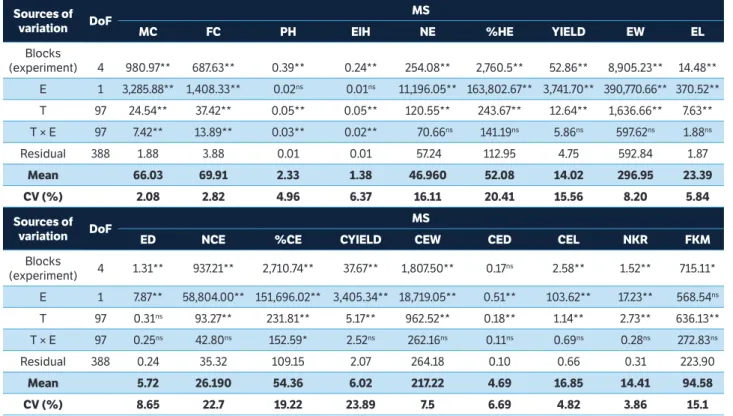
The results of the joint analysis of variance showed a significant effect (p ≤ 0.01) of genotypes for most phenotypic variables except for the husked ear diameter (Table 1). These results show the presence of genetic variability to green corn production and the possibility of genetic gain with artificial selection. The interaction experiments versus treatments showed a significant effect only for the variables: male and female cycle, plant height and main ear insertion height (Table 1).
The genetic divergence among genotypes estimated by the squared Mahalanobis distance (D2) showed greater
similarity between progenies 6 and 86 with D2 = 1.51.
Moreover, the greatest genetic dissimilarity was observed between the hybrid AG 1051 and progeny 67 with D2 = 109.66 (data not shown). The estimated divergence
indices showed that the most divergent genotypes were always present in the combinations between one commercial control (variety Cativerde 02 or hybrid AG 1051) and some corn half-sib progeny.
The relative contribution of each trait (Ŝj) for genetic divergence showed that male and female cycles, number of kernel rows, yield of husked ears, and main ear insertion height were the most influent variables. On the other hand, ear number, ear weight and diameter, number and diameter of commercial ears were the traits with minor contributions to divergence (Table 2). Variables that contributed little to the genetic divergence are strongly correlated with other traits and more likely to be discarded because they explain the same type of information (Ivoglo et al. 2008; Rotili et al. 2012; Simon et al. 2012). In this work, the variables number of ears and the number of commercial ears can be discarded because, together, they explain less than 2% of the genetic
AER = ei g
i = 1 1
sources of variation doF
Ms
Mc Fc PH eiH ne %He Yield eW el
Blocks
(experiment) 4 980.97** 687.63** 0.39** 0.24** 254.08** 2,760.5** 52.86** 8,905.23** 14.48** E 1 3,285.88** 1,408.33** 0.02ns 0.01ns 11,196.05** 163,802.67** 3,741.70** 390,770.66** 370.52**
T 97 24.54** 37.42** 0.05** 0.05** 120.55** 243.67** 12.64** 1,636.66** 7.63** T × E 97 7.42** 13.89** 0.03** 0.02** 70.66ns 141.19ns 5.86ns 597.62ns 1.88ns
Residual 388 1.88 3.88 0.01 0.01 57.24 112.95 4.75 592.84 1.87
Mean 66.03 69.91 2.33 1.38 46.960 52.08 14.02 296.95 23.39
cV (%) 2.08 2.82 4.96 6.37 16.11 20.41 15.56 8.20 5.84
sources of variation doF
Ms
ed nce %ce cYield ceW ced cel nKr FKM
Blocks
(experiment) 4 1.31** 937.21** 2,710.74** 37.67** 1,807.50** 0.17ns 2.58** 1.52** 715.11* E 1 7.87** 58,804.00** 151,696.02** 3,405.34** 18,719.05** 0.51** 103.62** 17.23** 568.54ns
T 97 0.31ns 93.27** 231.81** 5.17** 962.52** 0.18** 1.14** 2.73** 636.13**
T × E 97 0.25ns 42.80ns 152.59* 2.52ns 262.16ns 0.11ns 0.69ns 0.28ns 272.83ns
Residual 388 0.24 35.32 109.15 2.07 264.18 0.10 0.66 0.31 223.90
Mean 5.72 26.190 54.36 6.02 217.22 4.69 16.85 14.41 94.58
cV (%) 8.65 22.7 19.22 23.89 7.5 6.69 4.82 3.86 15.1
table 1. Summary of the joint analysis of variance for the 18 phenotypic variables evaluated in the experiments of aptitude to green corn production. Ponta Grossa, 2014.
**,*Significant at 1 and 5% probability, respectively; nsNon-significant. MS = Mean square; DoF = Degrees of freedom; MC = Male cycle (days); FC = Female cycle (days); PH = Plant height (m); EIH = Ear insertion height (m); NE = Number of husked ears (thousands of ears∙ha−1); %HE = Percentage of commercial husked ears; E = Experiments; T = Treatments; YIELD = Yield of husked ears (t∙ha−1); EW = Weight of husked ears (g); EL = Length of husked ears (cm); ED = Diameter of husked ears (cm); NCE = Number of commercial ears (thousands of ears∙ha−1); %CE = Percentage of commercial ears; CYIELD = Yield of commercial ears (t∙ha−1); CEW = Commercial ear weight (g); CED = Commercial ear diameter (cm); CEL = Commercial ear length (cm); NKR = Number of kernel rows per ear (rows∙ear−1); FKM = Fresh kernel mass per ear (g).
divergence between corn genotypes and are strongly correlated with the yield of husked ears.
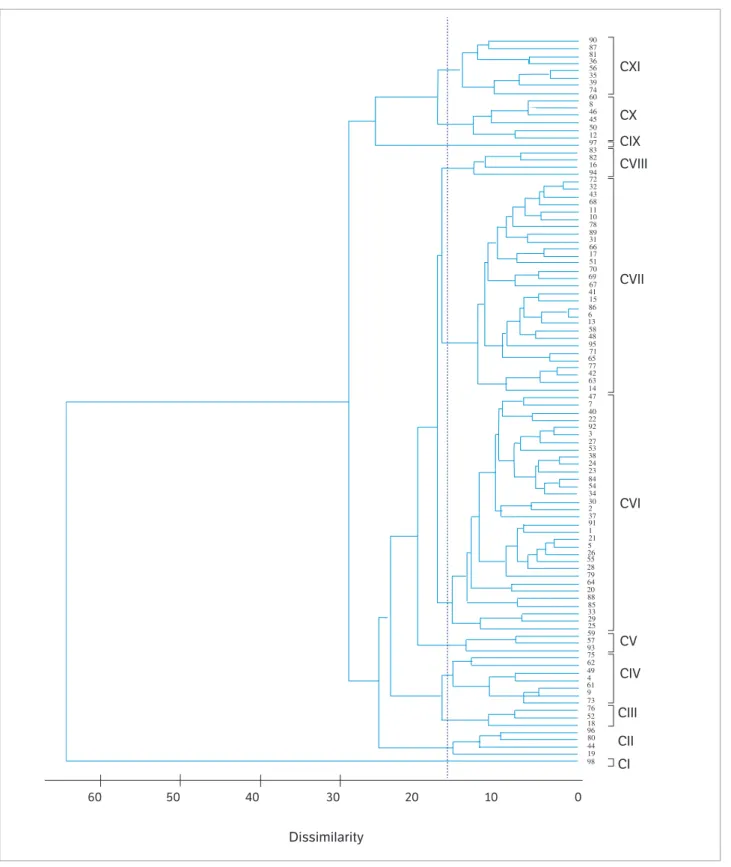
The cutoff applied at a distance of 16.5 in the UPGMA dendrogram was based on the Mojena (1977) method, which corresponds to 25.6% of the highest fusion level, allowing to visualize 11 clusters (Figure 1). Cluster I (C I) consisted of genotype 98 only (hybrid AG 1051). C II grouped the progenies 19, 44, 80 and 96 (4.1%), and C III, the progenies 18, 52 and 76 (3.1%). C IV and V grouped 7 and 3 progenies, respectively. C VI clustered the vast majority of the progenies (32) followed by C VII, with 29 progenies, which represented 62% of the studied maize genotypes. C VIII grouped progenies 16, 82, 83 and 94, while C IX had only the commercial variety (Cativerde 02). C X and XI grouped 6 and 8 progenies, respectively. These results confirm the high genetic dissimilarity of the commercial controls AG 1051 and variety Cativerde 02 compared to half-sib progenies evaluated regarding aptitude for green corn production (Figure 1). The hierarchical method of average linkage
between clusters UPGMA was precise on clusters of green corn half-sib progenies. Rigon et al. (2015) studied genetic diversity among commercial corn hybrids and reported that the UPGMA was more sensitive than the Tocher’s method. Mohammadi and Prasanna (2003) pointed out that cluster analysis allows to identify genetically more dissimilar genotypes, reducing the required number of combinations in a breeding program.
From the averages of the 18 phenotypic variables in the clusters generated by the UPGMA method, it is evident that the C II, III, V and XI stood out with the highest number of traits of interest for corn production. C II had the greatest potential for the number of husked ears (48,915 ears∙ha−1), fresh kernel mass (104.96 g), female
cycle precocity (63.59 days) and lower ear insertion height (1.25 m). Progenies of C III stood out for their high corn yield (15.29 t∙ha−1), ear weight (321.73 g)
ear weight (230.14 g) and diameter (4.85 cm). The progenies of C XI showed high potential yield for the unhusked ear market, showing high phenotypic superiority to the traits number of commercial ears (29,363 ears∙ha−1), % commercial ears (61%), ear yield
(6.78 t∙ha−1) and commercial ear length (17.31 cm)
(Table 3).
The results indicate that recombination between the half-sib progenies of C II, III, V and XI, superior and contrasting for corn production, should increase the favorable genetic variability in the population, as well as the possibility of selection of half-sib progenies transgressive to this agricultural potential.
The cophenetic correlation coefficient obtained from the UPGMA clustering was 0.65 and significant by the Mantel’s test (p ≤ 0.01), indicating a realistic representation
table 2. Estimates of the relative contribution of 18 traits for genetic divergence among 98 genotypes (controls/witness and half-sib progenies) of corn. Ponta Grossa, 2014.
traits Ŝ.j relative contribution (%)
MC 18,184.18 16.66 FC 12,308.64 11.28 PH 3,137.49 2.87 EIH 13,151.46 12.05 NE 191.07 0.18 %HE 2.631,47 2.41 YIELD 13,658.51 12.51
EW 857.95 0.79 EL 6,368.98 5.83 ED 1,765.66 1.62 NCE 1,935.90 1.77 %CE 3,237.51 2.97 CYIELD 3,721.41 3.41 CEW 4,845.06 4.44 CED 2,256.83 2.07 CEL 2,632.90 2.41 NKR 15,497.34 14.20 FKM 2,777.57 2.54
MC = Male cycle (days); FC = Female cycle (days); PH = Plant height (m); EIH = Ear insertion height (m); NE = Number of husked ears (thousands of ears∙ha−1); %HE = Percentage of commercial husked ears; YIELD = Yield of husked ears (t∙ha−1); EW = Weight of husked ears (g); EL = Length of husked ears (cm); ED = Diameter of husked ears (cm); NCE = Number of commercial ears (thousands of ears∙ha−1); %CE = Percentage of commercial ears; CYIELD = Yield of commercial ears (t∙ha−1); CEW = Commercial ear weight (g); CED = Commercial ear diameter (cm); CEL = Commercial ear length (cm); NKR = Number of kernel rows per ear (rows∙ear−1); FKM = Fresh kernel mass per ear (g).
of the genetic distance of genotypes in the dendrogram. Silva and Dias (2013) compared different clustering methods by evaluating 5 traits in 89 garlic accesses and reported that the cophenetic correlation coefficient of the UPGMA method was 0.76. Possibly, the difference between the coefficients is due to the higher number of phenotypical traits evaluated in this study.
Fisher’s discriminant analysis applied to UPGMA detected 14 wrong classifications, i.e. an AER of 14.3%, while no erroneous classifications were found in C I, II, V, VIII and IX. C III had 100% of incorrect classifications; progeny 76 was relocated to C VI and progenies 18 and 52 were relocated to C VII (Figure 2a). The 7 progenies of C IV were regrouped in C VI. Progeny 79 was moved from C VI to C VII and 89, from C VII to C VIII (AER 3.1%). Of the 6 clustered progenies in C X, 5 remained (83.3%), and only progeny 50 was relocated to C XI. Finally, in C XI, with 87.5% of correct classifications, only progeny 35 was transferred to C VI (Figure 2a).
The Tocher’s method clustered 98 genotypes in just 5 dissimilar groups (Table 4). Vasconcelos et al. (2007) pointed out that this method has the peculiarity of clustering a larger number of genotypes in the first group, while isolated individuals are, usually, clustered in the last groups. This method feature becomes interesting in this study because it allows identifying genetically dissimilar individuals and not only groups.
C I grouped the majority of genotypes, with 81 half-sib progenies (82.56%); CII grouped 8 (7 progenies and variety Cativerde 02). C III clustered 5 progenies (19, 44, 70, 93 and 96) and C IV only 3 (52, 62 and 75). On the other hand, the commercial hybrid AG 1051 remained isolated from the genotypes, confirming the high genetic diversity of this genotype in relation to the half-sib progeny analyzed (Table 4). Other studies about genetic divergence by Rigon et al. (2015), Santos et al. (2015) and Gouvêa et al. (2010), using the Tocher’s optimization method, reported similar cluster pattern results for corn hybrids, cupuaçu access and rubber tree genotypes, respectively.
Figure 1. Clustering of 98 corn genotypes (progenies and control) using the UPGMA method from the squared Mahalanobis distance (D2).
Ponta Grossa, 2014.
60 50 40 30
Dissimilarity
20 10 0
CI CII CIII CIV CV CVI CVII CVIII CIX CX CXI 98 44 19 80 18 96 52 73 76 9 4 61 49 75 62 93 59 57 25 33 29 85 20 64 79 28 55 26 5 21 1 91 37 2 30 34 54 84 23 24 38 53 27 3 92 22 40 7 47 14 63 42 77 88 65 95 71 48 13 6 86 15 41 67 69 70 51 17 66 31 89 78 10 11 68 43 32 72 94 16 82 83 97 12 50 45 46 8 60 74 39 35 56 36 81 87 90 58
performance for the traits ear weight, commercial ear diameter and weight as well as fresh kernel mass. C IV performed agronomically better for husked ear
(NE, YIELD and PE) and commercial ear yields, with an average of 6.38 t∙ha−1; 231.97 g for commercial ear
clusters Mc Fc PH eiH ne %He
I 72.83 78.00 2.22 1.44 46.050 63.65 II 63.59 67.79 2.27 1.25 48.915 51.41 III 66.17 68.89 2.27 1.38 47.273 55.87 IV 66.26 70.12 2.42 1.44 48.039 46.49 V 65.39 72.28 2.31 1.31 40.047 57.46 VI 66.59 70.50 2.35 1.40 47.691 53.40 VII 64.09 67.51 2.26 1.31 47.104 50.61 VIII 66.08 69.04 2.33 1.37 46.240 42.87 IX 71.67 76.00 2.47 1.60 37.530 44.33 X 69.08 73.86 2.47 1.52 46.623 52.49 XI 68.19 72.46 2.44 1.48 46.329 55.96
clusters ed nce %ce cYield ceW ced
I 5.60 23.880 53.97 5.34 210.71 4.70 II 5.96 23.758 48.35 5.88 229.94 4.84 III 6.15 26.560 55.19 6.21 222.21 4.80 IV 5.70 25.447 51.96 6.12 225.64 4.82 V 5.86 22.013 53.06 5.33 230.14 4.85 VI 5.75 25.973 53.12 5.93 215.14 4.71 VII 5.64 26.754 55.28 6.16 217.15 4.68 VIII 5.49 26.803 55.18 5.63 196.23 4.45 IX 5.56 16.570 43.37 3.53 198.77 4.32 X 5.86 25.302 53.09 5.86 221.49 4.76 XI 5.66 29.363 61.02 6.78 214.10 4.55
clusters Yield eW el cel nKr FKM
I 13.24 292.91 22.65 16.02 15.91 103.25 II 14.87 304.86 22.79 16.60 15.42 104.96 III 15.29 321.73 24.07 16.51 15.59 91.19 IV 13.95 289.83 22.58 16.84 15.56 101.63
V 12.77 316.58 22.71 16.76 14.60 101.02 VI 14.41 301.11 23.72 16.80 14.11 94.43 VII 13.79 290.40 22.96 16.87 14.24 94.45 VIII 12.53 268.27 22.80 17.15 13.99 76.46 IX 10.27 273.33 24.95 16.48 14.63 77.79 X 14.06 301.61 23.58 16.60 14.66 97.05 XI 14.14 301.57 24.64 17.31 14.13 89.73
table 3. Average performance of 18 phenotypical traits for each corn genotype obtained by the UPGMA method. Ponta Grossa, 2014.
MC = Male cycle (days); FC = Female cycle (days); PH = Plant height (m); EIH = Ear insertion height (m); NE = Number of husked ears (thousands of ears∙ha−1); %HE = Percentage of commercial husked ears; YIELD = Yield of husked ears (t∙ha−1); EW = Weight of husked ears (g); EL = Length of husked ears (cm); ED = Diameter of husked ears (cm); N C E = N u m b e r o f c o m m e rc i a l e a r s ( t h o u s a n d s o f e a r s ∙ h a− 1) ; %CE = Percentage of commercial ears; CYIELD = Yield of commercial ears (t∙ha−1); CEW = Commercial ear weight (g); CED = Commercial ear diameter (cm); CEL = Commercial ear length (cm); NKR = Number of kernel rows per ear (rows∙ear−1); FKM = Fresh kernel mass per ear (g).
for commercial ear length; and 16.2 for the number of kernel rows per ear (Table 5).
Hallauer and Miranda Filho (1995) emphasized that corn with high phenotypic averages and divergent to the traits of interest should be prioritized in the genotypes recombinant schemes. In the case of genotypes with intermediate production and high genetic diversity and others with high-production potential and intermediate diversity, the authors recommend the last option as a priority for the recombination process. In this sense, the recombination between half-sib progeny of C III, which had intermediate performance for traits related to the commercial aspect of the ears, and those of C IV, which were superior to the potential commercial yield of ears, should allow to improve genetic variability. This improvement results from the progenies recombined by increasing the frequency of favorable alleles for this agricultural suitability, as well as the probability of obtaining recombinant genotypes for the greatest number of traits of interest aimed at corn production optimization.
Figure 2. Scores of the first 2 Fisher discriminant functions (LD) applied to the clusters of corn genotypes obtained by the UPGMA method (a) and Tocher’s optimization method (b). Ponta Grossa, 2014.
6
4
2
0
–2 4
2
0
2
–4
–5 0
LDI (50.0%)
5
–2 0 2 4 6
LDI (43.3%)
LD2 (34.0%)
LD2 (16.8%)
I IV
X
V IV
I III
II IX
VII
VII
V III XI
(a)
clusters number of genotypes in
the clusters genotypes
I 81
1 2 3 4 5 6 7 9 10 11 12 13 14 15 16 17 18 20 21 22 23 24 25 26 27 28 29 30 31 32 33 34 35 36 37 38 39 40 41 42 43 45 47 48 49 51 53 54 55 56 57 58 59 61 63 64 65 66 67 68 69 71 72 73 76 77 78 79 80 81 82 83 84 85 86 88 89 91 92 94 95
II 8 8 46 50 60 74 87 90 97 (Cativerde 02)
III 5 19 44 70 93 96
IV 3 52 62 75
V 1 98 (AG 1051)
table 4. Clusters of corn genotypes obtained from the clustering analysis using the Tocher’s optimization method based on the squared Mahalanobis distance. Ponta Grossa, 2014.
clusters Mc Fc PH eiH ne %He
I 65.78 69.52 2.32 1.37 47.150 51.78 II 69.33 74.14 2.47 1.51 44.800 53.56 III 63.07 67.47 2.26 1.27 46.100 52.88 IV 66.61 70.50 2.31 1.40 49.460 51.17 V 72.83 78.00 2.22 1.44 46.050 63.64
clusters Yield eW el ed nce %ce
I 14.04 296.11 23.35 5.70 26.430 54.50 II 13.48 299.21 24.39 5.80 26.164 56.85 III 13.99 304.00 22.75 5.96 23.051 49.96 IV 14.95 302.61 23.35 5.93 25.661 51.44 V 13.23 292.91 22.65 5.60 23.877 53.97
clusters cYield ceW ced cel nKr FKM
I 6.04 215.50 4.69 16.85 14.30 93.23 II 5.98 214.02 4.66 17.06 14.30 88.71 III 5.79 234.59 4.84 16.67 14.92 110.51 IV 6.38 231.97 4.81 16.70 16.20 103.90 V 5.34 210.34 4.70 16.02 15.91 103.25
table 5. Average performance of 18 phenotypical variables for each corn genotype cluster obtained using Tocher’s optimization method. Ponta Grossa, 2014.
MC = Male cycle (days); FC = Female cycle (days); PH = Plant height (m); EIH = Ear insertion height (m); NE = Number of husked ears (thousands of ears∙ha−1); %HE = Percentage of commercial husked ears; YIELD = Yield of husked ears (t∙ha−1); EW = Weight of husked ears (g); EL = Length of husked ears (cm); ED = Diameter of husked ears (cm); N C E = N u m b e r o f c o m m e rc i a l e a r s ( t h o u s a n d s o f e a r s ∙h a− 1) ; %CE = Percentage of commercial ears; CYIELD = Yield of commercial ears (t∙ha−1); CEW = Commercial ear weight (g); CED = Commercial ear diameter (cm); CEL = Commercial ear length (cm); NKR = Number of kernel rows per ear (rows∙ear−1); FKM = Fresh kernel mass per ear (g). The cophenetic correlation coefficient obtained by the
Tocher’s method was 0.70 and significant by the Mantel’s test (p ≤ 0.01). The result of Fisher’s discriminant analysis enabled to detect only 5 erroneous classifications in the cluster analysis, or 5.1% of AER. In C I, of the 81 half-sib progenies initially grouped, 79 (97.5%) were correctly classified, and only progenies 1 and 56 were reallocated to CII (Figure 2b). In CII, 87.5% of classifications were correct, and only progeny 8 was reclassified to C I. In C III, progeny 93 was erroneously classified and transferred to C I. C IV was initially composed by progenies 52, 62 and 75, and only 52 was regrouped in CI (Figure 2b).
The cluster analysis results using the UPGMA and Tocher’s methods and the cluster consistency test via Fisher’s discriminant analysis may serve as a basis for further work involving the study of genetic diversity among corn half-sib progenies, thus directing the recombination process between the most divergent genotypes, in order to obtain corn progenies with higher frequency of favorable alleles regarding corn production.
cOnclUsiOn
The UPGMA and Tocher’s methods effectively clustered the most similar corn progenies according to the phenotypic traits associated with corn production. The hierarchical method UPGMA allied to Mojena’s criterion is more sensitive than the Tocher’s optimization, since it resulted in a greater number of clusters with more dissimilar progenies.
Recombination of half-sib progenies of C II and C III (early maturity, high yield potential and quality of husked ears) with those of C V and C XI (high yield potential and quality of commercial ears) should allow increasing the frequency of favorable alleles to improve the aptitude for production traits of the green corn populations under selection.
AcKnOWledgeMents
Thanks are due to the Coordenação de Aperfeiçoamento de Pessoal de Nível Superior (CAPES), for granting a master’s degree scholarship, and to Conselho Nacional de Desenvolvimento Científico e Tecnológico (CNPq) for the Research Productivity Grant to the corresponding author. In addition, to the Farm School “Capão da Onça” for providing the experimental area and the infrastructure for conducting the research.
Cruz, C. D. and Carneiro, P. C. S. (2006). Modelos biométricos aplicados ao melhoramento genético. Viçosa: Editora da UFV.
Cruz, C. D. and Regazzi, A. J. (1994). Modelos biométricos aplicados ao melhoramento genético. Viçosa: Editora da UFV.
Cruz, J. C., Pereira Filho, I. A. and Queiroz, J. R. (2013). Milho: cultivares para 2013/2014. Sete Lagoas: EMBRAPA Milho e Sorgo; [accessed 2013 Oct 11]. http://www.cnpms.embrapa.br/milho/cultivares/
Dovale, J. C., Fritsche Neto, R. and Silva, P. S. L. (2011). Índice de seleção para cultivares de milho com dupla aptidão: minimilho
e milho verde. Bragantia,70, 781-787. http://dx.doi.org/10.1590/
S0006-87052011000400008.
Empresa Brasileira de Pesquisa Agropecuária (2006). Sistema brasileiro de classificação de solos. 2. ed. Brasília: Embrapa.
Ertiro, B. T., Twumasi-Afriyie, S., Blümmel, M., Friesen, D., Negera, D., Worku, M., Abakemal, D. and Kitenge, K. (2013). Genetic variability of maize stover quality and the potential for genetic improvement
of fodder value. Field Crops Research,153, 79-85. http://dx.doi.
org/10.1016/j.fcr.2012.12.019.
Fisher, R. A. (1936). The use of multiple measurements in
taxonomic problems. Annals of Eugenics, 7, 179-188. http://dx.doi.
org/10.1111/j.1469-1809.1936.tb02137.x.
reFerences
Gouvêa, L. R. L., Chiorato, A. F. and Gonçalves, P. S. (2010). Divergence and genetic variability among superior rubber tree
genotypes. Pesquisa Agropecuária Brasileira, 45, 163-170. http://
dx.doi.org/10.1590/S0100-204X2010000200007.
Hallauer, A. R. and Miranda Filho, J. B. (1995). Quantitative genetics in maize breeding. 2 ed. Ames: Iowa State University Press.
Instituto Agronômico do Paraná (2012). Cartas climáticas do Paraná; [accessed 2012 Nov 10]. http://www.iapar.br/modules/conteudo/ conteudo.php?conteudo=677
Ivoglo, M. G., Fazuoli, L. C., Oliveira, A. C. B., Gallo, P. B., Mistro, J. C. Silvarolla, M. B. and Toma-Braghini, M. (2008). Divergência genética entre progênies de café robusta. Bragantia, 67, 823-831.
http://dx.doi.org/10.1590/S0006-87052008000400003.
Kopp, M. M., Souza, V. Q., Coimbra, J. L. M., Luz, V. K., Marini, N. and Oliveira, A. C. (2007). Melhoria da correlação cofenética pela exclusão de unidades experimentais na construção de dendrogramas. Revista da FZVA, 14, 46-53.
Mahalanobis, P. C. (1936). On the generalised distance in statistics. Proceedings of the National Institute of Science, 2, 49-55.
Milligan, G. W. and Cooper, M. C. (1985). An examination of procedures for determining the number of clusters in a data set.
Psychometrika, 50, 159-179. http://dx.doi.org/10.1007/BF02294245.
Mohammadi, S. A. and Prasanna, B. M. (2003). Analysis of genetic diversity in crop plants — salient statistical tools and
considerations. Crop Science, 43, 1235-1248. http://dx.doi.
org/10.2135/cropsci2003.1235.
Mojena, R. (1977). Hierarchical grouping methods and stopping
rules: an evaluation. The Computer Journal, 20, 359-363. http://
dx.doi.org/10.1093/comjnl/20.4.359.
Pereira Filho, I. A. (2002). O cultivo do milho verde. Brasília: Embrapa Milho e Sorgo.
R Development Core Team (2012). The R Project for Statistical Computing; [accessed 2016 Jul 4]. http://www.R-project.org
Rigon, J. P. G., Capuani, S. and Rigon, C. A. G. (2015). Genetic divergence among maize hybrids by morphological descriptors.
Bragantia, 74, 156-160. http://dx.doi.org/10.1590/1678-4499.0246.
Rotili, E. A., Cancellier, L. L., Dotto, M. A., Peluzio, J. M. and Carvalho, E. V. (2012). Divergência genética em genótipos de milho no
Estado do Tocantins. Ciência Agronômica, 43, 516-521. http://
dx.doi.org/10.1590/S1806-66902012000300014.
Santos, V. S., Martins Filho, S., Alves, R. M., Resende, M. D. V. and Silva, F. F. (2015). Genetic divergence among cupuaçu accessions
by multiscale bootstrap resampling. Bragantia, 74, 169-175. http://
dx.doi.org/10.1590/1678-4499.0431.
Silva, A. R. and Dias, C. T. S. (2013). A cophenetic correlation coefficient for Tocher’s method. Pesquisa Agropecuária Brasileira,
48, 589-596. http://dx.doi.org/10.1590/S0100-204X2013000600003.
Simon, G. A., Kamada, T. and Monteiro, M. (2012). Divergência genética em milho de primeira e segunda safra. Semina, 33,
449-458. http://dx.doi.org/10.5433/1679-0359.2012v33n2p449.
Singh, D. (1981). The relative importance of characters affecting genetic divergence. Indian Journal of Genetics and Plant Breeding, 41, 237-245.
Sudré, C. P., Rodrigues, R., Riva, E. M., Karasawa, M. and Amaral Junior, A. T. (2005). Divergência genética entre acessos de pimenta e pimentão utilizando técnicas multivariadas. Horticultura Brasileira,
23, 22-27. http://dx.doi.org/10.1590/S0102-05362005000100005.
Vasconcelos, E. S., Cruz, C. D., Bhering, L. L. and Resende Junior, M. F. R. (2007). Método alternativo para análise de agrupamento.
Pesquisa Agropecuária Brasileira, 42, 1421-1428. http://dx.doi.