www.ccarevista.ufc.br ISSN 1806-6690
Water needs and equivalence relations for different irrigated crops in
the São Francisco basin
1Demanda hídrica e relações de equivalência para diferentes culturas irrigadas na
bacia do São Francisco
Felipe Bernardes Silva2*, Silvio Bueno Pereira2, Mauro Aparecido Martinez2, Demetrius David da Silva2 and
Nayara Paula Andrade Vieira3
ABSTRACT - The present work was performed by applying the principal component analysis, in order to compare the water needs of banana, mango, grape, sugarcane, maize and beans crops in different regions of the São Francisco river basin, aiming to identify the climate elements that most influence the reference evapotranspiration (ET0) in the locations of Pirapora-MG, Jaíba-MG, Barreiras-BA and Petrolina-PE. In addition, the locations with more similarities, according to the evaluated parameters, were verified by applying cluster analysis, and the equivalence relations between the studied crops were determined by integrating the parameters related to the climatic elements and the characteristics of crops and soils. Based on the principal components analysis, it was observed that the most significant climate elements for ET0 estimation were different for each place. The model with two components explained 90%, 88%, 95% and 97% of the total variance, respectively for the locations of Pirapora, Jaíba, Barreiras and Petrolina. Because it is in a semi-arid climate region, Petrolina showed high crop water needs, a behavior proven with the cluster analysis. The equivalence relations allowed comparing the water needs for the studied crops, providing, in general terms, a parameter comparison between the crops, and specifying which one will be more adequate depending on the water availability in the São Francisco basin.
Key words:Irrigated agriculture. Crop water balance. Climatic parameters. Evapotranspiration.
RESUMO -O presente trabalho foi conduzido aplicando a estatística multivariada de componentes principais para comparar
as demandas hídricas das culturas da banana, manga, uva, cana de açúcar, milho e feijão em diferentes regiões da bacia do rio São Francisco, visando identificar os elementos climáticos que mais influenciam a evapotranspiração de referência (ET0) nas localidades de Pirapora-MG, Jaíba-MG, Barreiras-BA e Petrolina-PE. Adicionalmente, procurou-se identificar as localidades que apresentam maior semelhança em relação aos parâmetros avaliados, por meio da aplicação da análise de cluster, e determinar as relações de equivalência entre as culturas estudadas, integrando os parâmetros relativos aos elementos climáticos e às características das culturas e do solo. Com base na estatística multivariada de componentes principais, identificou-se que os elementos climáticos que possuem maior significância na estimativa da ET0 foram distintos para cada local. O modelo com duas componentes explicou 90%, 88%, 95% e 97% da variância total para as localidades de Pirapora, Jaíba, Barreiras e Petrolina, respectivamente. Por estar situada em uma região de clima semiárido, Petrolina apresentou elevada demanda hídrica pelas culturas, sendo comprovado este comportamento com a análise de cluster. As relações de equivalência permitiram comparar as demandas hídricas das diferentes culturas, fornecendo, em termos gerais, um parâmetro comparativo entre as culturas, e discriminando qual cultura será mais adequada em função da disponibilidade hídrica na bacia do rio São Francisco.
Palavras-chave:Agricultura irrigada. Balanço hídrico. Parâmetros climáticos. Evapotranspiração.
DOI: 10.5935/1806-6690.20180046 *Author for correspondence
Received for publication on 23/08/2016; approved 26/10/2017
1Parte da Dissertação de Mestrado do primeiro autor, pesquisa financiada pelo CNPq
2Departamento de Engenharia Agrícola, Universidade Federal de Viçosa/UFV, Viçosa-MG, Brasil, [email protected],
INTRODUCTION
The São Francisco River basin covers an area of
638,466 km2, representing 7.5% of the national territory.
Most of the basin (58%) is in a semi-arid region, which explains the low average annual precipitation (1,033 mm) when compared to the national average (1,761 mm), and extended periods of drought and high evapotranspiration are frequent (AGÊNCIA NACIONAL DE ÁGUAS, 2013).
Evapotranspiration is the most representative parameter to set crop water needs, and it is based on the combination of climatic elements such as maximum and minimum temperature, sunshine hours or solar radiation, wind speed and relative humidity (ALENCAR; SEDIYAMA; MANTOVANI, 2015; WIDMOSER, 2009). Crop evapotranspiration represents the main process of groundwater loss, directly affecting the availability and sustainability of water resources, and, consequently,
the growth of plants (LANGENSIEPEN et al., 2009).
Knowing it is essential in applications related to the areas of hydrology, climate change impacts and droughts
(SENATOREet al., 2015).
Determination of the relative effects of the elements which influence the process of evapotranspiration is of significant importance within the context of irrigated agriculture, especially in semi-arid climate areas. By means of these considerations, it is possible to define the best strategy for the rational use of water (ANDRADE; SILVEIRA; AZEVEDO, 2003).
Therefore, multivariate statistics applied to principal components analysis may be used to define a set of variables that explain the maximum of the variance function. For this purpose, a linear combination of data is used to determine the variables which most influence the evapotranspiration process in each location (ARRUDA
et al., 2012; ISLABÃO et al., 2013; MANDALet al.,
2008; REID; SPENCER, 2009).
Multivariate statistics may also be employed for the grouping between individuals based on their characteristics. The criterion for the formation of groups is the homogeneity within the group and the differences
between them (HATVANI et al., 2011; RUHOFF;
SALDANHA; COLLISCHONN, 2009).
Knowledge of the water need of different crops in places at which there is the possibility of conflict due to the use of water is of great value, once this allows for the development of equivalence relations among crops and provides guidance for the zoning or allocation of crops in a given region, in a water crisis scenario.
In this context, the objectives of this study were: (1) to identify the climatic elements that most influence
the reference evapotranspiration (ET0) at four locations
in the São Francisco river basin using multivariate statistics with principal component analysis; (2) to
estimate the average ET0 for a period of 10 years with
the purpose of assessing the similarity among locations regarding this parameter using cluster analysis; (3) to determine the water need of crops to be supplied via irrigation, and the equivalence relations for banana, mango, grape, sugarcane, maize and beans crops, integrating the parameters related to climatic elements and to the characteristics of the crops and soil.
MATERIAL AND METHODS
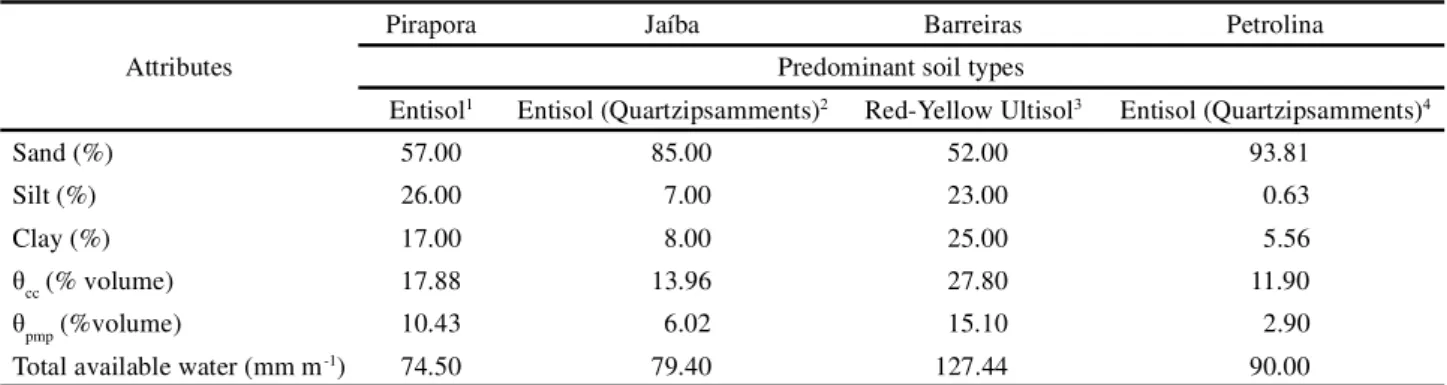
The locations used in this study were Pirapora-MG, Jaíba-MG, Barreiras-BA and Petrolina-PE. They were chosen because they are in regions with a significant area of irrigated agriculture, for presenting distinct climatic characteristics and availability of historical series of climate data. The Pirapora region lies in the region of the upper São Francisco, being characterized by the Aw climate, according to the Köppen climate classification, which is described as being a Tropical climate with the occurrence of rain in the summer and having a dry winter, as shown in Figure 1a. Jaíba and Barreiras are located in the region of the Medium São Francisco; however, Barreiras also presents the Aw-type climate, while Jaíba has the As-type climate characterized as a Tropical
climate with a dry summer. According to Alvares et al.
(2013), Petrolina is in the sub-medium region of the São Francisco River and has the BSh-type climate, that is, a dry, semi-arid climate, whose occurrence is common in regions of low latitudes and altitudes. As shown in table 1, the altitude of the weather stations varies from 370 m to 505 m, in Petrolina and Pirapora, respectively. Figure 1b shows the digital model of the elevation of the São Francisco river basin, in which it is possible to see the spatialization of the altimetry of the basin.
Table 1 shows the information of the weather stations used in the study and Table 2 shows the years with availability of data for the locations studied.
Maximum temperature (Tmax) and minimum
temperature (Tmin) data were obtained in Celsius degrees
(°C); number of sunshine hours (S) in hours; average relative humidity (RH) in percentage; average wind speed
(W) in m s-¹; and precipitation (P) in mm. All parameters
were obtained daily from the National Institute of Meteorology (INMET).
Figure 1 - Climate types (a) and digital elevation model (b) of the São Francisco basin
Table 1 - Geographic coordinates of the weather stations where data were collected
Weather station Code Latitude (°) Longitude (°) Elevation (m)
Pirapora-MG 83483 -17.35 -44.91 505.24
Mocambinho/Jaíba-MG 83389 -15.08 -44.01 452.00
Barreiras-BA 83236 -12.15 -45.00 439.29
Petrolina-PE 82983 -9.38 -40.48 370.46
scale, according to the methodology described in FAO 56
(ALLENet al., 1998). For this purpose, it was necessary
to estimate the average reference evapotranspiration for
each day of the year, for each of the 10 years of data, in order to obtain a year of daily average data of reference evapotranspiration.
Table 2 - Years of data selected in each weather station to estimate ET0
Weather station Selected Years
Pirapora-MG 1970, 1976, 1990, 1991, 1999, 2000, 2003, 2006, 2011, 2012
Mocambinho/Jaíba-MG 1986, 1987, 1988, 1991, 1996, 1997, 2000, 2001, 2002, 2009
Barreiras-BA 1967, 1969, 1970, 1978, 1979, 2001, 2002, 2003, 2006, 2007
The evapotranspiration of banana, mango, grape, maize, beans and sugarcane crops was estimated daily, taking into consideration the reference evapotranspiration
(ET0), daily average of 10 years, the crop coefficient
Kc (initial, middle and final), and the soil water stress
coefficient Ks, according to Equation 1.
ETc = ETo.Kc.Ks (1)
where: ETc= crop evapotranspiration (mm d-1); ET0
= reference evapotranspiration (mm d-1); K
c= crop
coefficient, dimensionless; Ks = soil water stress
coefficient, dimensionless. The values of Ks were
simulated daily considering the humidity of the soil on that day, according to the methodology described in FAO
56 (ALLENet al., 1998).
The estimates of ET0 for the weather stations of the
studied places were performed with the Penman-Monteith method, according to the model published in FAO 56
(ALLEN et al., 1998), since this is considered the most
accurate compared to the other existing indirect methods (CAI et al., 2007; GAVILAN; BERENGENA; ALLEN,
2007; SENTELHAS; GILLESPIE; SANTOS, 2010; XINGet al., 2008).
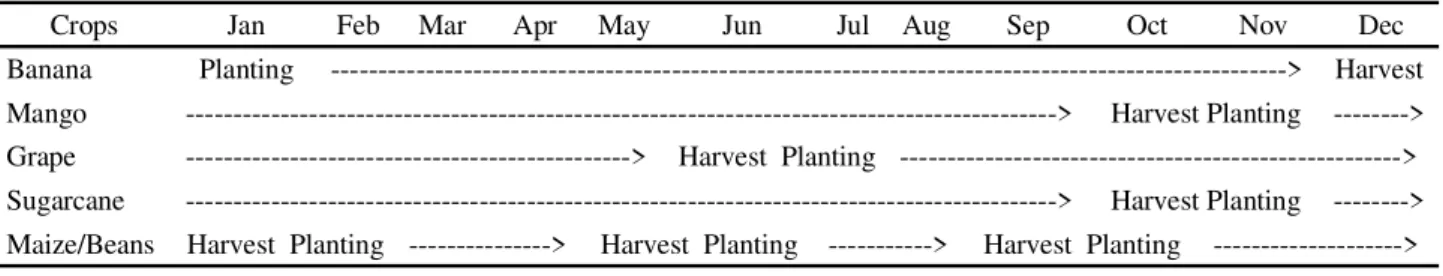
The research was performed considering the simulation within the period of one year. Therefore, the growing of one cycle of bananas, one cycle of mangoes, two cycles of grapes and one crop of sugarcane was standardized according to the common agricultural crop calendar in these regions. Besides the aforementioned crops, for each place, two maize crops were planted in a row in rotation with one cycle of beans.
In this case, the first sowing of maize happened in October and the harvest was in January of the following year, the sowing of the subsequent maize crop occurred in February and the harvest in May, and the sowing of beans took place in mid-June and the harvest in September. The crop calendar used in this study is shown in Table 3, in which it is possible to observe the beginning of each cycle of the perennial crops and the implementation of annual crops.
Table 3 - Crop calendar standardized for banana, mango, grape, sugarcane, maize and beans crops
For simulation purposes, the table of Appendix 8 of the FAO Bulletin 56 was adopted; however, using
the crop coefficient (Kc), which encompasses the average
effects of evaporation on soil and plant transpiration into one single coefficient for each phenological phase of the
crop (ALLEN et al., 1998). The input parameters in the
model from Appendix 8 of FAO 56 are the values of Kc
of each phenological phase (Table 4) and the lengths of the respective development stages (Table 5). The table estimates, for each day of simulation, one value of
Kc*Ks. For this purpose, it considers crop development,
considering inherent characteristics of each crop (depth of the roots system, maximum plant height), as well as soil and climatic elements (wind speed and relative humidity).
Whenever possible, parameters obtained in the experiments performed in the studied places were
adopted, both for the values of Kc and for the length
of the development phases, as can be observed in the references used in Tables 4 and 5. In the absence of these, tabulated values from publication 56 of FAO
were used (ALLEN et al., 1998). In order to make the
simulations closer to local conditions, the physical attributes of the soils of the region were used and they are shown in Table 6.
To obtain the equivalence relations among crops, initially, the water requirements of each crop and at each irrigated perimeter were grouped annually with the intention of obtaining the average annual water need to be supplied via irrigation, that is, considering the average local rainfall regime.
Equivalence relations ultimately aim to compare the water needs of the crops of the distinct regions to be supplied via irrigation. For this purpose, the calculation was performed by comparing the water needs of a crop at various places, or by comparing the water needs of several crops at the same place.
The model of multivariate statistics of principal components was used to identify the climatic parameters
that have greater importance to the estimation of ET0.
Crops Jan Feb Mar Apr May Jun Jul Aug Sep Oct Nov Dec
Crops Kcini Kcmid Kcend Source
Banana 1.00 1.20 1.10 Allenet al. (1998)
Mango 0.70 1.00 0.60 Teixeiraet al. (2008)
Grape 0.30 0.85 0.45 Allenet al. (1998)
Sugarcane 0.75 0.87 0.52 Carmo (2013)
Maize 0.50 1.20 0.60 Doorenbos and Kassan (1979)
Beans 0.40 1.15 0.35 Allenet al. (1998)
Crops Lini Ldev Lmid Lend Source
Banana 120 60 180 5 Allenet al. (1998)
Mango 30 100 95 70 Embrapa (2005)
Grape 30 40 75 15 Freitas, Ramos and Costa (2006)
Sugarcane 22 90 195 41 Carmo (2013)
Maize 20 35 40 25 Allenet al. (1998)
Beans 15 25 30 20 Allenet al. (1998)
Attributes
Pirapora Jaíba Barreiras Petrolina
Predominant soil types
Entisol1 Entisol (Quartzipsamments)2 Red-Yellow Ultisol3 Entisol (Quartzipsamments)4
Sand (%) 57.00 85.00 52.00 93.81
Silt (%) 26.00 7.00 23.00 0.63
Clay (%) 17.00 8.00 25.00 5.56
θcc (% volume) 17.88 13.96 27.80 11.90
θpmp (%volume) 10.43 6.02 15.10 2.90
Total available water (mm m-1) 74.50 79.40 127.44 90.00
Table 4 - Values adopted for Kcini, Kcmid and Kcend for banana, mango, grape, sugarcane, maize and beans crops
Table 5 - Values adopted for the length of each phase of the cycle, in days, for banana, mango, grape, maize and beans crops
Lini, Ldev, Lmid, Lend- length of the initial, development, middle and final phases of the phenological cycle
Table 6 - Physical attributes of the soil adopted for Pirapora, Jaíba, Barreira and Petrolina
Source: 1 - Medeiros (2002); 2 - Moura (2007); 3 - Oliveira, Silva and Campos. (1979); 4 - Nascimento (2009)
Thus, standardization of data was necessary in order to match their units and scales. The average of 10 years for each climatic element at each location, and monthly, was used as follows:
(2)
where, Xij= value observed for the jth repetition of the ith climatic factor; i = average of the climatic factor i;Si = standard deviation of the climatic factor i;Yij= standardized value.
For the principal component analysis, climatic elements were used monthly, unlike the water balance,
which was performed on a daily basis. After extraction, the components presented difficult interpretation and, because of that, the Varimax algorithm was used as a
matrix orthogonal rotation procedure (ANDRADEet al.,
2007).
RESULTS AND DISCUSSION
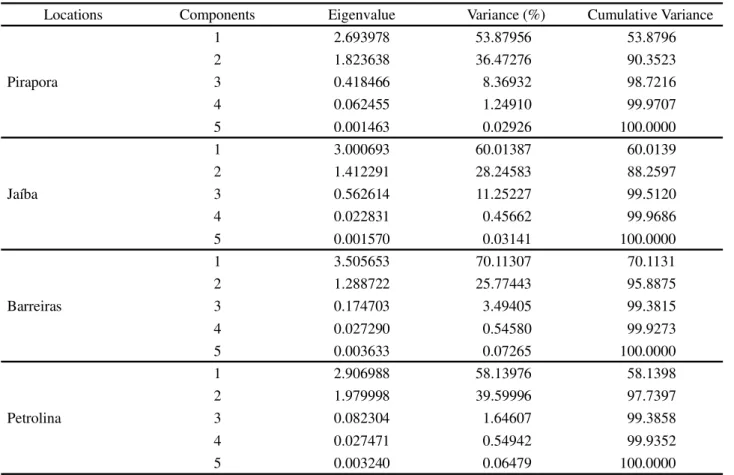
Table 7 shows the results for the principal component analysis. It is possible to observe that the model with two components explained 90%, 88%, 95% and 97% of the total variance for the locations of Pirapora, Jaíba, Barreiras and Petrolina, respectively. It can be stated, such as Andrade, Silveira and Azevedo (2003) did, that the model is capable of combining the information previously distributed in six variables into only two components.
The proposal of Norusis (1990), which states that a component can be used if it presents an eigenvalue above 1, was used as theoretical basis in order to define the model with two variables. It is also important to observe that the first component was responsible for explaining more than 53% of the total variance at all studied locations. Guedes
et al. (2012) emphasize that one of the main characteristics
of the components is related to how they are obtained, being presented in descending order; the first component explains most part of the total variance of data and the second one explains the maximum of variance of the rest of the data, and it is not correlated with the first one.
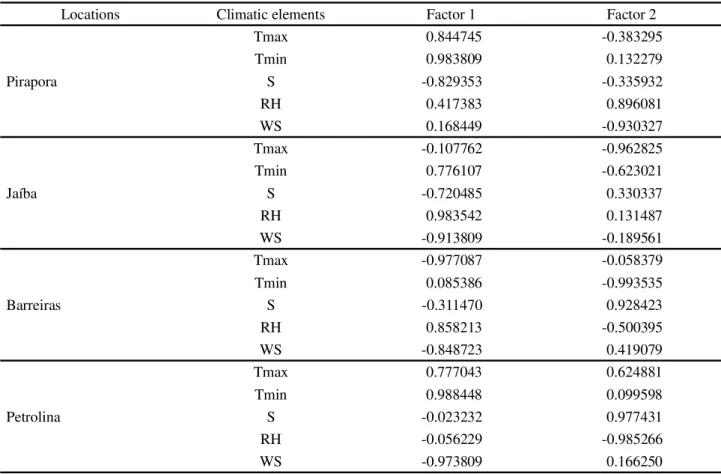
By analyzing Table 8 for the region of Pirapora, the climatic elements that were more important for
the first component were minimum and maximum temperature and sunshine hours. Based on this finding, it can be observed that this component is correlated with the heating of the atmosphere close to the surface.
Regarding Jaíba, the climatic factor that was more significant was relative humidity, followed by wind speed, minimum temperature and sunshine hours. In this case, it can be said that the climatic elements with significant importance to this element (RH, I) are correlated with vapor pressure deficit, that is, by the gradient which
promotes the ET0 process.
Nevertheless, when it comes to Barreiras, located in the same region as Jaíba (region of the Medium São Francisco), the most significant parameters were maximum temperature, relative humidity and wind speed. For Petrolina, minimum temperature, wind speed and maximum temperature were the most significant parameters.
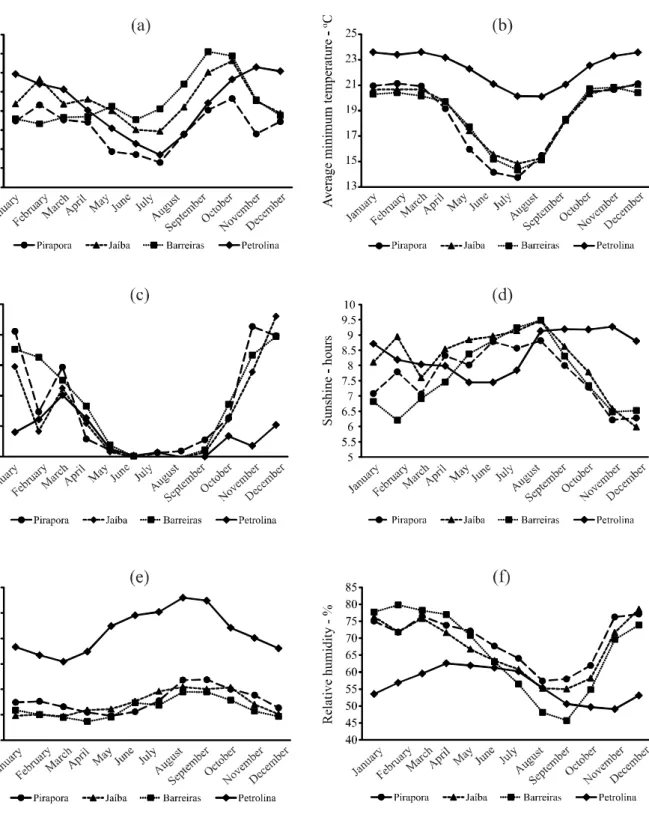
The observed differences regarding the crop water needs are mostly explained by the climatic elements that determine the evapotranspiration process. The region of Pirapora presents a milder climate compared to the other locations (Figures 2a and 2b).
Locations Components Eigenvalue Variance (%) Cumulative Variance
Pirapora
1 2.693978 53.87956 53.8796
2 1.823638 36.47276 90.3523
3 0.418466 8.36932 98.7216
4 0.062455 1.24910 99.9707
5 0.001463 0.02926 100.0000
Jaíba
1 3.000693 60.01387 60.0139
2 1.412291 28.24583 88.2597
3 0.562614 11.25227 99.5120
4 0.022831 0.45662 99.9686
5 0.001570 0.03141 100.0000
Barreiras
1 3.505653 70.11307 70.1131
2 1.288722 25.77443 95.8875
3 0.174703 3.49405 99.3815
4 0.027290 0.54580 99.9273
5 0.003633 0.07265 100.0000
Petrolina
1 2.906988 58.13976 58.1398
2 1.979998 39.59996 97.7397
3 0.082304 1.64607 99.3858
4 0.027471 0.54942 99.9352
5 0.003240 0.06479 100.0000
Locations Climatic elements Factor 1 Factor 2
Pirapora
Tmax 0.844745 -0.383295
Tmin 0.983809 0.132279
S -0.829353 -0.335932
RH 0.417383 0.896081
WS 0.168449 -0.930327
Jaíba
Tmax -0.107762 -0.962825
Tmin 0.776107 -0.623021
S -0.720485 0.330337
RH 0.983542 0.131487
WS -0.913809 -0.189561
Barreiras
Tmax -0.977087 -0.058379
Tmin 0.085386 -0.993535
S -0.311470 0.928423
RH 0.858213 -0.500395
WS -0.848723 0.419079
Petrolina
Tmax 0.777043 0.624881
Tmin 0.988448 0.099598
S -0.023232 0.977431
RH -0.056229 -0.985266
WS -0.973809 0.166250
Table 8 - Results of the factors after rotation of the component for Pirapora, Jaíba, Barreira and Petrolina
Due to the low rainfall characteristic of semi-arid regions (Figure 2c), Petrolina presents little variation in average monthly sunshine hours throughout the year (Figure 2d), as well as high occurrence of wind (Figure 2e) and low relative humidity (Figure 2f). For this location, maximum temperature values ranging from 29.1 to 35.4 ºC were registered throughout the year, and Teixeira (2010) obtained values between 29.6 and 34.0 ºC for Petrolina between 1965 and 2009.
The average annual precipitation of 10 years obtained for Petrolina is approximately 425 mm while for Pirapora, Jaíba and Barreiras it is around 1,015 mm, 835 mm and 1,060 mm, respectively. According to the Brazilian Climatological Normals of 1961-1990, the accumulated precipitations for the cities of Pirapora, Jaíba, Barreiras and Petrolina are, respectively, 1,057 mm; 805.2 mm (excluding the month of March for lack of data); 1,140 mm and 577.4 mm.
Since the climate of where Petrolina is located is semi-arid, the greater the water need of crops in the
region, once, according to Allenet al. (1998), moist fields
in arid (hot and dry) regions lose large quantities of water that are transferred to the atmosphere due to the process
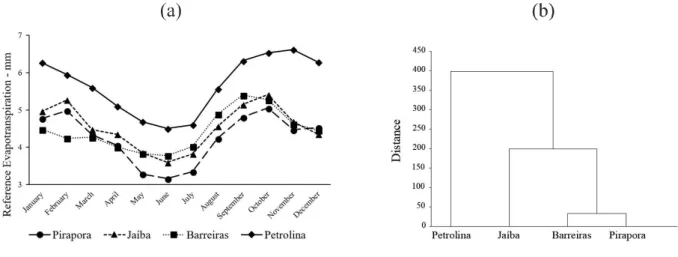
of evapotranspiration because of the large quantity of energy available combined with the high moisture holding capacity of air (Figure 3a).
In Figure 3b, the distinction of locations can be observed due to the existing differences among them, considering the reference evapotranspiration, maximum temperature, minimum temperature, sunshine hours, relative humidity, wind speed and precipitation, using Cluster analysis as grouping technique. Barreiras and Pirapora were put in the same group, because they are located in regions of Aw climate, according to the Köppen classification, which is characterized as Tropical with occurrence of rain in the summer and dry winter (Figure 1a), thus, having similar climatic characteristics.
Integration of the parameters relating to climate, and to the physiological characteristics of crops and soil can be evidenced in the equivalence relations between the crops of banana, mango, grape, sugarcane, maize and
beans, in the locations studied (Figure 4). The equivalence relations were obtained by the ratio between the average annual water need of the crop (columns) and the average annual water need of the crop (lines).
Figure 3 - Monthly behavior of evapotranspiration for the studied places (a) and application of cluster analysis to the evapotranspiration data for the studied places (b)
Figure 4 - Equivalence relations among the water needs for irrigation of banana, mango, grape, sugarcane, maize and beans crops for
the studied places
The values shown by the same shades of gray in Figure 4 refer to the equivalence relations among crops in the same place, corresponding to Pirapora, Jaíba, Barreiras and Petrolina, in this order. The values in white refer to the equivalence relations among crops which are in different places.
these two places, by the soil type and physiological characteristics of the crops. Thus, irrigation of large areas of banana crops, which have a high water need, promotes great impact on water resources in the region, mainly in areas where rainfall is insufficient to meet the water need of crops.
Equivalence relations are nothing but an index which compares the water need of a crop in relation to another, both for distinct locations and for the same location, and it can be used to evaluate the crop water need via irrigation to identify which crop will be, in general, better used in function of the water availability of the region, provided that the conditions, the methodology and the parameters used in this studied are applied.
Therefore, the application the equivalence relations can be used by decision makers for a better planning and management of water resources, aiming for a rational use of water by means of policies that encourage the growing of certain crops in places where there is water surplus for irrigation, while they may also be a restrictive parameter for the growing of crops in regions where there is shortage of water for irrigation.
CONCLUSIONS
1. The model with two components explained 90%, 88%, 95% and 97% of the total variance for the locations of Pirapora, Jaíba, Barreiras and Petrolina. The climatic elements that most influenced the reference evapotranspiration were: in Pirapora, the minimum temperature; in Jaíba, relative humidity; in Barreiras, the maximum temperature; and in Petrolina, the minimum temperature;
2. According to cluster analysis, Barreiras and Pirapora are regions with similar climatic conditions. Jaíba is in an intermediate position and Petrolina differs from the other locations.
3. In general, the equivalence relations can predict which crop is more indicated regarding the water need to be supplied by irrigation, according to the water availability of each place of study.
REFERENCES
AGÊNCIA NACIONAL DE ÁGUAS (BRASIL).Conjuntura dos recursos hídricos no Brasil. Brasília, 2013. 432 p.
ALENCAR, L. P. de; SEDIYAMA, G. C.; MANTOVANI, E. C. Estimativa da evapotranspiração de referência (ETo Padrão FAO), para Minas Gerais, na ausência de alguns dados climáticos.
Revista Engenharia Agrícola, v. 35, n. 1, p. 39-50, 2015.
ALLEN, R. G.et al.Crop evapotranspiration: guidelines for computing crop water requirements. Rome: FAO, 1998. 300 p. (FAO. Irrigation and Drainage Paper, 56).
ALVARES, C. A.et al. Koppen’s climate classification map for Brazil. Meteorologische Zeitschrift, v. 22, n. 6, p. 711-728, 2013.
ANDRADE, E. M. de; SILVEIRA, S. S.; AZEVEDO, B. M. de. Investigação da estrutura multivariada da evapotranspiração na Região Centro Sul do Ceará pela análise de componentes principais. Revista Brasileira de Recursos Hídricos, v. 8, n. 1, p. 39-44, 2003.
ANDRADE, E. M. deet al. Seleção dos indicadores da qualidade das águas superficiais pelo emprego da análise multivariada.
Revista Engenharia Agrícola, v. 27, p. 683-690, 2007. ARRUDA, N. P.et al. Correlação entre precursores e voláteis em café arábica brasileiro processado pelas vias seca, semiúmida e úmida e discriminação através da análise por componentes principais.Química Nova, v. 35, n. 10, p. 2044-2051, 2012.
CAI, J. et al. Estimating reference evapotranspiration with the FAO Penman–Monteith equation using daily weather forecast messages. Agricultural and Forest Meteorology, v. 145, p. 22-35, 2007.
CARMO, J. F. A. do.Evapotranspiração da cana de açúcar irrigada por gotejamento subsuperficial no Submédio do Vale do São Francisco. 2013. 86 f. Dissertação (Mestrado em Engenharia Agrícola) - Universidade Federal do Vale do São Francisco, Juazeiro, BA, 2013.
DOORENBOS, J.; KASSAM, A. H.Yield response to water. Rome: FAO, 1979. 193 p. (FAO. Irrigation and Drainage Paper, 33).
EMPRESA BRASILEIRA DE PESQUISA AGROPECUÁRIA. SIMPÓSIO DE MANGA DO VALE DO SÃO FRANCISCO, 1., 2005, Juazeiro.Palestras... Petrolina: Embrapa Semi-Árido, 2005. 295 p.
FREITAS, W. S.; RAMOS, M. M.; COSTA, S. L. Demanda de irrigação da cultura da uva na bacia do rio São Francisco.
Revista Engenharia Agrícola, v. 10, n. 3, p. 563-569, 2006.
GAVILAN, P.; BERENGENA, J.; ALLEN, R. G. Measuring versus estimating net radiation and soil heat flux: impact on Penman–Monteith reference ET estimates in semiarid regions.
Agricultural Water Management, v. 89 n. 3, p. 275-286,
2007.
GUEDES, H. A. S. et al. Aplicação da análise estatística multivariada no estudo da qualidade da água do Rio Pomba, MG. Revista Engenharia Agrícola, v. 16, n. 5, p. 558-563, 2012.
HATVANI, G. I. et al. Analysis of long-term water quality changes in the Kis-Balaton Water Protection System with time series, cluster analysis and Wilk’s lambda distribution.
Ecological Engineering, v. 37, p. 629-635, 2011.
analysis.Revista Brasileira de Ciência do Solo, v. 37, n. 1, p. 168-176, 2013.
LANGENSIEPEN, M. et al. Quantifying the uncertainties of transpiration calculations with the Penman–Monteith equation under different climate and optimum water supply conditions.
Agricultural and Forest Meteorology, v. 149, n. 6/7, p. 1063-1072, 2009.
MANDAL, U. K. et al. Evaluating impact of irrigation water quality on a calcareous clay soil using principal component analysis.Geoderma, v. 144, n. 1/2, p. 189-197, 2008.
MEDEIROS, S. de S.Indicadores para gerenciamento do uso da água no perímetro irrigado de Pirapora - MG. 2002. 125
f. Dissertação (Mestrado Engenharia Agrícola) - Universidade Federal de Viçosa, Viçosa, MG, 2002.
MOURA, B. R. de. Avaliação do uso da água em fruteiras irrigadas no projeto Jaíba. 2007. 115 f. Dissertação (Mestrado Meteorologia Agrícola) - Universidade Federal de Viçosa, Viçosa, MG, 2007.
NASCIMENTO, P. dos S.Análise do uso da curva de retenção de água no solo determinada por diferentes métodos e planilha para manejo da irrigação. 2009. 93 f. Dissertação (Mestrado em Ciências Agrárias) - Universidade Federal do Recôncavo da Bahia, Cruz das Almas, 2009.
NORUSIS, M. J.SPSS Base System User’s Guide.Chicago, 1990. 520 p.
OLIVEIRA, F. A.; SILVA, J. I. S.; CAMPOS, T. G. Evapotranspiração e desenvolvimento radicular do milho irrigado. Pesquisa Agropecuária Brasileira, v. 28, p. 1407-1415, 1979.
REID, M. K.; SPENCER , K. L. Use of principal components analysis (PCA) on estuarine sediment datasets: the effect of
data pre - treatment.Environmental Pollution, v. 157, p. 2275-2281, 2009.
RUHOFF, A. L., SALDANHA, C. B., COLLISCHONN, W. Análise multivariada do processo de evapotranspiração em áreas de cerrado e cana-de-açúcar. Revista Brasileira de Recursos Hídricos, v. 14, n. 4, p. 137-146, 2009.
SENATORE, A. et al. Regional scale modeling of reference evapotranspiration: intercomparison of two simplified temperature and radiation-based approaches. Journal of Irrigation Drainage Engineering, v. 141, n. 12, 2015.
SENTELHAS, P. C., GILLESPIE, T. J., SANTOS, E. A. Evaluation of FAO Penman–Monteith and alternative methods for estimating reference evapotranspiration with missing data in Southern Ontario, Canadá.Agricultural Water Management,
v. 97, n. 5, p. 635-644, 2010.
TEIXEIRA, A. H. de C. et al. Energy and water balance measurements for water productivity analysis in irrigated mango trees, Northeast Brazil. Agricultural and Forest Meteorology, v. 148, p. 1524-1537, 2008.
TEIXEIRA, A. H. de C.Informações agrometeorológicas do Polo Petrolina, PE/ Juazeiro, Ba - 1963 a 2009. Petrolina: Embrapa Semiárido, 2010. 23 p.
WIDMOSER, P. A discussion on and alternative to the Penman-Monteith equation. Agricultural and Forest Meteorology, v. 96, n. 4, p. 711-721, 2009.
XING, Z. et al. Validating evapotranspiration equations using Bowen Ratio in New Brunswick.Sensors, v. 8, n. 1, p. 412-428, 2008.