Population Structure of
Lutjanus purpureus
(Lutjanidae - Perciformes)
on the Brazilian coast: further existence evidence of a single species
of red snapper in the western Atlantic
GRAZIELLE GOMES1,2, IRACILDA SAMPAIO1 and HORACIO SCHNEIDER1
1Laboratório de Genética e Biologia Molecular, Instituto de Estudos Costeiros, Universidade Federal do Pará,
Campus Universitário de Bragança, Alameda Leandro Ribeiro, s/n, 68600-000 Bragança, PA, Brasil
2Laboratório de Genética Aplicada, Instituto de Estudos Costeiros, Universidade Federal do Pará,
Campus Universitário de Bragança, Alameda Leandro Ribeiro, s/n, 68600-000 Bragança, PA, Brasil
Manuscript received on November 10, 2010; accepted for publication on September 5, 2011
ABSTRACT
The present study focus on the mitochondrial control region to investigate phylogeographic patterns and population structure in Lutjanus purpureus, and to evaluate the genetic similarity between L. purpureus and
L. campechanus. For the initial analysis, 810 base pairs sequence from control region were obtained from 239 specimens of L. purpureus collected from four localities off the Brazilian coast. The results revealed the presence of a single panmictic population characterized by high values of genetic diversity. The 299 base pairs hypervariable portion were used for the combined analysis of L. purpureus and L. campechanus, being 275 haplotypes identified in the 414 specimens. Phylogenetic tree and haplotype network did not indicate phylogeographic substructuring between the two species, but rather an intense intermingling of individuals. Considering their marked morphological similarity, the molecular data presented here indicate that only one species of red snapper exists in the western Atlantic.
Key words: control region, Lutjanus purpureus.
Correspondence to: Iracilda Sampaio
E-mail: ira@ufpa.br
INTRODUCTION
The family Lutjanidae includes four subfamilies –
Etelinae, Apsilinae, Paradichthyinae and Lutjaninae
– that together encompass 107 species (Iwatsuki et
al. 1993, Nelson 2006, Moura and Lindeman 2007),
20 of which are found in the western Atlantic (Allen
1985, Cervigón 1993). Most snapper species are
commercially important fishery resources, exploited
in a predatory fashion on either an industrial or an
artisanal scale, as in the case of the red snapper,
Lutjanus purpureus
(Poey 1867), known in Brazil
as the
pargo
or
vermelho
. According to Cervigón
(1993) and Allen (1985), this species is distributed
throughout the Caribbean, south of Cuba, and
Brazil - from northeast as far south as the state of
Bahia. However, some authors such as Carpenter
and Nelson (1971) and Rivas (1966) argue that the
species can be found in some parts off the coast of
the United States. The species is found primarily
at depths of between 30 and 160 meters in areas
with a sandy or rocky bottom (Paiva 1997), but
is especially common at 70-120 m (Allen 1985).
The adults are normally either solitary or found
in small groups, whereas the juveniles
congregate
(Annals of the Brazilian Academy of Sciences)
in large shoals (Szpilman 2000). Long-lived, but
slow-growing (R.F.C. Souza, unpublished data)
the largest individuals of this species may reach a
total length of 100 cm, although most adult fish are
around 65 cm (Allen 1985).
Off the northern and eastern coast of Brazil,
the species is catched mainly on the continental
shelf and oceanic reefs (Ivo and Hanson 1982).
Industrial harvesting began in Brazil in the 60s, and
concentrated on the oceanic reefs off the northeastern
coast (Fonteles-Filho 1972). Subsequently, the focus
shifted to the continental platform, from the state of
Ceará westwards to the Amazon coast of the states
of Amapá, Pará, and Maranhão (Ivo and Sousa
1988, Paiva 1997). In the present day, the species is
harvested mainly off Amapá and Pará.
Given the implications of such processes
for the maintenance of stocks, there is growing
interest in the genetic structure of the populations
of commercially important fish species (Garber et
al. 2004, Palstra et al. 2007, Santa Brígida et al.
2007, Rodrigues et al. 2008, Silva-Oliveira et al.
2008). These and other studies have generated
an essential database for the development of
systematic management strategies for fish stocks.
The data also permit the analysis of evolutionary
processes and past demographic events (Frankham
et al. 2004). Studies of this kind usually focus on
the mitochondrial control region and microsatellite
markers, highly variable repeated sequences found
in the nuclear genome.
Very little is known about the population
structure of the red snappers of the western Atlantic,
especially regarding molecular markers. However,
Salles et al. (2006) conducted a pioneering
study using a molecular tool (the mitochondrial
cytochrome b gene, together with morphological
variables) for the analysis of the structure of the red
snapper populations off the northern coast of Brazil.
The results of this study indicated the presence of
two distinct stocks of
L. purpureus
on the northern
coast of Brazil associated with different fishery
zones. Four haplotypes were identified, two of which
were associated with the western zone (47°-49° W),
coinciding with the mouth of the Amazon, and two
with the eastern zone (43°-46°W). A similar division
was identified in the morphometric study of
Sousa-Júnior et al. (2002), suggesting a fragmentation
degree of the populations in this region, based on its
vast area and environmental heterogeneity.
In their analysis of biological characteristics,
oceanographic conditions, and the evolution of
fishing practices, Ivo and Hanson (1982) formulated
two hypotheses to define the Brazilian stocks of red
snapper and their migratory patterns. Their first
step was to divide the region into four zones, two
of which are mentioned above. These zones (III and
IV) are associated with the Amazon estuary, and
characterized by an extensive continental shelf, and
relatively low salinity levels. By contrast, zones I
and II refer to the Caiçara and Ceará oceanic reefs,
which are separated from the continental shelf by
deep depressions. These areas are characterized
by high salinity, and a predominance of calcareous
algae on the ocean floor.
One hypothesis presented by Ivo and Hanson
(1982) is that only a single stock of Brazilian
red snappers exists. This stock is composed of
individuals originating from distinct breeding
seasons. The alternative to this would be the presence
of two stocks, resulting from geographically distinct
breeding populations. In both cases, the adults migrate
between feeding areas on the continental shelf
(zones III and IV), to breeding areas on the oceanic
reefs (zones I and II). The eggs and larvae would be
transported to nursery areas on the continental shelf
by the Guianas current, the difference being that, in
the case of the second hypothesis, each stock would
migrate to breed at a different reef.
single genetic stock. Furthermore, comparisons with
a second snapper species,
Lutjanus campechanus
revealed greater variation within than between
populations, indicating a lack of phylogeographic
structuring, and the probable existence of only a
single species of red snapper in the western Atlantic,
as suggested by Cervigón (1993). These findings are
supported by the marked morphological similarities
of the two forms (Rivas 1966, Allen 1985, Moran
1988, Cervigón 1993), as well as their many
shared characteristics, such as their longevity, slow
maturation, and reproductive patterns (Moran 1988,
Wilson and Nieland 2001, Souza et al. 2003, R.F.C.
Souza, unpublished data). The existence of a single
red snapper species in the western Atlantic would
also be consistent with the situation observed in
other
Lutjanus
species (Cervigón 1993).
In general, taxonomic uncertainties arise from
a lack of data for analyses. The adequate definition
of species is a decisive step in the evaluation
of conservation status, and the development of
effective management strategies (Frankham et
al. 2004). In the present study, the mitochondrial
control region was analyzed in order to evaluate the
genetic structure and phylogeographic attributes of
Brazilian populations of
L. purpureus
. In addition
to the expansion of the analysis of Gomes et al.
(2008), in terms of the number and distribution
of samples, a complementary analysis of the
hypervariable portion of the control region included
the sequences obtained from western Atlantic
L.
campechanus
by Garber et al. (2004).
MATERIALS AND METHODS
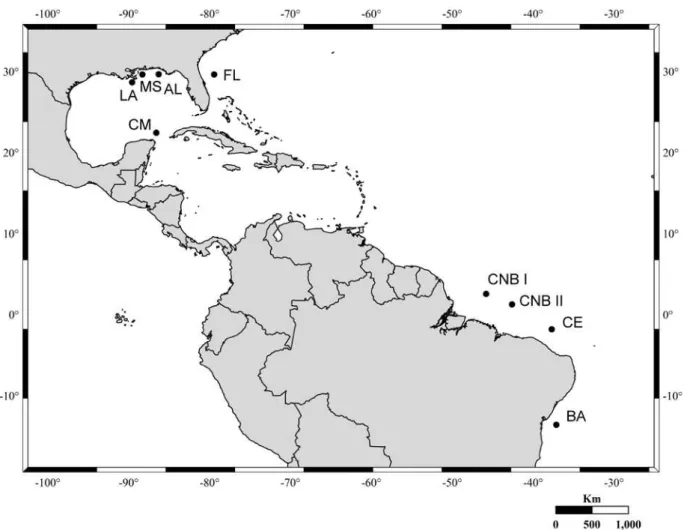
SAMPLES
The
L. purpureus
specimens analyzed in the present
study were collected at four areas on the Brazilian coast
(Fig. 1), two in northern coast of Brazil, one in Ceará
and one in Bahia, providing a representative sample of
the Brazilian distribution of the species (Allen 1985,
Cervigón 1993). The samples from northern coast
were obtained from local fishing ports, as well as the
Northern Regional Center for Fishery Research and
Development (CEPNOR frm Portuguese), as part of
collaboration with the Universidade Federal Rural
da Amazonia (UFRA). The samples from Ceará
and Bahia were obtained from fishing companies
in the cities of Fortaleza and Salvador, respectively.
Only specimens with a reliable known origin were
included in the study. All procedures were carried out
according to the international practices for animal use
and care under the control of an internal committee of
the Universidade Federal do Pará, Brazil.
Morphological identification of the specimens
was carried out in the field, and then tissue samples
(muscle and/or tongue) were extracted and taken to
the Genetics and Molecular Biology Laboratory of
the Bragança Campus of the Universidade Federal
do Pará (UFPA), where they were stored in the
Lutjanidae tissue bank.
In order to test the genetic differentiation
hypothesis proposed by Sousa-Júnior et al. (2002)
and Salles et al. (2006), the samples from northern
coast of Brazil (CNB) were divided into two groups,
CNB I and CNB II, according to a longitudinal
gradient. Group I included all the specimens
captured between longitudes 46° and 50° W, while
Group II included the individuals taken between
43° W and 45° W. This subdivision follows the red
snapper fishery zoning scheme of Ivo and Hanson
(1982), in which “subarea IV” corresponds to CNB
I, and “subarea III” to CNB II.
A total of 239 specimens of
L. purpureus
were
collected for the present study, 119 of which from
area CNB I, 49 from CNB II, 43 from Ceará, and
28 from Bahia. An additional 175 sequences of the
congener
L. campechanus
were obtained from the
literature (Garber et al. 2004). These specimens
were collected in the western Atlantic and the
Gulf of Mexido, and include six individuals from
EXTRACTION OF DNA, AMPLIFICATION AND SEQUENCING OF THE MITOCHONDRIAL CONTROL REGION
Isolation of the genomic DNA was carried out using
the technique developed by Sambrook and Russel
(2001), which involves digesting enzymes (RNase,
Proteinase K), phenol, chloroform, and isoamyl
alcohol for the precipitation of the proteins, and alcohol
(isopropanol and ethanol) for the precipitation of the
DNA. The mitochondrial control region was isolated
and amplified using the Polymerase Chain Reaction
(PCR) technique, using the primers
Dloop-A-5’-TTCCACCTCTAACTCCCAAAGCTAG-3’ and
Dloop-G-5’-CGTCGGATCCCATCTTCAGTGT
TATGCTT-3 (Lee et al. 1995), which are located
on the transfer RNA (tRNAs) that flank the control
region, the proline and phenylalanine tRNAs,
respectively. Additionally, the primers
Dloop-F-5’-ACTTTCATCGACGCTTGCA-3’ and
Dloop-R-5’GTGATCTTAGGAGTATAGGG-3’ were used to
isolate the hypervariable region described by Garber
et al. (2004), and thus permitting the analysis of
practically the whole control region. Figure 2 shows
the location of the hypervariable region sequenced
by Garber et al. (2004), and the fragments sequenced
by Gomes et al. (2008) and in the present study.
deoxynucleotides (1.25mM), 2.5 µL of the
Taq
enzyme buffer (10 x), 0.75 µL of MgCl
2(50mM),
approximately 100 ng of the total DNA extracted from
the sample, 0.25 µL of each primer (200 ng/µL), 0.2
µL of Taq DNA polymerase (5U/µL - Invitrogen) and
sterile distilled water to complete the final reaction
volume. The amplification protocol was as follows:
initial denaturation for 3 minutes at 94°C, followed
by 35 cycles of 30 seconds at 94°C (denaturation), 1
minute at 57°C (hybridization) and 2 minutes at 72°C
(extension). At the end of the 35 cycles, there was a
final extension of 7 minutes at 72°C.
The amplicons were purified using the
ExoSAP-IT kit (Amersham Pharmacia Biotech
Inc., UK) according to the maker’s instructions.
Once purified, the samples were sequenced using
the dideoxyterminal method of Sanger et al. (1977)
with a Big Dye reagent kit (ABI Prism
TMDye
Terminator Cycle Sequencing Reading Reaction).
The precipitated product was sequenced in an
ABI 3100 automatic capillary sequencer (Applied
Biosystems – Perkin Elmer). The primers used for
the sequencing reaction were Dloop-A (Lee et al.
1995) and Dloop-F (Garber et al. 2004).
SEQUENCE EDITION AND ALIGNMENT
The sequence files and the electropherograms were
transferred to a computer for alignment and edition,
using BioEdit (Hall 1999). Once the nucleotides
were conferred, the sequences containing errors
or uncertainties were corrected. An automatic
multiple alignment was then performed in the
Clustal-X application (Thompson et al. 1997),
followed by a new visual inspection and correction
of the insertions or deletions codification as
necessary. Two databases were produced, the first
covering the 810 bp of the mitochondrial control
region identified in the Brazilian specimens of
L. purpureus
. The second set of data covered only
the hypervariable portion of the control region – a
sequence of 299 bp – including both
L. purpureus
and
L. campechanus
.
Saturation of the data was analyzed by DAMBE,
version 4.2.13 (Xia and Xie 2001), which plotted
mutation rates (transitions and transversions) as a
function of the genetic divergence among the sequences.
ANALYSIS OF PHYLOGEOGRAPHIC PROCESSES AND POPULATION GENETICS
The phylogenetic relationships among haplotypes
were evaluated through neighbor-joining analyses
using MEGA 4.0 (Tamura et al. 2007). The
significance of the groupings in all generated trees
were estimated using bootstrap analysis, based on
1,000 pseudo-replicates. The distance model used
to construct the phylogenetic tree and the nucleotide
divergence matrix considered the relative difference
between sequences based on pairwise comparisons,
the simplest evolutionary model, with no correction
for superimposed mutations. The first analysis
investigated the phylogenetic relationships of
the control region haplotypes of Brazilian
L.
purpureus
, while the second approach involved a
smaller sequence – the hypervariable portion of the
D-loop – but a wider range of samples, through the
inclusion of
L. campechanus
. For both analyses
specimens of
Lutjanus synagris
collected off the
coast of Bahia were used as outgroup.
Additional parameters included the nucleotide
composition, and the number of polymorphic and
informative sites for parsimony analysis, determined
by MEGA 4.0 (Tamura et al. 2007). The number
of substitutions (transitions and transversions) was
calculated using the Arlequin program (Excoffier et
al. 2005). Within-population genetic diversity was
evaluated based on the indices of haplotype (h) and
nucleotide (�) diversity (Nei 1987) provided by the
programs DnaSP v 5 (Librado and Rozas 2009) and
Arlequin 3.01 (Excoffier et al. 2005). An Analysis
of Molecular Variance, AMOVA (Excoffier et al.
1992), based on 20,000 permutations was used to
evaluate the proportion of genetic variation within
and between
L. purpureus
populations, and between
this species and
L. campechanus
. The latter analysis
was used to look for the possible existence of
distinct genetic stocks in the southwestern (Brazil)
and northwestern (USA and Mexico) Atlantic.
Genetic differentiation between pairs of
populations was evaluated using the Fixation
index,
FST
(Weir and Hill 2002), the significance of
which was determined using 20,000 permutations,
as well as using
F/
Φ
STof AMOVA. The haplotype
network was constructed using the median vector
method available in the NETWORK 4.5 program
(Bandelt et al. 1999).
DEMOGRAPHIC HISTORY AND NEUTRALITY
The mismatch distribution (number of observed
differences between pairs of haplotypes) was used to
evaluate the demographic history of the populations
of
L. purpureus
and
L. campechanus
. This analysis
permits the identification of populations that
were stable, expanding, or have passed through
bottlenecks in the past (Frankham et al. 2004). When
the pairwise differences were plotted on a graph, a
unimodal distribution indicates a sudden explosive
demographic expansion (Slatkin and Hudson 1991,
Rogers and Harpending 1992), whereas stable
populations will present an irregular profile due to
either the stochastic loss of lineages (Slatkin and
Hudson 1991, Aris-Brosou and Excoffier 1996) or
secondary contact among populations following
a long period of isolation (Frankham et al. 2004).
By contrast, populations that have passed through
severe bottlenecks with a drastic reduction in
genetic variation have either a bimodal or a null
distribution, depending on whether the bottleneck
only reduced genetic diversity, or eliminated it
altogether (Frankham et al. 2004).
Excel. The mutation parameters before (
θ
0=
2N
0u
)
and after (
θ
1=
2N
1u
) expansion were determined
using Schneider and Excoffier’s (1999) least-square
approach, using τ as the estimator of expansion time.
The equation τ = 2
ut
(Rogers and Harpending 1992)
was used to estimate the probable expansion time of
the populations, where
u
= 2µ
0K (K = number of
nucleotides and µ
0= mutation rate of the genomic
region). A mutation rate of 10-13% per million
years was used here as the evolutionary rate of the
mitochondrial control region in fish (Brown et al.
1993, Zhang et al. 2006), while generation time was
set at five years, which corresponds to the age at
which female
L. purpureus
reach sexual maturity (
R.F.C. Souza, unpublished data, Souza et al. 2003).
In addition, the raggedness index (Harpending 1994)
and the sum of the squared deviations (SSD) between
observed and expected mismatch distributions were
calculated. These analyses were also run in Arlequin
3.01 (Excoffier et al. 2005), and were used to
validate the estimated expansion model (Schneider
and Excoffier 1999). Significance was estimated
using a parametric bootstrap analysis.
Fu’s (Fs) and Tajima’s (D) neutrality tests
(Tajima 1989, Fu 1997) were run based on 20,000
simulations, in Arlequin 3.01. Values of both
D
and
Fs
were negative when there were an excess
of recent mutations, which may indicate recent
population expansion, or other evolutionary
processes, such as a hitchhiker effect or natural
selection (Fu 1997). Positive values may indicate
balancing selection, population subdivision or
bottlenecks (Tajima 1989).
RESULTS
PHYLOGEOGRAPHY AND POPULATION STRUCTURE INL.PurPurEuS
A total of 810 base pairs (bp) were obtained from
the control region of the 239 Brazilian specimens of
L. purpureus
(Fig. 1). Mean nucleotide composition
was 30.34% for Thymine, 21.33% for Cytosine,
32.32% for Adenine, and 16.01% for Guanine. Just
over a third of the sites (274) were polymorphic,
while 527 were conserved. Of the variable sites, 181
were informative for parsimony analysis, while 93
were singletons. A total of 299 substitutions were
observed, of which, 260 were transitions, and 39
transversions. The plot of transition/transversion
rates vs. genetic distance (not shown) did not
indicate the presence of saturation.
No less than 220 haplotypes were detected in
the 239 specimens, indicating very high levels of
haplotype diversity. The most common haplotype
(72) was shared by only five individuals, but
was recorded in three populations (CNB I, CNB
II and Bahia). No haplotype was recorded in all
four populations. In fact, only 13 haplotypes were
present in more than one individual, which means
that 94.1% of haplotypes were unique, although
most were distinguished by a small number of
mutations. This situation was also reflected in the
predominance (95.5%) of exclusive haplotypes in
the four populations. Genetic distances between
L.
purpureus
haplotypes varied from 0.1% to 6.1%,
while those with the outgroup (
L. synagris
) ranged
from 9.8% to 12.3%. The most divergent haplotype
(207) was recorded in the Bahia population, and
diverged by more than 3.5% in all comparisons. The
red snapper populations present considerable genetic
variability, considering either the haplotype or
nucleotide indices (Table IA). Spatially, the eastern
populations (Bahia and Ceará) were relatively more
polymorphic, with mean nucleotide diversity of
2.8%, despite their much smaller samples.
In order to test the hypothesis that Brazilian
red snappers were divided into distinct genetic
stocks, three different approaches were applied
for the AMOVA. In the first analysis, the western
(CNB I and CNB II) and eastern (Ceará and Bahia)
populations were grouped together. Subsequently,
the populations CNB and Ceará were separated from
a single group. In all three approaches, the majority
of the variation was found within populations, rather
than between populations or groups (Table IIA).
Furthermore, the values of
F
stand
F
/Φ
stconsidering
both the pairwise comparisons and AMOVA,
respectively, were low or negative and not significant,
indicating intense gene flow among populations.
These results point clearly to the existence of a single
panmictic population of red snapper in Brazilian
waters, extending all along the northern coast and as
far south as Bahia. The panmixia of this population
was also supported by the phylogenetic tree (due
to the large number of haplotypes, the figure is not
shown here), in which individuals from different
localities were mixed together in a single clade,
completely lacking any phylogeographic structuring.
The star-shaped haplotype network (Fig. 3A) further
supports the existence of a single genetic stock of
Brazilian
L. purpureus.
The plots of the pairwise differences between
haplotypes were almost invariably unimodal, for
both individual populations and the sample as a
whole, which suggests a process of population
expansion (Fig. 4A). The only exception was the
population from Bahia, which presented an irregular
profile, probably the result of the relatively small
size of the sample from this locality. In addition, the
values of
Fs
(Fu 1997) were significantly negative
Population N Number of
haplotypes Haplotype diversity(h ± sd) Nucleotide diversity(χ ± sd)
(A) Mitochondrial control region L. purpureus
Costa Norte Brasil (CNB I) 119 113 0.999 ± 0.001 0.026 ± 0.013
Costa Norte Brasil (CNB II) 49 49 1.000 ± 0.004 0.025 ± 0.012
Ceará (CE) 43 43 1.000 ± 0.005 0.028 ± 0.014
Bahia (BA) 28 26 0.994 ± 0.011 0.028 ± 0.014
Total 239 220 0.999 ± 0.0006 0.026 ± 0.013
(B) Hypervariable portion L. purpureus
Costa Norte Brasil (CNB I) 119 95 0.994 ± 0.002 0.031 ± 0.016
Costa Norte Brasil (CNB II) 49 43 0.992 ± 0.006 0.029 ± 0.015
Ceará (CE) 43 42 0.998 ± 0.005 0.033 ± 0.017
Bahia (BA) 28 25 0.992 ± 0.011 0.033 ± 0.017
Total 239 173 0.995 ± 0.001 0.031 ± 0.016
L. campechanus
Alabama (AL) 06 06 1.000 ± 0.096 0.026 ± 0.016 Cancún (CM) 13 11 0.961 ± 0.049 0.017 ± 0.010 Louisiana (LA) 06 06 1.000 ± 0.096 0.019 ± 0.012 Mississippi (MS and FH-1) 115 80 0.948 ± 0.017 0.020 ± 0.010 Florida (FL) 35 25 0.936 ± 0.034 0.025 ± 0.013
Total 175 109 0.946 ± 0.014 0.020 ± 0.010
Total Lutjanus 414 275 0.985 ± 0.003 0.028 ± 0.000
TABLE I
Sample size, number of haplotypes and indices of nucleotide and haplotype diversity for: (A) the mitochondrial control region in Brazilian L. purpureus, and (B) the hypervariable portion of the control region in Brazilian L. purpureus
for all populations, which indicates the non-neutral
nature of the marker used here, and supports the
hypothesis of demographic expansion. The values
of
D
(Tajima 1989) were all negative, although they
were only significant for the two western (CNB)
populations and the sample as a whole (Table IIIA).
These results also support the idea that the Brazilian
red snapper population is undergoing expansion, as
well as indicating the occurrence of recent mutations
and haplotypes with very low frequencies. These
conclusions are also supported by the SSD and
raggedness index (Harpending 1994). Given the
mutation rate selected (10-13% per million years),
the values of µ vary from 5.0x10
-8to 6.5x10
-8,
and considering the 810 bps sequenced here and a
generation of five years, values of u ranged from
20,250x10
-8to 26,325x10
-8. The estimated value of
τ was 23,162, which indicates that the expansion of
the Brazilian population of red snappers took place
approximately at 220,000 to 286,000 years ago.
TABLE IIAnalysis of Molecular Variance (AMOVA) for: (A) Brazilian L. purpureus (810 bps of the mitochondrial control region);
(B) western Atlantic L. purpureus and L. campechanus (hypervariable portion of the control region). Populations: CBN:
Northern Brazilian Coast; CE: Ceará; BA: Bahia; RMS: Mississippi; AL: Alabama; LA: Louisiana; FL: Florida; CM: Cancun, Mexico. Significance level: ns: not significant; * = P < 0.05; ** = P < 0.01.
Groupings Variance % variation F /Ф
(A) L. purpureus CNB I, II vs. CE, BA
Between groups -0.07430 Va -0.69 F/ФCT=-0.00688 ns
Between populations 0.06918 Vb 0.64 F/ФSC=0.00636 ns
Within populations 10.80960 Vc 100.05 F/ФST=-0.00047 ns
CNB I, II + Ceará vs. Bahia
Between groups 0.05781 Va 0.53 F/ФCT=0.00533 ns
Between populations -0.05133 Vb -0.47 F/ФSC=-0.00476 ns
Within populations 10.83626 Vc 99.94 F/ФST=0.00060 ns
All populations
Between populations 0.02245 Va 0.21 F/ФST=0.00207 ns
Within populations 10.80960 Vb 99.79
(B) L. purpureus and L. campechanus
(RMS, AL, LA) vs. (FL, CM) vs. (CNB I, II) vs. (CE, BA)
Between groups 0.84621 Va 17.35 F/ФCT=0.173*
Between populations 0.01416 Vb 0.29 F/ФSC=0.003 ns
Within populations 4.01677 Vc 82.36 F/ФST=0.176**
Northern Atlantic vs. Southern Atlantic
Between groups 1.24372 Va 23.67 F/ФCT=0.236**
Between populations -0.00583 Vb -0.11 F/ФSC=-0.001 ns
Within populations 4.01677 Vc 76.44 F/ФST=0.236**
All populations
Between populations 0.75075 Va 15.75 F/ФST=0.157**
L. PurPurEuS AND L. CAMPECHANuS: ONE OR TWO SPECIES?
The 299 bp sequence corresponding to the
hypervariable portion of the control region
was analyzed in 414 individuals representing
L. purpureus
(n=239) and
L. campechanus
(n=175) from a range of localities (Fig. 1). The
L.
campechanus
sequences (Garber et al. 2004) were
obtained from GenBank (access codes:
AF356881-7004; AF356750-776; AY153500-23). The
hyper-variable region described by Garber et al. (2004)
was located in the second half of the control region,
roughly between nucleotides 420 and 720 (Fig. 2).
The mean overall nucleotide composition
(considering all 414 specimens) was 32.2% for
Thymine, 20.8% for Cytosine, 26.3% for Adenine,
and 20.7% for Guanine. As for the control region
Fig. 3 - Haplotype networks based on (A) the mitochondrial control region (810 bps) of Brazilian L.
as a whole, just over a third (101) of sites were
polymorphic, while 195 were conserved.
Sixty-three of the sites were informative for parsimony
analysis, while 38 were singletons. There were
122 substitutions, 94 of which were transitions,
and 28 transversions.
A total of 275 haplotypes were observed in the
414 specimens. When the sites containing deletions
were omitted from the analysis, this total dropped
to 240, although the overall pattern of frequency
and distribution was maintained. The most common
haplotype (14) was shared by 43 individuals
representing all populations except CNB II and
but overall, only seven haplotypes were shared by
the two species, while the others were exclusive
to either
L. purpureus
(approximately 60% of the
total) or
L. campechanus
(37%). However, most
of these haplotypes were distinguished by a small
number of mutations.
Genetic divergence between
L. purpureus
and
L. campechanus
haplotypes varied from
0.4% to 9.3% (average of 2,9%), and the most
divergent haplotype (272) was from Florida. Most
haplotypes varied by less than 3%, however, even
when comparing species such as the value of 0.7%
recorded between individuals of the Mississippi and
western Brazilian populations. These results and
their implications are very similar to those found
above for the control region (810 bps) in Brazilian
L. purpureus
. Genetic variation were relatively high,
whether considering either haplotype or nucleotide
diversity. This variation was greatest in the Brazilian
L. purpureus
, in particular the eastern populations,
in which nucleotide diversity values were above 3%.
Overall, however, the pattern of genetic diversity
was similar in the two species (Table IB).
Once again, three different approaches
were used for the AMOVA (Table IIB). The first
was based on four main geographic groups – the
western (CNB I and II) and eastern (Ceará and
Bahia) Brazilian groups, a Gulf group (Alabama,
Louisiana, and Mississippi), and a Caribbean group
(Florida and Cancún). In the second analysis, the
Population N τ θ0 θ1 Variance SSD P Raggedness P Fs D
(A) L. purpureus
CNB I 119 23,971 (0,000-5,998)0.063
87,544 (41,548-99999,000)
50,557 0.0013 0.6950 0.0009 0.9980 -23.894** -1.544*
CNB II 49 20,625 2,215
(0,000- 12,052)
106,948 (52,573-99999,000)
41,357 0.0017 0.7360 0.0018 0.9850 -24.157** -1.458*
Ceará 43 24,785 0.005
(0,000- 6,291)
129,580 (60,233- 99999,000)
45,012 0.0013 0.9090 0.0022 0.9730 -24.067** -1.332ns
Bahia 28 23,734 0.077
(0,000-6,253)
106,147 (48,171-99999,000)
61,046 0.0058 0.4280 0.0066 0.6790 -7.360* -1.396ns
Total 239 23,162 0.775
(0,000-5,955)
96,714 (54,292-99999,000)
49,553 0.0010 0.6410 0.0008 0.9930 -23.630** -1.704**
(B) L. purpureus and L. Campechanus
L. purpureus 239 9,088 1,092 (0,000-5,486)
69,453 (30,547-99999,000)
13,284 0.0005 0.7470 0.0029 0.9020 -24.189** -1.086ns
L. campechanus 175 6,742 0.004 (0,000-3,143)
29,966 (12,284-99999,000)
13,195 0.0015 0.6830 0.0081 0.7230 -24.905** -1.434*
Total 414 7,414 (0,000-13,897)2,858
65,566 (23,496-99999,000)
16,963 0.0009 0.5940 0.0022 0.9290 -23.997** -1.275ns
TABLE III
Results of the analysis of the pairwise differences (mismatch) between the control region haplotypes of: (A) Brazilian L. purpureus, and (B) western Atlantic L campechanus and L. purpureus.
specimens were grouped by species, representing the
northwestern (
L. campechanus
) and southwestern
(
L. purpureus
) Atlantic. The final approach was to
include all the specimens in a single group.
As for the previous analysis of the complete
control region in
L. purpureus
, the majority of
the variation recorded in all three approaches
was found within, rather than between groups.
However, a moderate, but significant process of
differentiation was observed between the two
species (
F
/Ф
CT= 0.236,
P
< 0.01; see Table II),
with significant values of
F
/Ф
ST(
F
/Ф
ST= 0.176;
0.236,
P
< 0.01; see Table II). The pairwise
F
stcomparisons reconfirmed panmixia in the Brazilian
snappers, with low or negative (non significant)
values between all populations. A similar situation
was recorded for
L. campechanus
(Table IV).
However, when comparisons were made between
species, the
F
stvalues were significant in all cases
except Louisiana vs. Bahia, possibly because of the
reduced sample sizes for these populations. These
results suggest a moderate degree of differentiation
between the two species, despite their considerable
similarities and sharing of haplotypes.
As before, the phylogenetic tree (not presented
here because of the large number of haplotypes) was
characterized by a complete mixing of individuals
from the two species, resulting in the formation of a
single clade with countless polytomies and reduced
statistical support. This confirmed the absence
of any systematic phylogeographic structuring
between
L. purpureus
and
L. campechanus
, which
was further reinforced by the star-shaped haplotype
network (Fig. 3B).
The plot of the pairwise differences between
hapotypes for the whole sample (n = 414)
revealed a unimodal distribution characteristic of
historical population expansion (Fig. 4B). This
was confirmed by the values of τ, θ0 and θ1, SSD
and the raggedness index (Table IIIB). In addition,
the
Fs
values were negative and significant for
all the populations, rejecting the neutrality of the
marker used here, and emphasizing the process of
population expansion. The
D
values were negative
for all the populations, but were only significant for
L. campechanus
(Table IIIB).
Estimates of population expansion were based
on the same criteria used above for
L. purpureus
.
However, as the two species have different ages
of maturation, the calculations were conducted
using both values, i.e. 2 years for
L. campechanus
(Moran 1988) and 5 years for
L. purpureus
(R.F.C.
Souza, unpublished data, Souza et al. 2003). Using
the same mutation rate as before, values of µ vary
TABLE IV
Matrix of Fst values for pairwise comparisons between populations of L. purpureus and L. campechanus
from the western Atlantic. Significance level: ns: not significant; * = P < 0.05; ** = P < 0.01.
L. purpureus L. campechanus
CNBI CNBII Ceará Bahia Mississippi Alabama Louisiana Florida
CNBII 0.010ns
Ceará -0.004ns -0.007ns
Bahia -0.001ns 0.013ns 0.001ns
Mississippi 0.238** 0.324** 0.295** 0.198**
Alabama 0.175** 0.248** 0.203** 0.117* 0.039ns
Louisiana 0.118** 0.193** 0.148** 0.061ns -0.001ns -0.027ns
Florida 0.192** 0.266** 0.232** 0.144** -0.003ns 0.007ns -0.005ns
from 5.0x10
-8to 6.5x10
-8. Considering a generation
time of 5 years and the 299 bps sequenced here,
u ranged from 7,475.0x10
-8to 9,717.5x10
-8. The
value of τ was estimated to be 7,414, indicating
that population expansion took place between
approximately 191,000 and 248,000 years ago. The
same result was obtained when a generation time of
2 years was considered.
DISCUSSION
BRAZILIAN L. PurPurEuS
Phylogeography and Population Structure
The species
L. purpureus
represents an important
fishery resource throughout its distribution in the
western Atlantic, although little is known of the
genetic structure of its populations, despite the
value of such knowledge for the management of
stocks. The results of the present study reconfirm
the findings of Gomes et al. (2008), and indicate
that the Brazilian populations of red snapper
form a single genetic stock, characterized by
intense internal gene flow, contradicting the
previous study of Salles et al. (2006), which also
used mitochondrial markers, and indicated the
existence of two geographically distinct stocks.
These authors considered the western stock to
be less productive, given the presence of smaller
reproductively mature individuals. Unfortunately,
this apparent, however unexpected discrepancy
between the topologies retrieved by CytB region
and control can not be tested because the sequences
CytB cited by Salles et al. (2006) are not available
in Genbank. However, as the authors used only 12
specimens and a fragment with only 307 base pairs,
we postulate that this discrepancy is due to small
sample size and the short DNA fragment.
In addition, our molecular findings contrasts with
the morphometric and meristic analyses performed by
Sousa-Júnior et al. (2002) and Salles et al. (2006). This
discrepancy cannot be easily explained, except by the
fact that the two data sets (molecular and morphology)
experience different selective forces. However, only
a combined analysis, which was not possible in this
approach, may be quite clear on this issue.
Regarding the migratory cycle proposed by
Ivo and Hanson (1982), our interpretation is that,
irrespective of the cohorts number, the juveniles
mingle in the breeding area, prior to being recruited
to the feeding areas on the continental shelf.
The pattern of marked genetic homogeneity
recorded here for
L. purpureus
appears to be
typical of western Atlantic lutjanids, such as
L.
campechanus
and
Rhomboplites aurorubens
in
the Gulf of Mexico and Florida (Bagley et al.
1999, Garber et al. 2004) and
Ocyurus chrysurus
in Brazil (Vasconcellos et al. 2008). These species
are behaviorally similar, demersal inhabitants of
relatively deepwater habitats with rocky bottoms
and/or coastal regions close to coral reefs (Allen
1985). They also share pelagic development stages,
during which their eggs and larvae are transported
by marine currents, which generally limit the
potential for speciation. This type of reproductive
process results in an extensive intermingling of
individuals, which presumably influences the
genetic connectivity among populations.
However, other lutjanid species present very
different genetic characteristics, with marked
divergence among populations. These species
include
Pristipomoides multidens
(Ovenden et
al. 2004),
Lutjanus erythropterus
(Zhang et al.
2006), and
L. synagris
(Karlsson et al. 2009). Other
perciforms, such as the king weakfish,
Macrodon
ancylodon
, also present considerable genetic
differentiation at the population level (Santos et al.
2003, 2006). These authors recorded the presence
of two distinct genetic stocks of
M. ancylodon
along the Atlantic coast of South America, which
they interpreted as the result of a process of
allopatric differentiation. One of the determining
factors in this case may be differences in water
currents (Santos et al. 2006). Other authors, such
as Rocha et al. (2004) have related environmental
variables to distribution patterns and differentiation
in marine fish species, finding that populations may
be connected over thousands of kilometers, where
similar habitats exist, as in the case of
L. purpureus
on the Brazilian coast. It is nevertheless important
to bear in mind that, in addition to ecological
variables, historical factors and associated
evolutionary processes may also contribute to the
present-day configuration of geographic ranges in
the western Atlantic (Rocha 2003).
Genetic variability and divergence
The Brazilian populations of red snapper present
high levels of genetic variation, considering
either haplotype or nucleotide diversity. Unique
haplotypes or haplotypes exclusive to a given
population predominate. A similar pattern has
been observed in other commercially-important
lutjanid species, such as
L. campechanus
(Garber
et al. 2004),
L. erythropterus
(Zhang et al. 2006),
and
O. chrysurus
(Vasconcellos et al. 2008). The
relative abundance of unique haplotypes – a pattern
common to all these species – may mean that many
alleles are lost through harvesting, which will
eventually affect the genetic diversity of stocks.
It is interesting to note that the highest levels
of nucleotide diversity were recorded in the eastern
populations (Ceará and Bahia). This may be related
to the decline in fishery activities in this region
(Ivo and Sousa 1988, Paiva 1997), which would
have partially released local populations from
this predatory pressure. On the other hand, as the
Brazilian population appears to be panmictic, this
spatial variation may be related to ecological factors,
such as the abundance of coral reefs and oceanic
banks off the coast of the Brazilian Northeast.
L.
purpureus
, a nektonic demersal species (Szpilman
2000), appears to prefer relatively deep water
(30-60 m) (Allen 1985) with a rocky or coralline bottom,
with juveniles generally inhabiting shallower areas.
However, commercial fishing of the species in Brazil
is relatively recent – around 50 years
(Fonteles-Filho 1972, Paiva 1997) – which may be a too short
period for significant spatial and temporal variations
in the diversity of the species to occurred.
Divergence between haplotypes varied
from 0.1% to 6.5%, although in many cases, the
value was below 2%, which indicates haplotypes
distinguished by a small number of mutations. In
other species of the genus, such as
L. campechanus
,
divergence between haplotypes is typically much
higher, reaching 9% (Garber et al. 2004).
Demographic History
All the populations studied here, with the
exception of that from Bahia, presented a smooth
unimodal distribution in the plot of pairwise
differences, which indicates exponential growth,
or population expansion (Frankham et al. 2004).
The estimated expansion time of Brazilian
L.
purpureus
coincides with the late Pleistocene, as
confirmed by Gomes et al. (2008). Pruett et al.
(2005) also proposed a Pleistocene expansion for
the population of
L. campechanus
.
The star-shaped haplotype network, and other
parameters (SSD, raggedness index) also indicate
a process of expansion in the Brazilian red snapper
population, which is further confirmed by the θ
intervals, reflecting considerable differences in the
size of the population before and after the expansion
process. It seems likely that the irregular distribution
observed in the plot for Bahia is related primarily to
the small size of the sample from this area, given that
other analyses indicated expansion in this population,
although it may also reflect the relatively ample
variance observed in the mismatch distribution.
Garber et al. (2004) recorded a similar pattern
in populations of
L. campechanus
, once again with
a single exception (Florida), possibly for reasons
from
Bahia. Similar results have also been
obtained for
L. erythropterus
(Zhang et al. 2006)
and
Thallasoma hardwicki
(Chen et al. 2004).
Significant negative values of
Fs
and
D
were
recorded for the Brazilian red snapper populations
analyzed here, except for
D
in the Ceará and
Bahia populations. These results confirm that the
marker used here is non-neutral, and also suggest
haplotypes of low frequency distinguished by
few mutations, as well as an accumulation of new
mutations (Tajima 1989, Fu 1997). The significant
negative values of
Fs
also indicate population
expansion in the recent past, as observed in other
marine fish, such as
O. chrysurus
(Vasconcellos et
al. 2008),
L. erythropterus
(Zhang et al. 2006),
C. acoupa
(Rodrigues et al. 2008) and
T. hardwicki
(Chen et al. 2004).
RED SNAPPERS OF THE WESTERN ATLANTIC: L. PurPurEuS
AND L. CAMPECHANuS
One or Two Species?
Mayr’s (1963) biological species concept is
based on the idea of the reproductive isolation
of populations, and is the most widely-accepted
definition of a species, in particular in areas such
as population genetics, evolutionary biology, and
conservation biology (Frankham et al. 2004).
The situation observed in the red snappers
L.
purpureus
and
L. campechanus
is characteristic of
that of a single species, considering not only the
homogeneity of morphological traits (Allen 1985,
Moran 1988, Cervigón 1993, Cervigón et al. 1993,
De-la-Rosa 2001, Wilson and Nieland 2001,R.F.C.
Souza, unpublished data, Souza et al. 2003), but
also the marked similarity in genetic features
(Gomes et al. 2008, present study).
However, there is a consensus in the literature
that the geographic ranges of these two snappers
are not sympatric. Many authors, such as Cervigón
(1993) and Allen (1985) believe that these species
are parapatric in the western Atlantic, with
L.
campechanus
being restricted to the Gulf of Mexico
and Atlantic coast of the United States, and absent
from the Caribbean (Rivas 1966, Allen 1985),
whereas
L. purpureus
is found south of Cuba,
southwards throughout the Caribbean to Bahia in
northeastern Brazil (Allen 1985, Cervigón 1993).
Some authors (Rivas 1966, Carpenter and Nelson
1971) nevertheless suggest that
L. purpureus
also
occurs in some parts of the coast of the United
States, in which case, contact between populations,
and gene flow, would be possible. Either way,
the restricted ranges of the two species contrasts
considerably with those of other western Atlantic
snappers, such
L. vivanus
,
L. synagris
and
L.
buccanella
, which present a continuous distribution
along the eastern seaboard of the New World (Allen
1985, Cervigón 1993).
The analysis presented here demonstrated
that
L. campechanus
and
L. purpureus
share
mitochondrial haplotypes, indicating the
occurrence of gene flow between their populations.
The AMOVA also found that the majority of the
variance was within rather than among populations
or geographic groups, even though the
Fst
values
for pairwise comparisons between species were
significant. The magnitude of the recorded values
(
F
/Ф
ST= 0.236,
P
< 0.01) indicates only moderate
genetic differentiation between the two snapper
species, and may simply reflect the elevated
polymorphism of the control region in these fish.
Similar values were recorded in intra-population
comparisons in lutjanids, including species
from the western Atlantic (Ovenden et al. 2004,
Vasconcellos et al. 2008).
Other aspects of the results also support
the hypothesis that only a single species of red
snapper exists in the western Atlantic, such as the
star-shaped haplotype network and the absence of
phylogeographic structuring in the phylogenetic
tree, which clearly indicates the existence of a
strong evidence for the existence of a single species
(Cracraft 1983). A similar conclusion was obtained
in the preliminary analysis of Gomes et al. (2008).
The sum of the evidences appears to indicate
that
L. campechanus
and
L. purpureus
actually
represent a single species of red snapper with
moderately restricted gene flow. The two species
clearly share a common evolutionary history, but
given the nature of the marker used here (haploid,
with strictly maternal inheritance) (Brown 2008),
it may be necessary to consider alternatives
explanations for the observed scenario.
One possibility is that the gene flow detected
between populations reflects the incomplete
separation of lineages, with the retention of an
ancestral polymorphism. This would explain the
absence of reciprocal monophyly between the two
species, and may indicate that the cladogenetic
event which rose the two species was relatively
recent, given the fact they still share the same
mitochondrial lineage. A second alternative is
the possibility of hybridization or introgression,
resulting from the generation of a fertile hybrid,
which subsequently breeds with members of one or
both of the original species, resulting in gene flow
between them. Such events were well documented
(Freyhof et al. 2005, Sanz et al. 2006, Castillo et
al. 2008). This process would nevertheless depend
on the presence of a contact zone between the
ranges of the two species, which has yet to be
confirmed in the present case. Hybridization was
recorded in a number of lutjanid species, such as
L. synagris
and
O. chrysurus
(Domeier and Clarke
1992, Loftus 1992). Recent analyses (Rocha and
Molina 2008, Nirchio et al. 2008, 2009) have
confirmed that the chromosomic constitution of the
lutjanids, including species of the genera
Lutjanus
,
Ocyurus
, and
Rhomboplites
, is highly conserved,
which would permit introgressive hybridization or
hybridization. At the moment, however, there is no
evidence of such hybridization in the red snappers.
Confirmation of any of these alternatives would
require a more reliable evaluation of gene flow
based on the analysis of additional mitochondrial
loci and nuclear genes.
The absence of genetic sub-structuring among
populations of marine fish was recorded in a wide
range of western Atlantic fish species, including
other lutjanids (Garber et al. 2004, Santa Brígida et
al. 2007). One of the possible explanations for this
phenomenon is the considerable dispersal potential
of the pelagic larval forms, which can be transported
over long distances by ocean currents. The dimensions
and relative continuity of the marine environment in
this region may be an additional factor.
Patterns of Genetic Variation and Demographic
The populations of red snappers analyzed in the
present study presented high levels of genetic
polymorphism. The overall pattern of variation was
similar in the two species, although diversity was
greater in the Brazilian
L. purpureus
. The species
could not be differentiated based on indices of
genetic variability. In addition, many parameters of
interspecific genetic distance were lower than those
recorded within populations of both species (Garber
et al. 2004, Gomes et al. 2008, present study) and
also other lutjanids (Ovenden et al. 2004).
Despite not analyzing the hypervariable portion
of the control region, Gomes et al. (2008) recorded
a similar pattern in these species. Grant and Bowen
(1998) have argued that elevated haplotype and
nucleotide diversity may be evidence of a stable
population with a long evolutionary history.
As both red snappers are gonochoric and
oviparous, and lack sexual dimorphism
(De-la-Rosa 2001, R.F.C. Souza, unpublished data,
Souza et al. 2003), we conclude that cohorts of
both species have distinct breeding areas, with
the intense intermingling of individuals occurring
data, it would seem likely that an extensive area of
intermingling exists, which would be responsible
for the elevated levels of genetic polymorphism and
the similarities in the patterns of variation observed
in the populations analyzed here.
When the two red snappers were combined
for analysis, the plot of the pairwise differences
between haplotypes revealed a unimodal distribution,
characteristic of a population that has undergone
expansion in the past (Slatkin and Hudson 1991,
Rogers and Harpending 1992), as observed by Gomes
et al. (2008). This conclusion is also supported by
other parameters, such as the low and non-significant
SSD and raggedness index, and the significantly
negative value of
Fs
. The same pattern was found in
both species individually (Garber et al. 2004, present
study), and in other lutjanids, such as
L. erythropterus
(Zhang et al. 2006). The estimated expansion time of
L. campechanus
coincides with the late Pleistocene,
as reported by Pruett et al. (2005).
IMPLICATIONS FOR THE CONSERVATION OF THE SPECIES
Reliable data on geographic range and genetic
variability are crucial to the development of
successful conservation and management strategies
for any species, but especially those which suffer
intense anthropogenic impacts, as in the case of the
red snapper. Information derived from the analysis
of DNA fragments has been increasingly employed
in conservation programs. In the specific case of
the fish icthyofauna, a large number of studies have
confirmed the effectiveness of the mitochondrial
control region for the detection of gene flow between
populations or species, and the understanding of
genetic variation, phylogeographic patterns, and
demographic history (Garber et al. 2004, Sanz et
al. 2006, Zhang et al. 2006, Gomes et al. 2008,
Rodrigues et al. 2008, Vasconcellos et al. 2008).
In the present study, the analysis of the control
region of populations of Brazilian
L. purpureus
revealed the existence of a single genetic stock,
which is an extremely important finding for the
management of fishery stocks. In addition, high levels
of genetic variation and a predominance of unique
and exclusive haplotypes were found. This pattern of
haplotype distribution may reflect an imbalance of
the species genetic diversity, which could require the
implementation of effective management strategies
that integrate the molecular data with those on
ecological variables and reproductive parameters.
Together with data from previous analyses
(Gomes et al. 2008), the results of the present study
indicate emphatically that
L. purpureus
and
L.
campechanus
represent different populations of the
same species, with an ample geographic distribution
stretching from the southeastern United States to
northeastern Brazil. However, as the genetic marker
used here represents a single locus with maternal
inheritance, we cannot rule out other possible
explanations for the observed gene flow between
species, such as introgression, hybridization or the
retention of an ancestral polymorphism.
While the results of the molecular analysis
presented here indicate the existence of a single,
genetically diverse species, a more reliable
evaluation would include nuclear genes. Irrespective
of their taxonomic status, if each species represents
a panmictic population within its own geographic
range, as suggested here and in previous studies
(Gold et al. 2001, Garber et al. 2004, Gomes et al.
2008), their management as separate stocks may be
the most effective approach over the long term. Such
management is already in place for
L. campechanus
,
but in the case of
L. purpureu
s, there is an urgent
need for the implementation of measures that will
guarantee the maintenance of the genetic diversity of
the species, and impede the loss of alleles.
ACKNOWLEDGMENTS