Comparative analysis of zebrafish bone morphogenetic proteins 2, 4 and
16: molecular and evolutionary perspectives
Cátia L. Marques1,2,3, Ignacio Fernández1, Michael N. Viegas1, Cymon J. Cox1, Paulo Martel4, Joana Rosa1,2,3, M. Leonor Cancela1,3 and Vincent Laizé1,3,*
1
Centre of Marine Sciences (CCMAR), University of Algarve, Faro, Portugal; 2PhD Program in Biomedical Sciences and 3Department of Biomedical Sciences and Medicine (DCBM), University of Algarve, Faro, Portugal; 4Centre for Molecular and Structural Biomedicine (CBME/IBB-LA), University of Algarve, Faro, Portugal;
* Corresponding author
Centre of Marine Sciences (CCMAR), University of Algarve, Campus de Gambelas, 8005-139 Faro, Portugal
Tel: 00351289800057 Fax: 00351289800051 E-mail: [email protected]
Abstract
BMP2, BMP4 and BMP16 form a subfamily of bone morphogenetic proteins acting as pleiotropic growth factors during development and as a bone inducers during osteogenesis. BMP16 is the most recent member of this subfamily and basic data regarding protein structure and function, and spatio-temporal gene expression is still scarce. In this work, insights on BMP16 were provided through the comparative analysis of structural and functional data for zebrafish BMP2a, BMP2b, BMP4 and BMP16 genes and proteins, determined from three-dimensional models, patterns of gene expression during development and in adult tissues, regulation by retinoic acid and capacity to activate BMP signaling pathway. Structures of Bmp2a, Bmp2b, Bmp4 and Bmp16 were found to be remarkably similar, with residues involved in receptor binding being highly conserved All proteins could activate the BMP signaling pathway, suggesting that they share a common function. On the contrary, stage- and tissue-specific expression of bmp2, bmp4 and bmp16 suggested the genes might be differentially regulated (e.g. different transcription factors, enhancers and/or regulatory modules) but also that they are involved in distinct physiological processes, although with the same function. Retinoic acid, a morphogen known to interact with BMP signaling during bone formation, was shown to down-regulate the expression of bmp2, bmp4 and bmp16, although to different extents. Taxonomic and phylogenetic analyses indicated that bmp16 diverged before bmp2 and bmp4, is not restricted to teleost fish lineage as previously reported, and that it probably arose from a whole genomic duplication event that occurred early in vertebrate evolution and disappeared in various tetrapod lineages through independent events.
Keywords
Bone morphogenetic proteins; BMP2/4/16 subfamily; zebrafish Danio rerio; evolution; gene expression; BMP signaling; retinoic acid.
Abbreviations
BMP, bone morphogenetic protein; RA, retinoic acid; WGD, whole genome duplication
Note
Names/acronyms of genes/proteins of species with different nomenclature conventions are used throughout this study. To reduce heterogeneity no convention will be used and acronyms
will be uppercased. However, convention will be maintained for zebrafish which is the main specie studied here.
Introduction
Whole genome duplications (WGDs) are key features in species evolution that allow organisms to develop new characteristics [1]. WGDs are often related to bursts in organism diversity and complexity [1, 2] and many families of genes are known to have evolved through genome duplication [1, 3]. Despite some controversy, it is commonly accepted that three whole genome duplication occurred during vertebrate evolution: the first and second duplication events occurred early in the vertebrate lineage, approximately 500 million years ago, while the third event only affected teleost fish genome [2, 4–7]. After duplication, the paralogous gene (copy of the original gene) can co-exist with the original copy and complement its function (subfunctionalization) or diverge and develop a new function (neofunctionalization) [8, 9]. However, WGDs are typically followed by massive gene loss, and in most cases only a single copy of the duplicated genes will be maintained [10]. Moreover, gene loss among distantly related lineages often results in hard-to-interpret molecular phylogenies as in the case of bone morphogenetic proteins (BMPs) 2, 4 and the recently identified BMP16 [11, 12].
Products of the BMP2 and BMP4 genes belong to the transforming growth factor (TGF superfamily of multifunctional growth factors, and are involved in several key mechanisms of vertebrate development [13, 14], such as bone formation [15]. The primary structures of BMP2 and BMP4 proteins have been remarkably conserved throughout evolution and human mature BMP2 and BMP4 share 90% identity and are 75% identical to their Drosophila homolog decapentaplegic (DPP). The conservation of protein function has also been demonstrated through the interchangeability of Drosophila and mammalian proteins: DPP can induce endochondral bone formation when introduced subcutaneously in mouse [16], while mammalian BMP4 protein is able to rescue the dorsal-ventral defects resulting from the lack of DPP in Drosophila [17]. BMP2 and BMP4 genes are expressed in a wide variety of tissues, and their expression in early stages of development was shown to be crucial for organism viability, as demonstrated by the early lethality of mice deficient for BMP2 or BMP4 gene [18].
Based on sequence similarities, Feiner et al. [12] identified in 2009 a new member of the BMP2/4 subfamily, which was later named BMP16. While it was initially presented as a
teleost fish specific protein, its presence has recently been reported in the genome of non-teleost fish species suggesting that its origin is not related to the third, non-teleost-specific, WGD event [19]. Expression of bmp16 gene was analyzed by in situ hybridization during early zebrafish development and detected mainly in the developing heart, gut epithelium and swim bladder [12]. In adult Senegalese sole tissues, BMP16 transcript was detected through quantitative real-time PCR in branchial arches, brain, intestine and heart [19]. Not much more is known about BMP16, in particular its capacity to activate BMP signaling pathway as BMP2 and BMP4 [20–22] or its role during vertebrate development.
The aim of this work is to provide new insights into the origin of BMP16 and characterize the evolutionary relationship of the members of BMP2/4/16 subfamily but also to collect data on protein function and gene regulation through the comparative analysis of protein structure homology models, capacity to activate BMP signaling pathway, spatiotemporal gene expression profiles and regulation by retinoic acid.
Materials and methods
Ethics StatementAnimal handling and experiments are legally accredited by the Portuguese Direcção Geral de Veterinária (DGV) and all the experimental procedures involving animals were performed according the EU (Directive 86/609/CEE) and National (Portaria nº 1005/92 de 23 de Outubro; Portaria nº 466/95 de 17 de Maio; Portaria nº 1131/97 de 7 de Novembro) legislation for animal experimentation and welfare
Gene sequence collection and reconstruction
Annotated sequences for BMP2, BMP4 and BMP16 were retrieved from GenBank (ncbi.nlm.nih.gov) and Ensembl (ensembl.org) databases using on-site BLAST facilities. In some cases, sequences were reconstructed from expressed sequence tags (EST), genome survey sequences (GSS), whole genome shotgun (WGS) sequences, and transcriptome shotgun assembly (TSA) available through GenBank sequence databases. Species-specific sequences were clustered and assembled using the ContigExpress module of Vector NTI software (Invitrogen). Gene structures were predicted using the Spidey mRNA-to-genomic alignment tool (ncbi.nlm.nih.gov). Genomic organization of BMP16 gene flanking regions was determined using genomic data available in Ensembl database.
Multiple sequence alignment and phylogenetic reconstruction
BMP2, BMP4 and BMP16 gene sequences were aligned using TranslatorX V1.1 [23]. The nucleotide alignment was manually adjusted using SeaView V3.2 [24] where parts of sequences were arbitrarily aligned (2 accessions, namely, sea squirt and fruit fly). Unambiguously aligned characters were defined using Gblocks V0.91b [25] and the following options in the SeaView interface: “allow gaps in final positions” (-b5=h), "do not allow many contiguous non conserved positions" (-b3=4), and "allow smaller final blocks" (-b4=5). A single block of positions was eliminated where the alignment with outgroup sequences (lancelet, fruit fly, sea squirt) was arbitrary. The final alignment consisted of 58 taxa and 612 aligned nucleotides, which translated to 204 amino acids. Phylogenetic analyses, using maximum likelihood, were conducted using RAxML V7.8.4-MP [26] and Bayesian phylogenetic inferences were conducted using P4 V0.89.r234 [27]. Appropriate models were determined using ModelGenerator V0.85 [28]: for nucleotides this was a general time-reversible substitution model (GTR) with a gamma-distribution of among-site rate variation (4 discrete categories) (+Γ) and a proportion of invariant sites (+I), and for amino acids the LG [29] empirical substitution matrix with +Γ and estimated stationary amino acid frequencies (+Fest). Non-stationary composition model analyses were performed in P4 with the addition of extra composition vectors (CV) to the best model (see Online resource 2 for details on individual analyses).
3D model building of zebrafish Bmp2a, Bmp2b, Bmp4 and Bmp16
Mature peptides of zebrafish BMP2, BMP4 and BMP16 and human BMP2 were aligned using the ClustalW Omega server (ebi.ac.uk/Tools/msa/clustalo). The pairwise identities ranged from 64.7% (BMP16) to 83.3% (BMP2b). At this level of identity, reliable homology models can be built from one structure determined experimentally [30]. Structure 1REW available in the Protein Data Bank (complex between human BMP2 and the ectodmain of its type IA receptor [31]) was selected to serve as template. Water molecules and receptor chains were removed from the structure file and the remaining BMP2 dimer used as template for homology building using the MODELLER v9.12 software package [32]. Since the first 11 residues of human BMP2 mature peptide are missing in PDB structure, matching zebrafish segments were removed from the alignment. Structures were modelled as dimers with an intermolecular SS bond, the active form of BMPs. For each protein 50 models were generated and the one with the best DOPE score [33] was selected. The absolute quality of the four
selected models was evaluated using the Z-DOPE score, and also checked using the QMEAN and MOLPROBITY servers. The final models were displayed and analyzed using the PyMOL Molecular Graphics System version 1.5.0.4 Schrödinger, LLC. Images of the complex between BMPs and the BMPRIA/ACVR2 receptors were prepared using receptor coordinates from PDB structures 1REW (BMPRIA) and 2GOO (ACVR2) and preserving the relative position of receptors and binding partners seen in those structures
Vector construction
Coding sequences of zebrafish bmp2a, bmp2b, bmp4, and bmp16 (accession numbers NM_131359, NM_131360, NM_131342 and NM_001171776, respectively) were amplified by PCR using the proofreading Advantage cDNA polymerase (Clontech), reverse-transcribed mRNA extracted from ZFB1 cells [34] and gene-specific primers designed according to available sequences (Table 1) and directionally inserted into pcDNA3.1 expression vector (Invitrogen), under the control of pCMV promoter. DNA integrity was confirmed through sequencing (Note: cloned sequences contained single nucleotide polymorphisms that did not alter protein sequence; they have been deposited into GenBank database with the following accession numbers: bmp2a, KM820423; bmp2b, KM820424; bmp4, KM820425 and bmp16, KM820426).
Luciferase assays
ABSa15 cells (ECACC catalogue no. 13112201) [35] were seeded at 4 × 10⁴
cells/well in 24-well plates and cultured in DMEM medium for 16 h at 33ºC under 10% CO2. Sub-confluent
cultures were transfected using 1.5 μl of X-tremeGENE HP DNA transfection reagent (Roche) with vectors expressing (1) zebrafish bmp2a, bmp2b, bmp4 or bmp16 under the control of CMV promoter (pcDNA3 vector backbone; 200 ng), (2) firefly luciferase under the control of BMP-responsive elements (BRE-Luc vector; 250 ng [36]) and/or (3) renilla luciferase under the control of SV40 promoter (pRL-SV40 vector; 200 ng; Promega). After 48 h, cells were lysed and luciferase activities were measured in a BioTek Synergy 4 plate reader using Dual-Luciferase Reporter Assay system (Promega). Relative luciferase activity was determined from the ratio F-Luc/R-Luc and is presented as the fold change over pGL3 basic vector.
Zebrafish eggs were obtained from natural spawning of in-house broodstock maintained in a ZebTec housing system (Tecniplast). Water parameters were maintained as follows: pH 7.6 ± 0.2; conductivity 700 mS; dissolved oxygen 7.8 mg L-1; photoperiod 14:10 hours light:dark. Fertilized eggs were maintained until hatching in 1-L water tanks at a density of 200 eggs L-1 with 0.5 ppm of methylene blue to avoid fungi development. Hatched larvae were raised until 30 days post-fertilization (dpf) in 1-L water tanks at a density of 100 larvae L-1, with 90% of the water renewed every two days. Larvae from 5 to 10 dpf were fed twice a day with Artemia nauplii (AF strain INVE, 5-10 nauplii mL-1) and from 8 to 30 dpf with Artemia metanauplii (EG strain INVE, 10 metanauplii mL-1). Juveniles, adults and broodstock were fed twice a day with commercial dry food and once a day with Artemia metanauplii.
Zebrafish embryos and larvae were sampled at 1 (4 cells), 3 (1k cell), 16 (14 somites), 24, 32, 48, 72 and 96 hours post fertilization (hpf), and 5, 7, 9, 12, 15, 20, 25 and 30 dpf. The amount of material sampled at each developmental stage was adapted to specimen size and ranged between 100 eggs and 5 early juveniles (30 dpf). Adult zebrafish tissues were collected and pooled from 3 males and 2 females. All specimens were anesthetized with a lethal dose of tricaine methanesulfonate (MS-222, Sigma-Aldrich) and washed with sterile distilled water before sampling. Specimens and tissues collected for gene expression analysis were placed in 10 volumes of TRI-Reagent (Ambion) and stored at -80 ºC until processed.
Cell exposure to retinoic acid
Sub-confluent cultures of ZFB1 cells [34] were exposed for 24 h to 1 µM all-trans retinoic acid (atRA; Sigma-Aldrich) or 0.01% of dimethyl sulfoxide (DMSO; vehicle), washed 3 times in ice-cold phosphate-buffered saline, scrapped out and stored in TRI-Reagent.
RNA extraction and quantitative real-time PCR
Total RNA was extracted from samples stored in TRI-Reagent following manufacturer instructions and purified using the High Pure RNA Isolation kit (Roche). RNA integrity was confirmed using Experion Automated Electrophoresis system (Bio-Rad) and quantity was determined using NanoDrop spectrophotometer (Thermo Scientific). Total RNA (500 ng) was reverse-transcribed for 1 h at 37ºC using M-MLV reverse transcriptase (Invitrogen), oligo-d(T) primer and RNase OUT (Invitrogen). All quantitative real-time PCR (qPCR) reactions
were performed in triplicates using SsoFast EvaGreen Supermix (Bio-Rad), 0.25 μM of isoform-specific primers (Table 1) and 1:10 dilution of reverse-transcribed RNA, in a StepOnePlus Real-Time PCR system (Applied Biosystems). PCR amplification was as follows: an initial denaturation step of 1 min at 95ºC and 40 cycles of amplification (5 s at 95ºC and 10 s at 65ºC). Efficiency of amplification was above 95% for all primer sets. Levels of gene expression were calculated using the ΔΔCt comparative method [37] and normalized using housekeeping genes, whose suitability was evaluated using Normfinder and BestKeeper algorithms [38, 39]. β-actin 2 and rps18 were selected to normalize gene expression in developmental stages and cells, and tissues, respectively.
Results
Taxonomic distribution of vertebrate BMP2, BMP4 and BMP16: BMP16 is not fish-specific
Sequences with a high similarity to BMP2, BMP4 and BMP16 were retrieved from GenBank and Ensembl databases using on-site BLAST tools and multiple sequences as queries. An overview of the taxonomic distribution of BMP2, BMP4 and BMP16 is presented in Fig. 1. A single BMP2/4 isoform is present in several invertebrate genomes and three copies of the same gene are found in the jawless fish superclass Agnatha (e.g. lampreys). BMP2 and BMP4 are present as two independent genes in all gnathostomes (clade G in Fig. 1). No BMP2 sequence was found in Chondrostei (e.g. sturgeon and bichir) and although we cannot exclude the possibility of gene loss in the lineage, it is probable that its absence in sequence databases is a consequence of the scarce genomic data available for those species. In contrast, two BMP2 genes (BMP2a and BMP2b) are present in Ostariophysi genomes (e.g. zebrafish). The presence of BMP16 gene is restricted to the genome of few gnathostome taxa. BMP16 gene has been identified in a large number of Neopterygii species (clade N in Fig. 1) but not in Chondrichthyes and Chondrostei, which are both early-branching fish lineages of gnathostomes and again have limited genomic data available. The BMP16 gene was also found in Coelacanthidae (coelacanth) and in Lepidosauria (e.g. lizards and snakes) but not in other Sarcopterygii (clade Sa in Fig. 1), including Amphibia, Testudines, Archosauria, and Mammalia. In the latter organisms genomic data is abundant suggesting that the absence of BMP16 is not due to a lack of data.
To better understand the mechanisms underlying the loss of the BMP16 gene, genomic regions flanking BMP16 locus were analyzed from a subset of species representing the major
vertebrate taxonomic groups (Fig. 2). As expected, gene composition and synteny surrounding the BMP16 locus are more conserved in closely related species (e.g. the Japanese medaka, the spotted green pufferfish, the three-spined stickleback and the southern platyfish) than in evolutionarily distant species (e.g. zebrafish, coelacanth and green anole). However in some cases, for instance in three-spined stickleback and southern platyfish, gene translocation was observed. In tetrapods, where the BMP16 gene is missing, two different scenarios were observed: (1) genes surrounding the BMP16 locus (i.e. GEMIN7 and PPP1R37 (core genes) but also RELB, CLPTM1, RTN2) are present, suggesting that the BMP16 gene was selectively removed from their genome (e.g. western clawed frog, painted turtle, mouse and human) and (2) genes surrounding the BMP16 locus were also absent, suggesting that the entire chromosome region was lost (e.g. chicken and zebra finch). An analysis of the regions that would typically have contained the BMP16 gene (scenario 1) did not reveal the presence of undetected genes, pseudogenes or remnants of the BMP16 gene, favoring the hypothesis of an active removal of BMP16 gene in these species. Our data demonstrate the presence of the BMP16 gene in ray-finned, lobe-finned fish and also in tetrapods, although it has been independently lost in several tetrapods during evolution. Moreover, our data show that the BMP16 gene is not specific to the teleost fish lineage as previously claimed [12].
Evolution of the BMP2, BMP4, and BMP16 genes: BMP16 diverged before BMP2 and BMP4
The molecular phylogeny of BMP2, BMP4 and BMP16 genes was inferred from a subset of 58 complete coding sequences (Online resource 1), representing the main vertebrate taxa (i.e. jawless fish, cartilaginous fish, ray-finned and lobe-finned fish, amphibians, sauropsids and mammals). The optimal maximum likelihood (ML) tree and the bootstrap proportions of the BMP nucleotide data under the GTR+Γ+Fest model are presented in Online resource 2a and 2b. Bayesian Markov chain Monte Carlo (MCMC) analyses revealed that the data were
non-stationary and that 2 composition vectors using the node-discrete compositional heterogeneity (NDCH) model implemented in P4 were necessary to model the among lineage composition (Online resource 2c, 2d and 2e). ML bootstrap and Bayesian MCMC analyses of the translated amino acid sequences of the BMP genes resulted in trees which were neither analysis well-resolved or well-supported due to a lack of substitutional information at the protein level (data not shown). A 50% majority rule consensus tree of trees sampled from the posterior distribution of the non-stationary composition P4 MCMC (GTR+Γ+I+CV2; Online
resource 2e) analysis of the nucleotide sequence data (analytical details are provided in Online resource 2) is presented in Fig. 3, with posterior probabilities and ML bootstrap
support values indicated at nodes. In this tree, BMP16 is seen to diverge first before the split of BMP2, BMP4 and BMP2/4 of the Agnatha. Branch lengths tend to be slightly longer in the BMP16 clade compared to BMP2 and BMP4 clades, indicating a higher substitution rate and molecular divergence of this isoform. The BMP2/4 isoforms (2/4a, 2/4b or 2/4c) from lamprey are more closely related to the BMP2 and BMP4 members than they are to BMP16, indicating that the three isoforms of BMP2/4 present in lamprey genomes are the result of lineage specific duplication and would have occurred after the split of BMP16 from BMP2 and BMP4. In all the gnathostomes only one homolog for each of the three genes (BMP2, BMP4 and BMP16) was found, except for a particular group of teleost fish (Ostaryophisi), which includes zebrafish. It is probable that the two isoforms of BMP2 (BMP2a and BMP2b) present in Ostariophysi resulted from the third, teleost-specific, WGD that occurred approximately 350 million years ago [40], and suggesting that the second isoform was subsequently lost in the lineage leading to modern teleosts.
Zebrafish BMP2a, BMP2b, BMP4 and BMP16 gene and protein structures are remarkably similar
The structure of zebrafish bmp2a, bmp2b, bmp4 and bmp16 was determined from genomic information available in GenBank database (accession numbers: bmp2a, NC_007128; bmp2b, NC_007131; bmp4, NC_007128 and bmp16, CAAK05042509 and CAAK05042510) by direct comparison with mRNA sequences (Fig. 4). Protein-coding sequences were found to be remarkably conserved among the four genes, exhibiting the same number of coding exons (2), the same phase of intron insertion (1), a similar length (ranging from 1161 to 1251 nt), and sharing a high sequence identity (ranging from 52.2 to 65.7% identity over total CDS length). Non-coding sequences were however quite variable both in size and in structure. While absent in bmp2a, a 5´-non-coding exon was observed in bmp2b, bmp4 and bmp16. In bmp4, an alternative spliced transcript containing two 5’-non-coding exons was also identified (evidence supported by several ESTs). The size of 3’-untranslated regions and the number of consensus sites for polyadenylation signals (predicted with different confidence intervals) were also different among the four genes. Differences in untranslated regions could be indicative of different mechanisms of regulation at transcriptional and posttranscriptional levels.
Similarly, the primary structures of zebrafish Bmp2a, Bmp2b, Bmp4 and Bmp16 mature peptides were compared (Fig. 5a) and found to be remarkably conserved. Sequence identity ranged from 62.9 to 84.7% and sequence similarity ranged from 74.1 to 92.4%, with Bmp2a and Bmp2b being the most similar, and Bmp4 and Bmp16 being the most dissimilar. These observations suggest that Bmp2a, Bmp2b, Bmp4 and Bmp16 may share a similar 3D structure and a similar function. Three-dimensional models of the four zebrafish proteins were built based on the human BMP2 structure 1REW available in the Protein Data Bank (Fig. 5b). Given the high similarity between zebrafish proteins and human BMP2 (ranging from 64.7 to 83.3% of sequence identity and from 78.4 to 90.4% of sequence similarity, Bmp4 being the most similar and Bmp16 the most dissimilar), homology models were expected to be very reliable and this was confirmed with various assessment scores: the four models have QMEAN and Z-DOPE scores within near nativeness (see material and methods and Online
resource 3 for details). The four zebrafish protein models (Online resource 4) overlapped
completely, evidencing their high structural conservation and further suggesting that the correspondent proteins may have the same function, e.g. signal transduction through binding to surface receptors. Model building of the four BMPs in complex with the BMPRIA and ACVR2A receptors further supports the case for strong structural and functional conservation. Indeed, seven of the ten residues of the human BMP2 localized at a 3Å distance from the BMPR1A (including the binding hotspots Leu51 and Asp53 [31]), as well as important residues (Ala-34, Pro-35, Ser-88, Met-89 and Leu-90 [41]) for the interaction with activin receptor type II (ACVR2A) were found to be fully conserved among zebrafish Bmp2a, Bmp2b, Bmp4 and Bmp16 (Fig. 5b), suggesting that members of the BMP2/4/16 subfamily may share the capacity to activate the same receptors. Regarding the important residues for receptor binding in the human BMP2, BMP16 is the most divergent protein, suggesting that it may not bind to BMP receptor(s) with the same affinity.
Zebrafish Bmp2a, Bmp2b, Bmp4 and Bmp16 are activators of the BMP-signaling pathway
The capacity of zebrafish proteins to activate the BMP-signaling pathway was assessed through the use of the BRE-Luc system, where BMP responsive elements (BRE) drive the expression of the firefly luciferase reporter gene. Assays were initially performed in the zebrafish ZFB1 cell line [34], but the low transfectability of these cells resulted in low levels of luciferase activity - close to background levels - precluding the use of zebrafish bone-derived cells (results not shown). To maintain a certain homogeneity in our experimental
system, gilthead seabream mineralogenic cell line ABSa15 – previously used for this purpose [35] – was alternatively used to perform the assays. Relative luciferase activity remained low upon co-transfection of the BRE-Luc vector with the empty expression vector, but higher than background levels (determined by the promoter-less pGL3 basic), suggesting that endogenous BMPs produced by ABSa15 cells were capable of activating BMP signaling pathway. Each of the four zebrafish proteins strongly and significantly activated the BMP signaling pathway, although to different extent (Fig. 6). Bmp2a was the more effective (14.1 folds) followed by Bmp2b, Bmp4 and Bmp16 (8.1, 7.5 and 6.5 folds, respectively). Although values were not significantly different for those last three proteins, Bmp16 exhibited the lower activation capacity. Whether this is correlated with the higher divergence of Bmp16 for the residues involved in receptor binding remains to be determined.
Expression of bmp2a, bmp2b, bmp4 and bmp16 during zebrafish larval development and in adult tissues
To better understand spatial-temporal expression patterns of bmp2a, bmp2b, bmp4 and
bmp16, transcript levels were determined by qPCR throughout larval development and in
adult zebrafish tissues. Since housekeeping genes used to normalize the expression in qPCR showed some variation during early stages of zebrafish development (i.e. at 1 and 3 hpf), the raw Ct values will be considered as a measure of gene expression in those samples. Comparative analysis of Ct values (Fig. 7a) and relative gene expression (Fig. 7b) for the 4 genes revealed limited variations of transcript levels in fish older than 16 hpf. During this developmental window, a slight increase of bmp2a and bmp2b expression was observed after hatching and at late larval development; patterns of bmp4 and bmp16 expression were inversely related, bmp4 being more expressed from 16 hpf to 7 dpf and bmp16 being more expressed from 5 dpf to 30 dpf. The most striking differences however occurred during early embryonic development (1-3 hpf), where expression of bmp genes appeared to be sequentially switched on (Fig. 7). While bmp16 transcript was detected since 1 hpf (4-cells stage) at levels similar to those observed in subsequent stages, suggesting that it may be maternally inherited, expression of bmp2a and bmp4 remained extremely low (high Ct values) at both stages, and significant levels were only detected at 16 hpf (bmp2a and bmp4) and 3 hpf (bmp2b). Pattern of bmp2b expression was intermediate, its transcript being absent or poorly expressed at 1 hpf but present at 3 hpf (blastula stage) at levels similar to those observed in subsequent stages.
Differences in the temporal expression of bmp2a, bmp2b, bmp4 and bmp16 strongly suggest that each isoform plays a different role in early embryonic development.
Comparative analysis of the distribution of bmp2a, bmp2b, bmp4 and bmp16 expression in adult tissues (spatial expression) reveals that all isoforms were expressed in both soft and calcified tissues. The highest levels were found in calcified tissues, scale being particularly rich in bmp2b, bmp4 and bmp16 transcripts and gills (including branchial arches) rich in
bmp2a transcripts (Fig. 8). High and intermediate levels of expression were also observed in
specific soft tissues: intestines and brain for bmp2a and bmp2b, spleen for bmp4 and bmp16, and testis for bmp16. Eye tissue, which is a mix of soft and calcified (e.g. sclerotic cartilage) tissues, was also positive for all transcripts, although the contribution of each type of tissue remains to be determined. Spatial expression of bmp2a, bmp2b, bmp4 and bmp16 strongly suggests that each isoform plays a different role in organ and tissue homeostasis, with a central role in calcified tissues, and particularly in scales.
Retinoic acid negatively regulates the expression of zebrafish bmp2a, bmp2b, bmp4 and
bmp16
Expression of all bmp genes was negatively regulated upon atRA treatment, although to different extents (Fig.9). The two bmp2 genes suffered the highest inhibition, bmp2a being most affected (5.8 folds), while expression of other bmp genes was down-regulated to a lesser extent. Bmp4 was only slightly down-regulated (1.6 folds), suggesting that although regulatory mechanisms driven by RA were conserved, they may have distinct gene specificities.
Discussion
Taxonomic and phylogenetic data revealed the complex evolution of BMP2/4/16 family, where members are derived from an ancestral BMP2/4/16 isoform through gene duplication events that occurred during vertebrate evolution and were subsequently independently lost in specific animal lineages. Fig. 10 illustrates this complex evolutionary relationship and according to the molecular phylogeny presented here, the origin of BMP16 would precede the appearance of BMP2 and BMP4 in Chondrichthyes and of BMP2/4 in lamprey. Given the phylogenetic relationships of taxa possessing BMP16, and taking into account the two WGD events that are known to have occurred early in vertebrate evolution (before and after the agnathans/gnathostomes split) [4, 5, 42], the most parsimonious explanation for the origin of
BMP16 is that the gene is the product of the first WGD event that occurred in a chordate ancestor prior to the branching of the jawless fish. Our proposal contradicts the recent report by Feiner et al. [12], but is congruent with the proposal that the three lamprey BMP2/4 genes are the result of lineage specific duplications after the divergence of agnathans and gnathostomes [43]. From an ancestral BMP2/4/16 isoform the first WGD event produced both the BMP16 and the BMP2/4 isoforms, the latter of which, after the second WGD event, gave rise to BMP2 and BMP4 isoforms (Fig. 10).
The presence of BMP16 in two lepidosaurian species (the green anole and the Burmese python) and its absence in other tetrapods was unexpected. If not present in these two species, BMP16 could have been lost early in the tetrapod lineage after branching from the lobe-finned fish, but its presence in lepidosaurians suggests multiple, independent and specific losses of the gene (Fig. 10). Similarly to what happens for BMP16, parallel lineage-specific gene losses have been reported for other genes that were present at the base of the vertebrate lineage and have been lost in selected taxa throughout evolution [44–47]. Gene retention is often associated with adaptive advantages [48, 49] and the maintenance of BMP16 in Lepidousaria genomes is most likely due to a selective advantage related to specific traits (e.g. locomotion, reproduction, feeding, adaptation to a particular environment) that the gene confers (see below for our hypothesis of the adaptive advantage promoted by BMP16). Although the absence of BMP16 in agnathans and cartilaginous fish could also be related to gene loss events, we believe that limited amount of genomic and transcriptomic information for these taxonomic groups are probably the cause for this absence.
The presence of two BMP2 isoforms (BMP2a and BMP2b) in Ostariophysi could be related to a gene duplication event that occurred in an ancestor soon after branching from Neoteleostei or to the third, fish-specific, WGD that affected Teleostei [2, 50–53]. If teleost-specific WGD is at the origin of the second BMP2 isoform in Ostariophysi, its absence in Neoteleostei probably occurred through gene loss and is possibly related to an eventual functional redundancy. Future studies should aim at understanding why a second isoform was maintained in this specific taxonomic group and whether it evolved a new function.
The low conservation of the genomic region neighboring BMP16 locus in zebrafish was somehow a bit surprising given the high conservation observed among other teleost fish. Interestingly, a high number of transposable elements have been detected in zebrafish genome and we propose that divergent genomic structure around BMP16 genes could be related to a higher frequency of interchromosomal gene exchange [54, 55].
BMPs form the largest group of growth factors in TGFβ superfamily and its division into subfamilies was based on sequence identity [56]. Conservation of gene structure between members of the BMP2/4/16 subfamily is particularly evident in the coding regions and high similarity of the mature peptide has been reported previously [19, 50]. However, non-coding regions, which are known to have important roles in gene transcriptional and post-transcriptional regulation [57], were found to be substantially different in zebrafish bmp2a,
bmp2b, bmp4 and bmp16, and may indicate differences in the regulation of gene expression.
The lethal phenotypes of BMP2-/- or BMP4-/- mice demonstrated that both genes are essential and cannot compensate for the deficient function of each other [18, 58]. It suggests that spatial-temporal patterns of BMP2 and BMP4 gene expression are not overlapping and that both genes are probably submitted to distinct regulatory mechanisms and would be involved in separate physiological roles. This hypothesis was confirmed by expression data presented in this study but also by the high sequence divergence of BMP2 and BMP4 promoter and untranslated regions [59–61].
On the contrary, protein sequences were remarkably conserved and the models exhibited an almost identical 3D structure, where most residues involved in interface contact, including the BMP receptor binding hotspots, Leu51 and Asp53 [31], were conserved. Leu51 is maintained unvariable in several members of BMPs (i.e. BMP2, BMP4, BMP6, BMP7) and growth differentiation factors (i.e. GDF6 and GDF7), all of which interact with BMPR1A, indicating that the backbone hydrogen bond formed between this residue and the receptor is important for ligand-receptor interaction [31]. Similarly, Leu51 and Asp53 residues in BMP7 [62] were shown to have extensive contact with noggin, a known BMP antagonist, suggesting that these residues work as a general recognition motif in BMP ligands, although they are not always the main determinants [31, 62]. These data suggest that the BMP2/4/16 subfamily members may be involved in similar and/or complementary processes and act through the same signaling pathways, as proposed by Feiner and co-workers [12]. The main differences between BMP2/4/16 family members would probably not be associated to its structure and ability to trigger BMP signaling but most likely related to differential regulation and different patterns of expression.
Important to mention is the complexity of the BMP-receptor assembly with four type I receptors - BMPR1A, BMPR1B, activin receptor-like kinase (ALK) 1 and 2 – and three type II receptors – BMPR2 and type IIA and IIB activin receptors (ActR2A and Actr2B) – described to bind BMPs with a very flexible oligomerization pattern [63, 64]. Additionally, in the zebrafish embryo a complex composed by homodimers of type II receptors and
heterodimers of type I receptors (activin-like kinases 3/6 and 2/8) was shown to be activated by heterodimers of BMP2/BMP7 but not by BMP2 and BMP7 homodimers [65], further demonstrating the complex regulation of BMP signaling in vertebrates. In our experimental system Bmp2a, Bmp2b, Bmp4 and Bmp16 were all capable of activating the BMP signaling pathway, although to different extents. Even though we cannot exclude the possibility that the differential activation of BMP signaling pathway may result from the transfection of variable amounts of DNA into the host cells or from uneven capacity of the cells to produce and/or process the different proteins, we suggest that it is a consequence of distinct receptor affinities as already proposed for other BMPs [21, 66]. Binding assays aiming at evaluating ligand-receptor affinity will need to be performed in the future to address this question.
Although they exhibited different levels of gene expression, zebrafish bmp2a and bmp2b showed comparable expression patterns in adult tissues, while different during early development. In zebrafish and Mexican tetra (both Ostariophysi) bmp2a expression is detected in a small subset of bmp2b expression domains, a fact that is consistent with a possible subfunctionalization that genes may have experienced after the duplication [67]. Developmental expression of BMP4 is reported to be an important signal for organ morphogenesis in several vertebrates [68–71]. Bmp4 is also expressed throughout zebrafish development and similarly to bmp2 it is described to act as a ventralizing agent, during mesoderm and neural plate formation [72], a role that is maintained by their invertebrate orthologs [73], suggesting a functional conservation of members of the subfamily throughout evolution. While bmp2a, bmp2b and bmp4 were all expressed at later stages, bmp16 expression was detected as soon as 1 hpf (4-cells), in zebrafish, and 2 hpf, in Senegalese sole [19], suggesting a possible maternal inheritance of the transcript and an important role in the early stages of embryonic development. Analysis of sites of bmp16 expression revealed that until 5 dpf transcripts were mainly detected in the developing heart, gut epithelium and swim bladder [12]. In Senegalese sole, expression of BMP16 remained very low until 5 dpf, exhibiting an increase during the metamorphosis phase [19], which may indicate a particular role of BMP16 in this process. Tissue distribution of bmp2a, bmp2b, bmp4 and bmp16 indicate high expression levels for all these isoforms in calcified tissues, supporting the well documented role of bmp2 and bmp4 in bone metabolism (see for example [15]), and suggesting a contribution from bmp16 in this process. For most of the isoforms (except
bmp2a), highest expression levels were observed in scales, in agreement with the reported
organisms exhibiting scales on their body (i.e. ray-finned fish, lobe-finned fish, lizards and snakes) indicate that BMP16 may play an important role in scale formation and maintenance. Among other tissues with high bmp2, 4 and 16 expression are the branchial arches, known to be important for processes such as osmoregulation and respiration, where BMP signaling is reported to be involved [76]. Bmp16 expression in this tissue may also suggest a role in cartilage formation and mineralization as already described for BMP2 and BMP4 [77]. The relatively high levels of bmp2, bmp4 and bmp16 expression observed in the eye, which contain a mixture of soft and calcified tissues, may be related to the presence of sclerotic cartilage, in agreement with previous reports for other BMP family ligands [78]. In addition to bone metabolism and dorsoventral patterning, BMPs are described as being involved in several other processes [79]. Important roles of BMP2 in the central and, particularly, in the enteric nervous system formation are well documented [80–82]. The high levels of bmp2a and
bmp2b in brain and intestine samples further support this interpretation. Moderate levels of
expression are also found in spleen (bmp4 and bmp16) and in testis (bmp16), and BMP4 has been described as one of the signals required for the expansion of stress erythroid progenitors, in murine spleen [83]. BMP4 expression has also been reported in the gonads of several vertebrate species [84, 85], while BMP16 expression was detected in the ovary of coho salmon [86].
Exposure of ZFB1 cells to RA demonstrated a negative regulation of zebrafish bmp2a,
bmp2b, bmp4 and bmp16 expression. RA is a morphogen involved in several developmental
processes and in skeletal formation [87]. In addition to the regulation of expression of BMP ligands, RA has been reported to modulate BMP signaling, however opposing effects were observed. Expression of BMP2 was stimulated in HSG-S8 cells, a human adenocarcinoma cell line [88], and we have shown that RA up-regulates the expression of BMP2, BMP4 and BMP16 in Senegalese sole cells [19]. On the other hand, RA was described as down-regulating the expression of BMP7 in rats with cleft palate [89], and expression of BMP2 and BMP4 was also observed to decrease in MG63 cells after RA treatment [90]. Contradictory results for the RA regulation of BMP genes suggest a context-dependent effect of the morphogen and is most likely related to the presence/absence of co-regulators [91–93]. In conclusion, we have shown that BMP16 is not restricted to the teleost fish lineage but is largely absent from tetrapod genomes. Phylogenetically, BMP16 diverged in early vertebrates from an ancestral BMP2/4/16. All family members have a protein structure remarkably similar and are capable of activating the BMP signaling pathway and would therefore perform the same function. Differences among BMP2/4/16 family members are found in the
spatial-temporal expression of the genes. They would therefore be submitted to different regulation and participate in distinct physiological processes during early embryonic development and in adult tissues, scales being the tissue expressing the highest levels of bmp2b, bmp4 and bmp16 expression.
Taken together, our results, suggest that, after duplication, members of the BMP2/4/16 subfamily evolved towards a conservation of protein structure and function and the main differences observed in gene expression would be related to differential regulatory mechanisms. The presence of BMP16 in lepidosaurians, while it is absent in other tetrapods, remains to be elucidated although a role in scale formation and homeostasis is conceivable.
Acknowledgments
We thank to Dr. Peter ten Dijke (Leiden University Medical Center, Leiden, The Netherlands) that kindly provided the BMP-responsive luciferase reporter vector (BRE-Luc). This work was co-funded by the European Regional Development Fund (ERDF) through COMPETE Program and by National Fund through the Portuguese Science and Technology Foundation (FCT) under PEst-C/MAR/LA0015/2011 project. It was also partially financed by the European Community (EC) through ASSEMBLE (FP7/227799) research project. CM and JR were supported by doctoral grants (SFRH/BD/39964/2007 and SFRH/BD/47433/2008, respectively) from the FCT. IF was supported by a post-doctoral grant (SFRH/BPD/82049/2011) from the FCT.
References
1. Magadum S, Banerjee U, Murugan P, Gangapur D, Ravikesavan R (2013) Gene duplication as a major force in evolution. J Genet 92(1):155–161. doi: 10.1007/s12041-013-0212-8
2. Santini F, Harmon LJ, Carnevale G, Alfaro ME (2009) Did genome duplication drive the origin of teleosts? A comparative study of diversification in ray-finned fishes. BMC Evol Biol 9(1):194. doi: 10.1186/1471-2148-9-194
3. Panopoulou GD, Clark MD, Holland LZ, Lehrach H, Holland ND (1998) AmphiBMP2/4, an amphioxus bone morphogenetic protein closely related to Drosophila decapentaplegic and vertebrate BMP2 and BMP4: insights into evolution of dorsoventral axis specification. Dev Dyn 213(1):130–139. doi: 10.1002/(SICI)1097-0177(199809)213:1<130::AID-AJA13>3.0.CO;2-6
5. Escriva H, Manzon L, Youson J, Laudet V (2002) Analysis of lamprey and hagfish genes reveals a complex history of gene duplications during early vertebrate evolution. Mol Biol Evol 19(9):1440–1450. doi: 10.1093/oxfordjournals.molbev.a004207
6. Furlong RF, Younger R, Kasahara M, Reinhardt R, Thorndyke M, Holland PWH (2007) A degenerate ParaHox gene cluster in a degenerate vertebrate. Mol Biol Evol 24(12):2681– 2686. doi: 10.1093/molbev/msm194
7. Kuraku S, Meyer A, Kuratani S (2009) Timing of genome duplications relative to the origin of the vertebrates: did cyclostomes diverge before or after? Mol Biol Evol 26(1):47–59. doi: 10.1093/molbev/msn222
8. Dehal P, Boore JL (2005) Two rounds of whole genome duplication in the ancestral vertebrate. PLoS Biol 3(10):e314. doi: 10.1371/journal.pbio.0030314
9. Wolfe KH (2001) Yesterday’s polyploids and the mystery of diploidization. Nat Rev Genet 2(5):333–341. doi: 10.1038/35072009
10. Rabier C-E, Ta T, Ané C (2014) Detecting and locating whole genome duplications on a phylogeny: a probabilistic approach. Mol Biol Evol 31(3):750–762. doi: 10.1093/molbev/mst263
11. Kuraku S (2010) Palaeophylogenomics of the vertebrate ancestor-impact of hidden paralogy on hagfish and lamprey gene phylogeny. Integr Comp Biol 50(1):124–129. doi: 10.1093/icb/icq044
12. Feiner N, Begemann G, Renz AJ, Meyer A, Kuraku S (2009) The origin of bmp16, a novel Bmp2/4 relative, retained in teleost fish genomes. BMC Evol Biol 9(1):277. doi: 10.1186/1471-2148-9-277
13. Chen D, Zhao M, Mundy GR (2004) Bone morphogenetic proteins. Growth factors 22(4):233–241. doi: 10.1080/08977190412331279890
14. Wu MY, Hill CS (2009) TGF-β superfamily signaling in embryonic development and homeostasis. Dev Cell 16(3):329–343. doi: 10.1016/j.devcel.2009.02.012
15. Nishimura R, Hata K, Matsubara T, Wakabayashi M, Yoneda T (2012) Regulation of bone and cartilage development by network between BMP signalling and transcription factors. J Biochem 151(3):247–254. doi: 10.1093/jb/mvs004
16. Sampath TK, Rashka KE, Doctor JS, Tucker RF, Hoffmann FM (1993) Drosophila transforming growth factor β superfamily proteins induce endochondral bone formation in mammals. Proc Natl Acad Sci USA 90(13):6004–6008. doi: 10.1073/pnas.90.13.6004
17. Padgett RW, Wozney JM, Gelbart WM (1993) Human BMP sequences can confer normal dorsal-ventral patterning in the Drosophila embryo. Proc Natl Acad Sci U S A 90(7):2905–2909. doi: 10.1073/pnas.90.7.2905
18. Zhang H, Bradley A (1996) Mice deficient for BMP2 are nonviable and have defects in amnion/chorion and cardiac development. Development 122(10):2977–2986.
19. Marques CL, Fernández I, Rosa J, Viegas MN, Cancela ML, Laizé V (2014) Spatiotemporal expression and retinoic acid regulation of bone morphogenetic proteins 2, 4 and 16 in Senegalese sole. J Appl Ichthyol 30(4):713–720. doi: 10.1111/jai.12539
20. Goldman DC, Donley N, Christian JL (2008) Genetic interaction between Bmp2 and Bmp4 reveals shared functions during multiple aspects of mouse organogenesis. Mech Dev 126(3-4):117–127. doi: 10.1016/j.mod.2008.11.008
21. Upton PD, Long L, Trembath RC, Morrell NW (2008) Functional characterization of bone morphogenetic protein binding sites and Smad1/5 activation in human vascular cells. Mol Pharmacol 73(2):539–552. doi: 10.1124/mol.107.041673
22. Hung W-T, Wu F-J, Wang C-J, Luo C-W (2012) DAN (NBL1) specifically antagonizes BMP2 and BMP4 and modulates the actions of GDF9, BMP2, and BMP4 in the rat ovary. Biol Reprod 86(5):158. doi: 10.1095/biolreprod.111.096172
23. Abascal F, Zardoya R, Telford MJ (2010) TranslatorX: multiple alignment of nucleotide sequences guided by amino acid translations. Nucleic Acids Res 38(Web Server issue):W7–W13. doi: 10.1093/nar/gkq291
24. Galtier N, Gouy M, Gautier C (1996) SEAVIEW and PHYLO_WIN: two graphic tools for sequence alignment and molecular phylogeny. Bioinformatics 12(6):543–548. doi: 10.1093/bioinformatics/12.6.543
25. Castresana J (2000) Selection of conserved blocks from multiple alignments for their use in phylogenetic analysis. Mol Biol Evol 17(4):540–552. doi: 10.1093/oxfordjournals.molbev.a026334
26. Stamatakis A (2006) RAxML-VI-HPC: maximum likelihood-based phylogenetic analyses with thousands of taxa and mixed models. Bioinformatics 22(21):2688–2690. doi: 10.1093/bioinformatics/btl446
27. Foster PG (2004) Modeling compositional heterogeneity. Syst Biol 53(3):485–495. doi: 10.1080/10635150490445779
28. Keane TM, Creevey CJ, Pentony MM, Naughton TJ, Mclnerney JO (2006) Assessment of methods for amino acid matrix selection and their use on empirical data shows that ad hoc assumptions for choice of matrix are not justified. BMC Evol Biol 6(1):29. doi: 10.1186/1471-2148-6-29
29. Le SQ, Gascuel O (2008) An improved general amino acid replacement matrix. Mol Biol Evol 25(7):1307–1320. doi: 10.1093/molbev/msn067
30. Eswar N, Webb B, Marti-Renom MA, Madhusudhan MS, Eramian D, Shen M-Y, et al. (2006) Comparative protein structure modeling using Modeller. In: John Wiley and Sons (ed) Curr. Protoc. Bioinforma., 2014th ed. pp 5.6.1–5.6.30
31. Keller S, Nickel J, Zhang J-L, Sebald W, Mueller TD (2004) Molecular recognition of BMP-2 and BMP receptor IA. Nat Struct Mol Biol 11(5):481–488. doi: 10.1038/nsmb756
32. Sali A, Blundell TL (1993) Comparative protein modelling by satisfaction of spatial restraints. J Mol Biol 234(3):779–815. doi: 10.1006/jmbi.1993.1626
33. Shen M, Sali A (2006) Statistical potential for assessment and prediction of protein structures. 15(1):2507–2524. doi: 10.1110/ps.062416606.Instead
34. Vijayakumar P, Laizé V, Cardeira J, Trindade M, Cancela ML (2013) Development of an in vitro cell system from zebrafish suitable to study bone cell differentiation and extracellular matrix mineralization. Zebrafish 10(4):500–509. doi: 10.1089/zeb.2012.0833
35. Tiago DM, Marques CL, Roberto VP, Cancela ML, Laizé V (2014) Mir-20a regulates in vitro mineralization and BMP signaling pathway by targeting BMP-2 transcript in fish. Arch Biochem Biophys 543:23–30. doi: 10.1016/j.abb.2013.12.009
36. Korchynskyi O, ten Dijke P (2002) Identification and functional characterization of distinct critically important bone morphogenetic protein-specific response elements in the Id1 promoter. J Biol Chem 277(7):4883–4891. doi: 10.1074/jbc.M111023200
37. Pfaffl MW (2001) A new mathematical model for relative quantification in real-time RT-PCR. Nucleic Acids Res 29(9):e45. doi: 10.1093/nar/29.9.e45
38. Andersen CL, Jensen JL, Ørntoft TF (2004) Normalization of Real-Time Quantitative Reverse Transcription-PCR Data : A Model-Based Variance Estimation Approach to Identify Genes Suited for Normalization , Applied to Bladder and Colon Cancer Data Sets Normalization of Real-Time Quantitative Reverse .
39. Pfaffl MW, Tichopad A, Prgomet C, Neuvians TP (2004) Determination of stable housekeeping genes , differentially regulated target genes and sample integrity : BestKeeper – Excel-based tool using pair-wise correlations. :509–515.
40. Meyer A, Van de Peer Y (2005) From 2R to 3R: evidence for a fish-specific genome duplication (FSGD). Bioessays 27(9):937–945. doi: 10.1002/bies.20293
41. Allendorph GP, Vale WW, Choe S (2006) Structure of the ternary signaling complex of a TGF-β superfamily member. Proc Natl Acad Sci U S A 103(20):7643–7648. doi: 10.1073/pnas.0602558103
42. Panopoulou G, Poustka AJ (2005) Timing and mechanism of ancient vertebrate genome duplications - the adventure of a hypothesis. Trends Genet 21(10):559–567. doi: 10.1016/j.tig.2005.08.004
43. McCauley DW, Bronner-Fraser M (2004) Conservation and divergence of BMP2/4 genes in the lamprey: expression and phylogenetic analysis suggest a single ancestral vertebrate gene. Evol Dev 6(6):411–422. doi: 10.1111/j.1525-142X.2004.04054.x
44. Yang H (2013) Conserved or lost: molecular evolution of the key gene GULO in vertebrate vitamin C biosynthesis. Biochem Genet 51(5-6):413–425. doi: 10.1007/s10528-013-9574-0
45. Pasquier J, Lafont A-G, Rousseau K, Quérat B, Chemineau P, Dufour S (2014) Looking for the bird Kiss: evolutionary scenario in sauropsids. BMC Evol Biol 14(1):30. doi: 10.1186/1471-2148-14-30
46. Castro LFC, Lopes-Marques M, Gonçalves O, Wilson JM (2012) The evolution of pepsinogen C genes in vertebrates: duplication, loss and functional diversification. PLoS One 7(3):e32852. doi: 10.1371/journal.pone.0032852
47. Davit-Béal T, Tucker AS, Sire J-Y (2009) Loss of teeth and enamel in tetrapods: fossil record, genetic data and morphological adaptations. J Anat 214(4):477–501. doi: 10.1111/j.1469-7580.2009.01060.x
48. Cuypers TD, Hogeweg P (2014) A synergism between adaptive effects and evolvability drives whole genome duplication to fixation. PLoS Comput Biol 10(4):e1003547. doi: 10.1371/journal.pcbi.1003547
49. Van Hoek MJA, Hogeweg P (2009) Metabolic adaptation after whole genome duplication. Mol Biol Evol 26(11):2441–2453. doi: 10.1093/molbev/msp160
50. Gates MA, Kim L, Egan ES, Cardozo T, Sirotkin HI, Dougan ST, et al. (1999) A genetic linkage map for zebrafish: comparative analysis and localization of genes and expressed sequences. Genome Res 9:334–347. doi: 10.1101/gr.9.4.334
51. Taylor JS, Braasch I, Frickey T, Meyer A, Van de Peer Y (2003) Genome duplication, a trait shared by 22,000 species of ray-finned fish. Genome Res 13(3):382–390. doi: 10.1101/gr.640303
52. Taylor JS, Van de Peer Y, Braasch I, Meyer A (2001) Comparative genomics provides evidence for an ancient genome duplication event in fish. Philos Trans R Soc B Biol Sci 356(1414):1661–1679. doi: 10.1098/rstb.2001.0975
53. Sato Y, Nishida M (2010) Teleost fish with specific genome duplication as unique models of vertebrate evolution. Environ Biol fishes 88(2):169–188. doi: 10.1007/s10641-010-9628-7
54. Howe K, Clark MD, Torroja CF, Torrance J, Berthelot C, Muffato M, et al. (2013) The zebrafish reference genome sequence and its relationship to the human genome. Nature 496(7446):498–503. doi: 10.1038/nature12111
55. Jaillon O, Aury J-M, Brunet F, Petit J-L, Stange-Thomann N, Mauceli E, et al. (2004) Genome duplication in the teleost fish Tetraodon nigroviridis reveals the early vertebrate proto-karyotype. Nature 431(7011):946–957. doi: 10.1038/nature03025
56. Kingsley DM (1994) The TGF-β superfamily: new members, new receptors, and new genetic tests of function in different organisms. Genes Dev 8(2):133–146. doi: 10.1101/gad.8.2.133
57. Barrett LW, Fletcher S, Wilton SD (2013) Untranslated gene regions and other non-coding elements. SpringerBriefs Biochem Mol Biol 1:1–57. doi: 10.1007/978-3-0348-0679-4
58. Winnier G, Blessing M, Labosky PA, Hogan BL (1995) Bone morphogenetic protein-4 is required for mesoderm formation and patterning in the mouse. Genes Dev 9(17):2105– 2116. doi: 10.1101/gad.9.17.2105
59. Fritz DT, Jiang S, Xu J, Rogers MB (2006) A polymorphism in a conserved posttranscriptional regulatory motif alters bone morphogenetic protein 2 (BMP2) RNA: protein interactions. Mol Endocrinol 20(7):1574–1586. doi: 10.1210/me.2005-0469
60. Helvering LM, Sharp RL, Ou X, Geiser AG (2000) Regulation of the promoters for the human bone morphogenetic protein 2 and 4 genes. Gene 256(1-2):123–138. doi: 10.1016/S0378-1119(00)00364-4
61. Feng JQ, Harris MA, Ghosh-Choudhury N, Feng M, Mundy GR, Harris SE (1994) Structure and sequence of mouse bone morphogenetic protein-2 gene (BMP-2): comparison of the structures and promoter regions of BMP-2 and BMP-4 genes. Biochim Biophys Acta 1218(2):221–224.
62. Groppe J, Greenwald J, Wiater E, Rodriguez-leon J, Economides AN, Kwiatkowski W, et al. (2002) Structural basis of BMP signalling inhibition by the cystine knot protein Noggin. Nature 420(December):636–642. doi: 10.1038/nature01245
63. Tian C, Liu J (2013) Repulsive guidance molecules (RGMs) and neogenin in bone morphogenetic protein (BMP) signaling. Mol Reprod Dev 80(9):700–717. doi: 10.1002/mrd.22199
64. Nohe A, Hassel S, Ehrlich M, Neubauer F, Sebald W, Henis YI, et al. (2002) The mode of bone morphogenetic protein (BMP) receptor oligomerization determines different BMP-2 signaling pathways. J Biol Chem BMP-277(7):5330–5338. doi: 10.1074/jbc.M10BMP-2750BMP-200
65. Little SC, Mullins MC (2009) Bone morphogenetic protein heterodimers assemble heteromeric type I receptor complexes to pattern the dorsoventral axis. Nat Cell Biol 11(5):637–643. doi: 10.1038/ncb1870
66. Wan M, Cao X (2005) BMP signaling in skeletal development. Biochem Biophys Res Commun 328(3):651–657. doi: 10.1016/j.bbrc.2004.11.067
67. Wise SB, Stock DW (2006) Conservation and divergence of Bmp2a, Bmp2b, and Bmp4 expression patterns within and between dentitions of teleost fishes. Evol Dev 8(6):511– 523. doi: 10.1111/j.1525-142X.2006.00124.x
68. Chin AJ, Chen J-N, Weinberg ES (1997) Bone morphogenetic protein-4 expression characterizes inductive boundaries in organs of developing zebrafish. Dev Genes Evol 207(2):107–114. doi: 10.1007/s004270050097
69. Jones CM, Lyons KM, Hogan BL (1991) Involvement of Bone Morphogenetic Protein-4 (BMP-4) and Vgr-1 in morphogenesis and neurogenesis in the mouse. Development 111(2):531–542.
70. Fainsod A, Steinbeisser H, De Robertis EM (1994) On the function of BMP-4 in patterning the marginal zone of the Xenopus embryo. EMBO J 13(21):5015–5025.
71. Bellusci S, Henderson R, Winnier G, Oikawa T, Hogan BL (1996) Evidence from normal expression and targeted misexpression that bone morphogenetic protein (Bmp-4) plays a role in mouse embryonic lung morphogenesis. Development 122(6):1693–1702.
72. Wilson PA, Hemmati-Brivanlou A (1995) Induction of epidermis and inhibition of neural fate by Bmp-4. Nature 376(6538):331–333. doi: 10.1038/376331a0
73. Hwang S-PL, Chen CA, Peng M-Y, Chen C-P (2003) Evolutionary conservation of the bone morphogenetic protein 2/4 gene between diploblastic and triploblastic metazoans. Zool Stud 42(1):227–234.
74. Zou H, Niswander L (1996) Requirement for BMP signaling in interdigital apoptosis and scale formation. Science (80- ) 272(5262):738–741. doi: 10.1126/science.272.5262.738
75. Harris MP, Fallon JF, Prum RO (2002) Shh-Bmp2 signaling module and the evolutionary origin and diversification of feathers. J Exp Zool 294(2):160–176. doi: 10.1002/jez.10157
76. Kültz D (2012) The combinatorial nature of osmosensing in fishes. Physiology 27(4):259– 275. doi: 10.1152/physiol.00014.2012
77. Alexander C, Zuniga E, Blitz IL, Wada N, Le Pabic P, Javidan Y, et al. (2011) Combinatorial roles for BMPs and Endothelin 1 in patterning the dorsal-ventral axis of the craniofacial skeleton. Development 138(23):5135–5146. doi: 10.1242/dev.067801
78. Wordinger RJ, Clark AF (2007) Bone morphogenetic proteins and their receptors in the eye. Exp Biol Med 232(8):979–992. doi: 10.3181/0510-MR-345
79. Hogan BL (1996) Bone morphogenetic proteins: multifunctional regulators of vertebrate development. Genes Dev 10(13):1580–1594. doi: 10.1101/gad.10.13.1580
80. Chalazonitis A, Kessler JA (2012) Pleiotropic effects of the bone morphogenetic proteins on development of the enteric nervous system. Dev Neurobiol 72(6):843–856. doi: 10.1002/dneu.22002
81. Sato T, Mikawa S, Sato K (2010) BMP2 expression in the adult rat brain. J Comp Neurol 518(22):4513–4530. doi: 10.1002/cne.22469
82. Sailer MHM, Hazel TG, Panchision DM, Hoeppner DJ, Schwab ME, McKay RDG (2005) BMP2 and FGF2 cooperate to induce neural-crest-like fates from fetal and adult CNS stem cells. J Cell Sci 118(24):5849–5860. doi: 10.1242/jcs.02708
83. Perry JM, Harandi OF, Paulson RF (2007) BMP4, SCF, and hypoxia cooperatively regulate the expansion of murine stress erythroid progenitors. Blood 109(10):4494–4502. doi: 10.1182/blood-2006-04-016154
84. Shimasaki S, Moore KR, Otsuka F, Erickson GF (2004) The bone morphogenetic protein system in mammalian reproduction. Endocr Rev 25(1):72–101. doi: 10.1210/er.2003-0007
85. Li CW, Ge W (2011) Spatiotemporal expression of bone morphogenetic protein family ligands and receptors in the zebrafish ovary: a potential paracrine-signaling mechanism for oocyte-follicle cell communication. Biol Reprod 85(5):977–986. doi: 10.1095/biolreprod.111.092239
86. Luckenbach JA, Dickey JT, Swanson P (2011) Follicle-stimulating hormone regulation of ovarian transcripts for steroidogenesis-related proteins and cell survival, growth and differentiation factors in vitro during early secondary oocyte growth in coho salmon. Gen Comp Endocrinol 171(1):52–63. doi: 10.1016/j.ygcen.2010.12.016
87. Thompson DL, Gerlach-Bank LM, Barald KF, Koenig RJ (2003) Retinoic acid repression of bone morphogenetic protein 4 in inner ear development. Mol Cell Biol 23(7):2277– 2286. doi: 10.1128/MCB.23.7.2277-2286.2003
88. Hatakeyama S, Ohara-Nemoto Y, Kyakumoto S, Satoh M (1996) Retinoic acid enhances expression of bone morphogenetic protein-2 in human adenocarcinoma cell line (HSG-S8). Biochem Mol Biol Int 38(6):1235–1243.
89. Guo L, Zhao Y, Zhang S, Liu K, Gao X (2008) Retinoic acid down-regulates bone morphogenetic protein 7 expression in rat with cleft palate. Chinese Med Sci J 23(1):28– 31. doi: 10.1016/S1001-9294(09)60006-7
90. Virdi AS, Cook LJ, Oreffo RO, Triffitt JT (1998) Modulation of bone morphogenetic protein-2 and bone morphogenetic protein-4 gene expression in osteoblastic cell lines. Cell Mol Biol 44(8):1237–1246.
91. Simandi Z, Nagy L (2011) Retinoid signaling is a context-dependent regulator of embryonic stem cells. In: Kallos MS (ed) Embryonic stem cells. InTech, pp 55–78
92. Waxman JS, Yelon D (2011) Zebrafish retinoic acid receptors function as context-dependent transcriptional activators. Dev Biol 352(1):128–140. doi: 10.1016/j.ydbio.2011.01.022
93. Grimsrud CD, Rosier RN, Puzas JE, Reynolds PR, Reynolds SD, Hicks DG, et al. (1998) Bone morphogenetic protein-7 in growth-plate chondrocytes: regulation by retinoic acid is dependent on the stage of chondrocyte maturation. J Orthop Res 16(2):247–255. doi: 10.1002/jor.1100160212
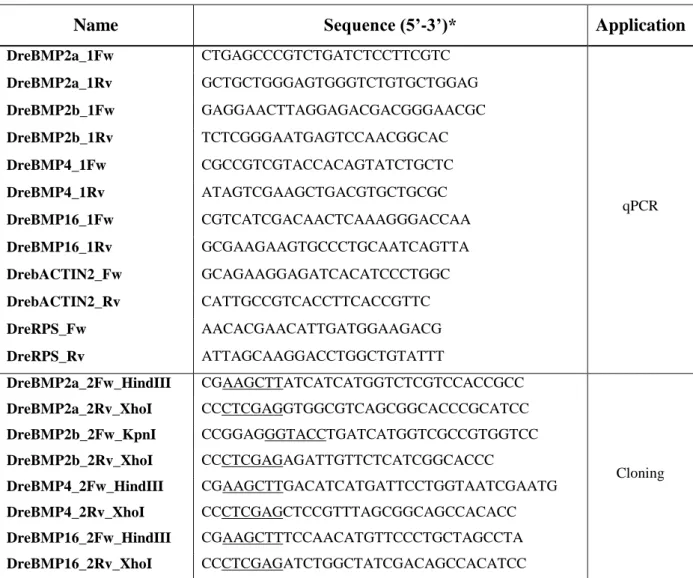
Table 1. PCR primers used in this study to assess gene expression and subclone coding
sequences in expression vectors. Primers were designed according to zebrafish sequences BMP2a (accession no. NM_131359), BMP2b (accession no. NM_131360), BMP4 (accession no. NM_131342), BMP16 (accession no. NM_001171776)
Name Sequence (5’-3’)* Application
DreBMP2a_1Fw CTGAGCCCGTCTGATCTCCTTCGTC qPCR DreBMP2a_1Rv GCTGCTGGGAGTGGGTCTGTGCTGGAG DreBMP2b_1Fw GAGGAACTTAGGAGACGACGGGAACGC DreBMP2b_1Rv TCTCGGGAATGAGTCCAACGGCAC DreBMP4_1Fw CGCCGTCGTACCACAGTATCTGCTC DreBMP4_1Rv ATAGTCGAAGCTGACGTGCTGCGC DreBMP16_1Fw CGTCATCGACAACTCAAAGGGACCAA DreBMP16_1Rv GCGAAGAAGTGCCCTGCAATCAGTTA DrebACTIN2_Fw GCAGAAGGAGATCACATCCCTGGC DrebACTIN2_Rv CATTGCCGTCACCTTCACCGTTC DreRPS_Fw AACACGAACATTGATGGAAGACG DreRPS_Rv ATTAGCAAGGACCTGGCTGTATTT DreBMP2a_2Fw_HindIII CGAAGCTTATCATCATGGTCTCGTCCACCGCC Cloning DreBMP2a_2Rv_XhoI CCCTCGAGGTGGCGTCAGCGGCACCCGCATCC DreBMP2b_2Fw_KpnI CCGGAGGGTACCTGATCATGGTCGCCGTGGTCC DreBMP2b_2Rv_XhoI CCCTCGAGAGATTGTTCTCATCGGCACCC DreBMP4_2Fw_HindIII CGAAGCTTGACATCATGATTCCTGGTAATCGAATG DreBMP4_2Rv_XhoI CCCTCGAGCTCCGTTTAGCGGCAGCCACACC DreBMP16_2Fw_HindIII CGAAGCTTTCCAACATGTTCCCTGCTAGCCTA DreBMP16_2Rv_XhoI CCCTCGAGATCTGGCTATCGACAGCCACATCC
Figures captions
Fig. 1 Taxonomic distribution of bone morphogenetic proteins BMP2, BMP4 and BMP16
(simplified from the Tree of Life at tolweb.org). Presence/absence of BMP2, BMP4 and BMP16 (circled 2, 4 and 16, respectively) were inferred from sequence data collected from NCBI and Ensembl sequence databases. Circled 2a and 2b, Ostariophysi-specific BMP2 paralogs; Circled 2/4, cyclostome- and invertebrate-specific BMP2/4 homologs; Circled ?, missing information; V, Vertebrata; G, Gnathostomata; O, Osteichthyes; Ac, Actinopterygii;
N, Neopterygii; Te, Teleostei; Sa, Sarcopterygii; T, Tetrapoda; A, Amniota; S, Sauropsida; D,
Diapsida.
Fig. 2 Schematic representation of the genomic region flanking vertebrate BMP16 gene using
data from Ensembl project. Genes present in the vicinity of BMP16 locus are indicated in colored boxes irrespectively of their orientation. Gene names are indicated on the left side of each scheme. Unnamed white boxes indicate genes present in the vicinity of BMP16 locus in only one species. Chr, chromosome; LG, linkage group; Sca, scaffold; UNK, unknown. Vertebrate species are: zebrafish Danio rerio, Japanese medaka Oryzias latipes, spotted green pufferfish Tetraodon nigroviridis, three-spined stickleback Gasterosteus aculeatus, Southern platyfish Xiphophorus maculatus, African coelacanth Latimeria chalumnae, Western clawed frog Xenopus tropicalis, green anole Anolis carolinensis, painted turtle Chrysemys picta bellii, chicken Gallus gallus, zebra finch Taeniopygia guttata, mouse Mus musculus, human Homo
sapiens. Gene names are: Gemin7, gem associated protein 7; BMP16, bone morphogenetic
protein 16; PPP1R37, protein phosphatase 1 regulatory subunit 37; SLC30A1, solute carrier family 30 member 1; RAB4B, RAB4B member RAS oncogene family; RHOUB, Ras homolog gene family member Ub; RTN2, reticulon 2; PPM1NA, protein phosphatase Mg2+/Mn2+ dependent 1Na; PTGIR, prostaglandin I2 receptor; CALM1, calmodulin 1; PHC2B, polyhomeotic homolog 2b; MRPL28, mitochondrial ribosomal protein L28; RELB, avian reticuloendotheliosis viral oncogene related B; CLPTM1, cleft lip and palate associated transmembrane protein 1; TBCB, tubulin folding cofactor B; SIX5, sine oculis homeobox 5;
AP2S1, adaptor-related protein complex 2 sigma 1 subunit; BAHD1, bromo adjacent
homology domain containing 1; BMP4, bone morphogenetic protein 4; BLOC1S3, biogenesis of lysosomal organelles complex 1 subunit 3; LGALS4, lectin galactoside-binding soluble 4;