ISCTE Business School
Stress Testing and Asset Allocation for Pension Fund
José Florêncio Ferreira Pinto
Dissertation submitted as partial requirement for the conferral of Master of Science in Finance
Advisor:
Prof. Dra. Diana Mendes, Associate Professor
ISCTE Business School, Department of Quantitative Methods for Management and Economics
2
Abstract
Stress testing is a useful and increasingly popular method of analysing the resilience of financial systems to adverse events. It has been introduced recently to the pensions sector, in some countries, as well. This dissertation aim is to present results from a stress testing based on three different scenarios, two of them with adverse financial market scenarios and the last one related with longevity. The main goals of this test are to observe the impact of the shocks applied to the prime financial assets available in the financial market and to understand their significance in the pension fund portfolio.
Key-Words: Stress testing, pension fund, defined benefit scheme, inflation, risk free rate, longevity, adverse scenarios, risk management, supervision;
3
Resumo
O Teste de Stress é um método cada vez mais útil e popular de análise da resiliência dos sistemas financeiros a eventos adversos. Só recentemente, estes têm sido introduzidos, em alguns países, no sector dos Fundos de Pensões. Esta dissertação pretende apresentar os resultados de testes de stress com base em três diferentes cenários, dois deles baseados em panoramas adversos nos mercados financeiros e um relacionado com a longevidade de vida. Os principais objetivos deste teste são observar o impacto dos diversos choques aplicados aos principais ativos financeiros disponíveis no mercado e entender a sua significância junto dos Fundos de Pensões.
Palavras-Chave: Teste de stress, fundo de pensões, esquema de benefício definido, inflação, taxa de juro sem risco, longevidade, cenários adversos, gestão de risco, supervisão;
4
Acknowledgements
I want to thank the people who accompanied me on this journey, who have always supported me and gave me strength to finish the project.
My special thanks to my best friend and wife, Soraia, for all the support and help in the most difficult moments.
I would like to express my gratitude to my parents, Vitor and Anabela, and my sister, Sara, for giving me this great opportunity and for their unconditional support throughout times.
I want to thank to my advisor, Prof. Dra. Diana Mendes, for the effort and help provided during this project.
5
TABLE OF CONTENTS
Pages Abstract ... 2 List of Figures ... 6 List of Tables ... 7 Glossary ... 8 1. Introduction ... 9 1.1. Background ... 9 1.2. Statement of problem ... 101.3. Purpose of the study ... 14
1.4. Research questions ... 14
1.5. Significance of the study ... 15
1.6. Methodology ... 15
2. Literature review ... 16
2.1. Origin of pension funds ... 16
2.2. The social security complementary schemes ... 17
2.3. Pension funds definitions ... 18
2.4. Types of pension funds ... 19
2.5. Supervision of pension funds ... 20
2.6. Stress testing ... 21
3. Data analysis and interpretation ... 23
3.1. Data ... 23
3.2. Baseline scenario ... 24
3.3. Adverse scenarios ... 24
3.4. Results ... 28
4. Conclusions ... 30
4.1. Limitations of the study ... 31
4.2. Recommendations and future research ... 31
5. References ... 33
Appendix 1 ... 36
6
List of Figures
Pages
Figure 1 – Young population - Total, % of population (1993-2013) 11 Figure 2 – Working age population - Total, % of population (1993-2013) 12 Figure 3 – Elderly population - Total, % of population (1993-2013) 12 Figure 4 – Replacement rate between the first pension and the project salary 13
7
List of Tables
Table 1 – Assets for the baseline scenario 24
Table 2 – Assets for the different tree scenarios 26
Table 3 – Asset allocation before and after the shocks 27
Table 4 – National balance sheet 28
8
Glossary
ASF Autoridade de Supervisão de Seguros e Fundos de Pensões (Insurance and Pension Funds Supervisory Authority of Portugal)
DB Defined Benefit
DC Defined Contribution
DL Decree-law
ECB European Central Bank
EIOPA European Insurance and Occupational Pensions Authority ESRB European Systemic Risk Board
EU European Union
IAS International Accounting Standards
IFRS International Financial Reporting Standards INE National Statistical Institute of Portugal
IOPRP Institutions for Occupational Retirement Provision LBGSSS Lei de Bases Gerais do Sistema de Segurança Social
(General Bases Law of the Social Security System of Portugal) OECD Organization for Economic Cooperation and Development PORDATA Database of Contemporary Portugal
PSPP Public Sector Purchase Program
9
1. Introduction
1.1. Background
In many countries, governments recognize the need to provide pension funds to take care of the ageing population, the dependents of a breadwinner in case of his or her death or the breadwinner in case of invalidity through accidents at work, etc. Pension funds in most countries are managed by government institutions or private firms.
Based on ASF1, we can define a pension fund as an exclusively patrimony assigned to the achievement of one or more pension plans. Each plan can have different conditions and according to the defined in the respective plan, described when and who is entitled to receive a pension under early retirement, old age retirement, disability, or survivor. The allocation is exclusive, since the only purpose of the patrimony of the pension fund is to ensure the executability of the plan or plans and this patrimony not answering for any other obligations of members, participants, contributors, management and depository entities. Private pension funds are run by a financial intermediary for the company and its employees. Pension funds control relatively large amounts of capital and represent the largest institutional investors in many nations.
There are two main types of pension funds management that are widely used, namely: defined contribution plan (CD) and defined benefit plan (DB). The International Accounting Standards (IAS) 19, states that “Under a defined contribution plan, the entity pays fixed contributions into a fund but has no legal or constructive obligation to make further payments if the fund does not have sufficient assets to pay all of the employee’s entitlements to post-employment benefits”. About defined benefit, IAS 19 states that “These plans create an obligation on the entity to provide agreed benefits to current and past employees and effectively places actuarial and investment risk on the entity.” This means that the risk remains with the employer and is your obligation to provide the agreed amount of benefit to current and former employers.
10 Based on this, it is important to know the resilience of the portfolio to resist in different market conditions.
One of these methods is the Stress Test. This is an important supervisory tool to examine the sensitivity of the occupational pensions sector to adverse market developments and to reach robust conclusions for the stability of the financial system as a whole and to enhance consumer protection.
The aim of the following exercise is to test the resilience of one defined benefit pension scheme against tree different adverse scenarios.
1.2. Statement of problem
As in most economies of the world, the social security system in Portugal is financed by distribution of labour income. It means that, through an implicit contract between generations, are the contributions calculated from the working earned income of the active population to finance the expenses on social benefits of the inactive population. So, basically, in a few words, the system transfers the income from the younger population to elderly population. This system is known as Pay-As-You-Go scheme. The ageing population, the increasing tensions between the solidary social policies and the competitiveness policies of nations, the increased intervention in the economy by the state and the disruption of the binomial economic growth/employment are problems for this social security system based on consequences with financial origin. So it will not be too much to say that the social security crisis, was (is) associated with financial issues.
“All developed countries face the process of demographic ageing”2. The pension schemes
of these countries are affected by adverse demographic trends and other factors such as higher unemployment and the adverse financial scenarios. For example, the life expectancy average has been constantly growing and in Portugal3, over the past 35 years, there was an
2 Martin Holub (2010) in their paper “The assessment of the pension base calculation” for Institute for Labour and Social Affairs Prague
11 increase of about 10 years in its total life expectancy. So, this type of scheme is only useful if the sum of the growth rates of the active population and the labor productivity must exceed the sum of the growth rates of the retired population and the actual pensions paid4. Analysing this kind of schemes, Blake (2000)5, states that no-contribution schemes (like Pay-As-You-Go scheme) can be viable if there is a sufficient increase in working life and a corresponding reduction in the reform period. This method it is already applied in Portugal, since in 2013 the government added a sustainability factor in the retirement age calculation6, but, besides these attempts, the social security systems, for the long term and for the current situation, is walking slowly towards bankruptcy.
Figure 1 – Young population - Total, % of population (1993-2013)
Source: OECD Data
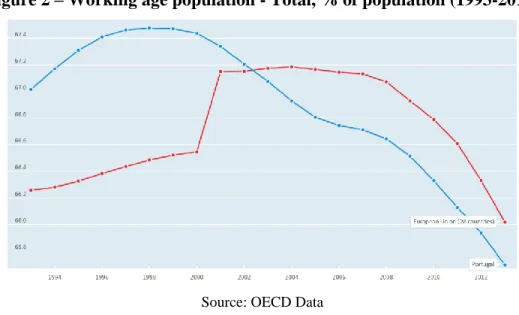
Some of these variables are presented in Figures 1-3, illustrating the clear decrease in the percentage of young population and working age population and a deep increase in the percentage of elderly population. We note that it is a general trend in Europe, but with a steepest situation in Portugal.
4 Paul A. Samuelson (1975) in their journal “Optimum social security in a life-cycle growth model” 5 Blake, D. (2000) in “The Economic Journal”
12 Figure 2 – Working age population - Total, % of population (1993-2013)
Source: OECD Data
Figure 3 – Elderly population - Total, % of population (1993-2013)
Source: OECD Data
In Portugal we can also observe that the tendency of the replacement rate, that show the ratio between the first pension and the project salary, is to constantly decrease.
13 Figure 4 – Replacement rate between the first pension and the project salary
Source: Office for Strategy and Planning in the Ministry of Labour and Social Security
Based on this problem, it is increasingly necessary to look for new savings alternatives, in order to achieve a good life quality at the time of retirement or at least to maintain the same lifestyle and consumption, practiced during the active life. The occupational pension funds are one of the ways than the employers use to protect and help your employees. This type of investment has been growing over the years and like all the other financial instruments they are exposed to all the risks present in the financial market and legislation.
Other relative problem in the financial markets is the current low interest rates. In the wake of the 2008 crisis, interest rates in all the highest-rated countries have fallen to unprecedented low levels. And in Europe, many yields have crossed the zero per cent boundary. This is a truly extraordinary situation; even in the Great Depression of the 1930s7 nominal interest rates never fell into negative territory like can be seen today. In an attend to increase the interest rates, the European Central Bank (ECB) started, on 9th March 2015, the European Quantitative Easing (QE) Program, known as the Public Sector Purchase Program (PSPP). It is usually used when standard monetary policy has become ineffective. The Central Bank implements quantitative easing by buying financial assets from commercial banks and other financial institutions, thus raising the prices of those financial assets and lowering their yield, while simultaneously increasing the money supply. This program didn’t bring anything new, and this means, that the monetary stimulus is necessary
7 In October 1929 the discount rate was 6%, and by October 1930 the discount rate was 2.5%.
14 but not sufficient, as the President of the European Central Bank Mario Draghi, himself said “to be fair, QE has had some success so far. It has lowered the euro and supported exports in Europe. But currency depreciation is temporary and dependent on the reactions by other central banks. You can win a battle, but winning the currency war is a different story”8.
In a global financial system with so many unexpected events, crisis, recessions and depressions one of the increasingly worries related with the occupational pension funds are the ways the national and international supervisory authorities develop forms of control, of knowledge of the market and performance of the pension funds.
1.3. Purpose of the study
The main goal of this study is to test the resilience of one pension fund with a defined benefit scheme against two broad market scenarios and one scenario with increase of the life expectancy.
1.4. Research questions
The two main questions we aim to respond in this dissertation are the following:
- Is the scheme strong to get positive results against the stress test? - The assets will be over or under the liabilities?
15
1.5. Significance of the study
- To determine the risk of support by the employer that has the obligation to assure the financing of the defined benefit scheme.
- To contribute to knowledge in pension fund management.
1.6. Methodology
Due to privacy commitment about the data used, the pension fund identity used to this work will not be mention.
The stress testing is a great tool to measure de resilience of the many financial products, and for this proposal we will apply the stress testing to a fund pension scheme. Based on the last information about this subject, the national and international supervision authorities start to launch some advices and recommendations about the solvency and stress testing scenarios but, until now, few projects are developed. To perform the various scenarios, it will be used the scenarios created by ESRB, in cooperation with ECB and EIOPA, for the stress testing. We will apply the following scenarios:
- 1st scenario: negative demand shock
- 2nd scenario: negative demand shock and a negative supply shock - 3rd scenario: decrease in mortality rates
For these tests, the data will be based in one of the top 5 defined benefit pension funds schemes in Portugal (in respect to the amount under management). The reference date for the valuation of the assets used to baseline is 31th December 2014.
16
2. Literature review
2.1. Origin of pension funds
Traditionally, welfare of the elderly was the role of the family unit. However, as world population grew rapidly, the issue of care for the elderly became a serious problem for the state. Various countries at different points in time could no longer provide the necessary support to the elderly because of improvements in medical care, standard of living, and others, which increased the cost. This led to the creation of pension funds some of which are among the largest financial institutions in many developing and developed countries.
The history said that the first pension fund started in 1875 in the United States of America by the American Express Company. Although established in the 1800’s, the real growth in retirement programs came after World War Two9. The rapid growth was attributed to high-profit taxes imposed on corporations which encouraged some of them to establish pension plans; since the employer’s contributions to qualified pension plans were not tax-deductible and therefore could be funded inexpensively.
Another factor that made the people in America conscious of the need to provide for their future economic security was the Great Depression10 in the 1930’s, where this depression
swept away the life savings of millions of people and created a feeling of insecurity. In Portugal, the pension funds schemes have existed since the early 1900’s with the creation of one social security system. Especially thanks to the workers' associations, there was a growth of mutual assistance associations, but only in 1935 it was possible to lay the foundations for the creation of a system similar to what most European countries already had.
9 Lasted from 1939 to 1945
10 Between 1929 and 1932, worldwide GDP fell by an estimated 15%. By comparison, worldwide GDP fell by less than 1% from 2008 to 2009 during the Great Recession.
17
2.2. The social security complementary schemes
The Social Security complementary schemes can be generally defined as organized form of benefits attribution beyond those that are granted by the Social Security schemes.
We can see the Social Security like a structure for the citizen protection against typical social risks, in particular, disability, old age and death – the tree basic contingencies protect by pensions. This structure/system is primarily public, however, for some time ago; it had begun by taken in account private forms. The LBGSSS in force11 accept the existence of
private ways to recognize the essential role of individuals, families and other non-public institutions in pursuit of the Social Security objectives. One evidence about the acceptation of private ways of Social Security is the principle of complementarity, which determines the articulation of various forms of social protection (public, social, cooperative, mutual and private), in order to improve the coverage situations and promote the sharing of responsibilities at different levels of social protection. This system should still enshrine the principle of unity, which presupposes the articulation of the different systems in terms of harmonization and complementarity.
In Portugal the security systems consist of three pillars with the following characteristics:
- The first pillar is state-organised social security pensions financed on a Pay-As-You-Go basis.
- The second pillar12 is occupational pensions, provided from complementary pension scheme, adopted from the initiative of specific companies or socio/professional groups. So, then are private schemes.
- The third pillar is equally a complementary pension, but this one is voluntary, fully funded by individual savings accounts. Examples of this are the subscription of a capitalisation insurance products or a retirement saving plan.
11 Law nº 4/2007, of 16th of January
12 The OECD (2005) defines second pillar as “occupational or personal pension plans that accumulate dedicated assets to cover the plan’s liabilities. These assets are assigned by law or contract to the pension plan. Their use is restricted to the payment of the pension plan benefits” (p. 15).
18
2.3. Pension funds definitions
Before an in-depth analysis of pension funds, it is important to register some general definitions, based on DL nº 12/2006 of 20th of January13:
Pension Plan – a program that defines the conditions of entitlement to a retirement pension for invalidity, old age, survival or other comparable contingency, in accordance with the provisions of law;
Health Benefits Plan – a program established by a corporative entity that sets the conditions of the right to payment or reimbursement of medical expenses, arising from an involuntary change in the health status of the plan’s beneficiary and incurred after the date of retirement due to age or disability, death or early retirement;
Pension Fund – composed of autonomous assets exclusively earmarked for the fulfilment of one or more pension plans or/and health benefits plans;
Associate – collective person whose pension and health benefits are being funded by a pension fund;
Participant – singular person that contributes to the fund, according to his or hers personal and professional circumstances;
Contributor – singular person that contributes to the fund or a collective person that contributes on behalf and in favour of the Participant
Beneficiary – person that has the right to benefit from the pension or health benefits plan, regardless of being a participant;
19
2.4. Types of pension funds
There are two types of pension plans:
A. Defined benefit plan - Plan which defines benefits in advance and calculates the contributions to guarantee the payment of those benefits;
This plan guarantees in principle retirees and their beneficiaries a fixed amount for life, except in an event of termination of the plan. In that case there is a procedure parties should adhere to. The sponsors of the contribution bear the overall risk of investments. Their contribution depends partly on the return on investment. Another feature of this plan is that plan assets can be invested in the long run. Other investment characteristics are that normally a plan has a positive cash flow, which can be invested with minimal regard for liquidity, first. Investment earnings are tax exempted, second and finally there is no distinction between principal and income beneficiaries in the investment of plan assets and the allocation of investment earnings.
Based on the defined benefit plans we can disaggregate them into three different types:
1) DB Integrated Plan with Social Security14 benefits – established as a global pension, taking into account the benefit already obtained through the Social Security scheme Pay-As-You-Go.
2) DB Not Integrated Plan Security benefits – incorporates the Social Security pension but establishes a limit to the part paid by the private pension fund; 3) Independent DB Plan – independent from the benefits obtained through the
Social Security scheme.
20 B. Defined contribution plan - contributions are determined beforehand while the benefits are determined by the amount of the contributions delivered and its accumulated earnings
In this plan participants also bear the investment risk. The employer’s contribution is not affected by the result obtained from investments on the short run. The plan is very vulnerable to law suits from dissatisfied participants, which can lead to prompt payments to retirees or terminating employees and effect investment policies and the sound solvency position.
Based on the defined contribution plans we can disaggregate them into two different types:
1) Closed Pension Fund – composed of only one member or, if there are multiple members, of a membership united by a contractual agreement that requires the group’s consent regarding the admission of new associates;
2) Open Pension Fund – does not require the existence of any contractual agreement between the different members of the fund, adherence depending solely on the fund’s manager acceptance.
Each one of the above pension fund type can have two different ways of financing, can be classified as contributory plans – plans which involve contributions from participants – or non-contributory plans – plans which do not involve contributions from participants.
2.5. Supervision of pension funds
In Portugal, the IORPS have to respond to the ASF (previously called ISP). The main objectives15 of this authority is to ensure the proper functioning of the insurance market and pension funds, in order to contribute to guarantee the protection of policyholders, insured persons, participants and beneficiaries.
21 Under the European Regulation establishing EIOPA16, one of EIOPA's main tasks is to
contribute to a sound, effective and consistent level of regulation and supervision of IORPs and to ensure that risks related to IORPs activities are appropriately regulated and supervised. In recent years, the European Commission has shown increasing concern about the banks, insurance companies and IORPS. Some of their concerns is to develop harmonization of the requirements within the European Union. During the term of José Barroso as president of the European Commission, Michel Barnier, the European Commissioner for Internal Market and Services said “I want to maintain a level playing field within the Single Market. This means it is important that the same products and activities are subject to the same requirements, regardless of the structure of the providers”17 and “promises of defined-benefit schemes were sometimes made while
underestimating the true costs involved. It would probably not be feasible to immediately apply stricter rules to the outstanding liabilities of pension funds. We must therefore find alternative solutions, including appropriate transitional arrangements”18, showing concerns
in European regulation of this type of products.
2.6. Stress testing
According with the EIOPA recommendations, the IORPS must made the stress testing in two different models, the first one is called the Holistic Balance Sheet (HBS), also known as common methodology, and the second is the National Balance Sheet (NBS), where “the HBS is a tool to support the development of a single, European regulatory regime that accommodates national pension schemes, as defined by national social and labour law and decided upon by employers and the social partners.” The purpose of the HBS is to capture de national situation by allowing IORPs to include explicitly all security and benefit adjustment mechanisms:
16 Based in https://eiopa.europa.eu/regulation-supervision/pensions/occupational-pensions
17 In February of 2012 – related in www.theactuary.com/news/2012/02/barnier-moves-to-dispel-fears-over-solvency-ii-for-pensions/
22 On the asset-side, the value of sponsor support may be recognised besides the value
of investments;
On the liability-side, various types of pension obligations are included in the best estimate of technical provisions as well as possible benefit reductions.
The holistic balance sheet approach is connected to the literature on framing pension funds in terms of embedded options. Since the classic paper of Sharpe (1976), there has been a large number of applications of contingent claim analysis to real-life problems in the fields of pensions and insurance (see for instance: Blake 1998; Chapman, Gordon and Speed 2001; Guillén, Jørgensen, and Nielsen 2006; Kocken 2006, Hoevenaars and Ponds 2008).
23
3. Data analysis and interpretation
3.1. Data
In order to collect the data, the main source was the portfolio statement of the studied pension fund. As we already said, the reference date for all the data used in this work is 31th December 2014. To know the population characteristics, the cash flows and the fund's liabilities, it was taken into account the report of the responsible actuary. The collected data were processed in files created by EIOPA in order to help IORPS for this type of testing. Some indicators and values were obtained through actuarial programs, methodologies and assumptions used for the respective results will be identified. The actuary report used to know the liability of the scheme uses the mortality table TV 73/77 (-2 years) for the male participants and TV 80/82 (-2 years) for the women participants.
The national balance sheet technical provisions are based on the Funding Scenario and the current funding requirement (higher or unique) is based on the Minimum Funding Scenario for the defined benefit schemes. For this it was taken into account 95% of the active population and 100% of the pensioner population of the scheme based on the IAS 19 assumptions and ASF indications. The national balance sheet is calculated taking in consideration the normally assumptions used to evaluate this scheme and the discount rate applicate to the cash flows. In order to determinate the liabilities for the baseline scenario the national balance sheet was 2.5%. For the other scenarios this value is revaluated, taking into account the shocks applied to the scheme.
Additionally, the current funding requirement (minimum, if more than one exists) is based on the theoretical scenario if 4.5% of discount rate would apply.
For the holistic balance sheet the biggest difference compared with the national balance sheet, is that, for the discounted cash flow, it was used the risk-free rate term structure presented in Appendix 1 (Graph 1).
24
3.2. Baseline scenario
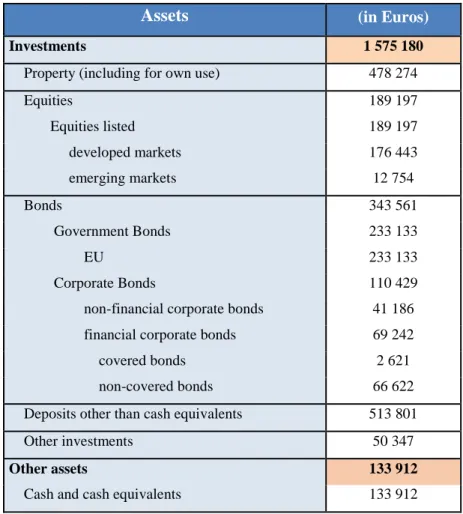
Based on the plan information, it is necessary to produce a baseline scenario. The testing scenarios will be produced centred on this baseline, which is presented in Table 1.
Table 1 – Assets for the baseline scenario
Assets (in Euros)
Investments 1 575 180
Property (including for own use) 478 274
Equities 189 197 Equities listed 189 197 developed markets 176 443 emerging markets 12 754 Bonds 343 561 Government Bonds 233 133 EU 233 133 Corporate Bonds 110 429
non-financial corporate bonds 41 186
financial corporate bonds 69 242
covered bonds 2 621
non-covered bonds 66 622
Deposits other than cash equivalents 513 801
Other investments 50 347
Other assets 133 912
Cash and cash equivalents 133 912
The disaggregation of these assets is illustrated in Appendix 2.
3.3. Adverse scenarios
To perform the results, will be applied tree different scenarios. Two of them have implicit instantaneous shocks applied to:
25 Risk free curve
Inflation curve
Sovereign bond yields Corporate bond yields Equity
Alternatives FX rates
The other scenario only has one variable, the longevity. This is a simple stress test where the only variable it is the mortality rate. This mortality rate will be multiplied by a 0.8 factor, which results in an increase of the life expectancy of the participants.
The first two scenarios had been set by the ESRB in the following terms:
Scenario 1 – negative demand
o Reversal in recent developed market equity rally o EU risk free rates fall
o Sovereign spreads widen o Credit spreads widen o Euro appreciates
o Medium term inflation expectations fall, long and short term was less affected
Scenario 2 – negative demand and negative supply o Supply shock causes abrupt fall in the asset prices o Euro depreciates
o Credit spreads widen (like in scenario 1)
o Increase in short and medium term inflation expectations o Fall in risk free rates
26 Specifically, the scenarios will reflect the shocks specified in Appendix 1. The market risks in the two adverse market scenarios are calibrated to occur instantaneously and simultaneously. The longevity scenario comprises an instantaneous, single-factor shock to life expectancy.
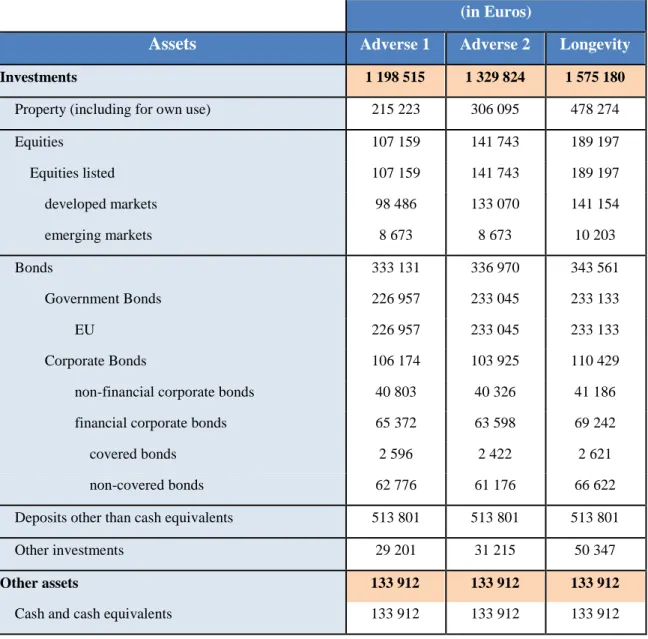
After applying the shocks specified in Appendix 1 directly to the assets, the following table (Table 2) it is obtained.
Table 2 – Assets for the different tree scenarios
(in Euros)
Assets Adverse 1 Adverse 2 Longevity
Investments 1 198 515 1 329 824 1 575 180
Property (including for own use) 215 223 306 095 478 274
Equities 107 159 141 743 189 197 Equities listed 107 159 141 743 189 197 developed markets 98 486 133 070 141 154 emerging markets 8 673 8 673 10 203 Bonds 333 131 336 970 343 561 Government Bonds 226 957 233 045 233 133 EU 226 957 233 045 233 133 Corporate Bonds 106 174 103 925 110 429
non-financial corporate bonds 40 803 40 326 41 186
financial corporate bonds 65 372 63 598 69 242
covered bonds 2 596 2 422 2 621
non-covered bonds 62 776 61 176 66 622
Deposits other than cash equivalents 513 801 513 801 513 801
Other investments 29 201 31 215 50 347
Other assets 133 912 133 912 133 912
27 Almost all assets verify depreciation versus the baseline scenario. The longevity scenario, since the only variable is the mortality rate, maintains exactly the same structure in their portfolio. To this last scenario the longevity shocks was applied to the static table, and the rate from the static table was multiplied by -20% in order to decrease the probability of mortality.
The main focus in this study is to understand which impacts are verified when something different and unexpected happens to the market. In Pensions Funds, beyond the decrease on the assets fair value and a decrease on the discount rate factor, liabilities of the scheme will grow.
All the pension schemes in Portugal have an investment policy where it is indicated the asset allocation policy and the investment guidelines. This policy clearly indicates how to determinate the category of the asset and the minimum and the maximum percentage that the respective portfolio can have in the composition. After the shocks, actually, another reality comes out and the asset allocation turns quite different, like we can observe in Table 3:
Table 3 – Asset allocation before and after the shocks
(in Euros)
Assets Baseline Adverse 1 Adverse 2
Property (including for own use) 30,36% 17,96% 23,02%
Equities 12,01% 8,94% 10,66%
Bonds 22,83% 29,13% 26,54%
Government Bonds 14,80% 18,94% 17,52%
Corporate Bonds 8,03% 10,19% 9,02%
Other investments (inc Deposits and Cash equivalents) 34,80% 43,97% 39,78%
28
3.4. Results
The main results of this analysis are presented below in Table 4 and 5 and represent the impacts than the adverse scenarios have on the balance of the scheme.
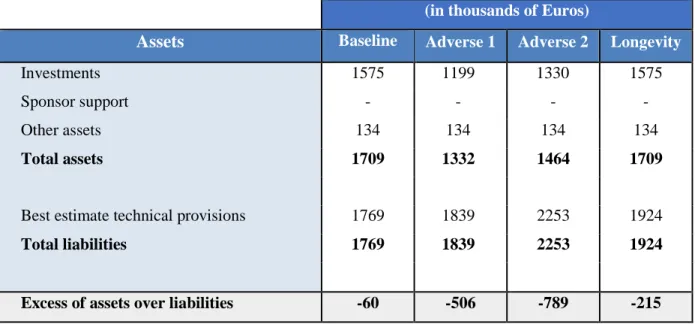
Table 4 – National balance sheet
(in thousands of Euros)
Assets Baseline Adverse 1 Adverse 2 Longevity
Investments 1575 1199 1330 1575
Sponsor support - - - -
Other assets 134 134 134 134
Total assets 1709 1332 1464 1709
Best estimate technical provisions 1769 1839 2253 1924
Total liabilities 1769 1839 2253 1924
Excess of assets over liabilities -60 -506 -789 -215
From Table 4 we can observe that the assets are decreasing for Scenario 1 and 2 comparing with the baseline situation and the liabilities, in the opposite side, are increasing. These means that the funding ratio of the fund will be smaller in the adverse scenarios and this brings bad news for the scheme management, because the schemes will be unfunded. For the longevity scenario the fund scheme has proved some resilience to the brutally decrease of mortality rate.
29 Table 5 – Holistic balance sheet
(in thousands of Euros)
Assets Baseline Adverse 1 Adverse 2 Longevity
Investments 1575 1199 1330 1575
Sponsor support 854 1372 1629 1078
Other assets 134 134 134 134
Total assets 2563 2704 3093 2787
Best estimate technical provisions 2563 2704 3093 2787
Total liabilities 2563 2704 3093 2787
Excess of assets over liabilities - - - -
From Table 5, like we observed in the previous table, the assets are decreasing for Scenario 1 and 2 comparing with the baseline situation and the liabilities are increasing a lot. These means that the funding ratio of the fund will be smaller in the adverse scenarios and this brings bad news for the sponsor of the scheme, since this nullify the impact of liabilities (this method of evaluation increase significantly the liabilities) and the sponsor is called to support this difference. For the longevity scenario, like in the national balance sheet, the fund scheme has proved some resilience to the brutally decrease of mortality rate, although the sponsor is again called to action.
30
4. Conclusions
Based on the obtained results, the studied pension fund scheme, like as expected, suffered some pressure and volatility with the shocks.
The asset allocation is one point that regards attention, because from one moment to another the entire portfolio may change significantly and this may involve even greater implications for the performance of the fund.
In all scenarios, except the one related to the impact on longevity, we saw the fair value of its assets being drastically reduced. Regarding the responsibilities, all scenarios recorded positive differences, compared to the baseline scenario, mainly due to the reduced interest rates, applied to the discounted cash flows.
Looking into the different balance sheets used, we can observe than the scheme has more problems relative with an abruptly change environment in the financial market.
The scheme demonstrated relative resilience to a permanent decrease of 20% in mortality rates, but at the same time they appeared to be much more sensitive to an abrupt drop in interest rates and an increase in inflation rates (scenario 1) and even more to a severe drop in assets prices (scenario 2).
Based on the common methodology, we can observe that this balance makes the scheme more resilience to the changes in the market but, on the other side brings more difficulties to the funding ratio requirements because it will increase the liabilities. Based on this fact, several pension funds professionals have demonstrate their discontent with this situation. The effort made by the European regulator to develop a common methodology has also been criticised. Its analysis has suggested that funding deficits are far higher than if they had been reported under domestic rules. One of them was Joanne Segars, chief executive of the United Kingdom Pensions and Lifetime Savings Association, and she said that was “no justification” for the regulator to use the common methodology and point out that “many more pension schemes would be forced to close if the regulator persisted with this
31 approach”. Many others conclude the same, that is, the idea of creating a common methodology usable in all European countries make not much sense, given the significant differences between the pension systems in different countries.
4.1. Limitations of the study
This study was produced based on a defined benefit scheme and the results can’t be compared with defined contribution scheme, because they have different characteristics. This type of approach is different from what has been done to the date, which also complicate the development of the same, since there are some doubts about the tested model.
Since this subject is relative recent, the available information about this is still rather scarce, which hampered the search and execution of the study. Another limitation is the fact of the complexity to obtain the information regards the liabilities and taking into account the current situation of financial markets it's hard to have full confidence in the assumptions used.
4.2. Recommendations and future research
After this work, many questions are still without answer. It’s possible the imposition of one transversal model for all the European countries? Many pension funds managers related than if this happens, many defined benefit schemes will have great difficulty in surviving and cover the liabilities if this model is applied. This is a very important subject because, taking into account the future outlook (the forecasting for the replacement rate said that this one it will decrease over the years), for some of us, schemes like this it will be important additions to retirement. Many types of studies regarding the pension funds can
32 be made, for example: optimization of the asset allocation, stress testing other scenarios and other schemes, forecasting the liabilities, testing the better assumptions taking into account the current conditions of the market, between others.
I hope that this study can be used to add and give more information about the pension funds and motivate other students to improve this results and finds news methods to achieve the success.
33
5.
References
Journals and Papers
Brunner, G., Hinz. R., and Rocha, R. (2008), Risk-Based Supervision of Pension Funds: A Review of International Experience and Preliminary Assessment of the First Outcomes, World Bank.
Available from: https://openknowledge.worldbank.org/handle/10986/6474
Davis, E. Philip and Hann, Leo De (2012). Pension fund Finance and sponsoring companies. Journal of Pension Economics and Finance, 11, pp 439-463
Available from: http://bura.brunel.ac.uk/bitstream/2438/8278/2/Fulltext.pdf
Financial Services Authority (FSA) (2009), Our Approach to Stress Testing’ Annex 6 in ‘Stress and Scenario Testing: Feedback on CP08/24 and Final Rules.
Available from: http://www.fsa.gov.uk/pubs/policy/ps09_20.pdf
Gisler, T. (2010), Solvency Tests for Pension Funds: An International Analysis with a Standard Model of a Solvency Test for Swiss Pension Funds.
Available from:
http://www1.unisg.ch/www/edis.nsf/SysLkpByIdentifier/3768/$FILE/dis3768.pdf
Haldane, A. (2009). Why Banks Failed the Stress Test, a speech by Mr Andrew G Haldane, Executive Director, Financial Stability, Bank of England at the Marcus-Evans Conference on Stress-Testing, London, 9-10 February 2009.
Available from: http://www.bis.org/review/r090219d.pdf
Impavido, G. (2011), Stress Tests for Defined Benefit Pension Plans – A Primer, IMF Working Paper 11/29.
34 International Association of Insurance Supervisors (IAIS) (2003), Stress Testing by
Insurers, Guidance Paper No. 8 Available from:
http://www.iaisweb.org/__temp/Stress_testing_by_insurers_guidance_paper.pdf
Markowitz, H. (March, 1952). Portfolio theory. Journal of Finance, 7 (1), pp 77–91.
Mccourt, Steven (2006). Defined Benefit and Defined Contribution Plans: A History, Market Overview and Comparative Analysis, 43 Benefits and Compensation Digest.
Available from: http://www.ifebp.org/PDF/webexclusive/06feb.pdf
Samuelson, P. 1975. Optimum social security in a life-cycle growth model. International Economic Review, 16: 539-544.
Available from: https://www.jstor.org/stable/2525994
Joaquim, C. et al. (march 2014) - Os problemas e as soluções para a Segurança Social. Observatório sobre crises e alternativas - centro de estudos sociais da
universidade de Coimbra. Available from: http://www.ces.uc.pt/observatorios/crisalt/documentos/oficinas/Oficinas_Seguran caSocial_textos_atualizacao.pdf
Websites
EIOPA - https://eiopa.europa.eu/Publications/Reports/7._EIOPA-14-108 IORP_II_in_a_Nutshell_What_is_the_Holistic_Balance_Sheet.pdfThe Actuary - http://www.theactuary.com/news/2012/02/barnier-moves-to-dispel-fears-over-solvency-ii-for-pensions/
35 Financial Times - https://www.ft.com/content/5f7e946c-9a77-11e5-9228-87e603d47bdc
Financial Times - https://www.ft.com/content/d33281ec-c5de-11e5-808f-8231cd71622e
Dissertations
Gisler, Thomas, 2010. Solvency Tests for Pension Funds - An International Analysis with a Standard Model of a Solvency Test for Swiss Pension Funds. (PhD Dissertation - Doctor Oeconomiae). Available from: http://www1.unisg.ch/www/edis.nsf/SysLkpByIdentifier/3768/$FILE/dis3768.pdf
Laws
Decree-Law n.º 167-E/2013 Available from: https://dre.pt/application/dir/pdf1sdip/2013/12/25303/0036400369.pdfBrochures
ASF - Pension Funds brochure
Available from: http://www.asf.com.pt/NR/rdonlyres/DD68B381-2A53-4AFE-AD5B-802AAA1198F3/0/FundosPens%C3%B5es.pdf
36
Appendix 1
Stresses Adverse scenario 1 Adverse scenario 2
Probability of occurrence over one-quarter horizon
<0.5% <0.5%
Interest rate swap stresses (absolute change in basic risk-free interest rate curve in bps)
Maturity 1y -65 -54 Maturity 2y -70 -58 Maturity 3y -64 -59 Maturity 5y -58 -56 Maturity 7y -53 -60 Maturity 10y -45 -55 Maturity 20y -40 -70 Maturity 30y -42 -73
Inflation swap curve stresses (absolute change in inflation curve in bps)
Maturity 1y -28 164 Maturity 2y -56 101 Maturity 3y -57 85 Maturity 5y -59 85 Maturity 7y -47 64 Maturity 10y -23 41 Maturity 20y -15 21 Maturity 30y -14 14
Sovereign bond stresses (absolute change in 2-year and 10-year yields in bps)
2-year 10-year 2-year 10-year
Austria (AT) 3 48 21 61 Belgium (BE) 3 87 8 24 Bulgaria (BG) 62 110 118 57 Cyprus (CY) 109 109 0 0 Czech Republic (CZ) 32 121 32 26 Germany (DE) 0 0 0 0 Denmark (DK) 3 44 0 0 Spain (ES) 37 118 12 25 Finland (FI) 0 18 0 0 France (FR) 3 50 9 37 Greece (GR) 466 466 0 0 Croatia (HR) 91 119 0 58 Hungary (HU) 177 231 98 22 Ireland (IE) 39 131 1 2 Italy (IT) 145 146 3 0 Lithuania (LT) 106 248 0 2 Luxembourg (LU) 6 56 0 29 Latvia (LV) 63 155 0 1 Malta (MT) 37 113 2 11 Netherlands (NL) 1 14 0 0 Poland (PL) 150 211 28 0 Portugal (PT) 29 155 0 1 Romania (RO) 114 206 1 0
37
Sweden (SE) 2 16 0 0
Slovenia (SI) 30 121 0 0
Slovakia (SK) 17 94 24 71
United Kingdom (UK) 1 3 0 0
Corporate bond stresses - non-financial corporate (absolute change in credit spread over risk-free interest rate in bps)
AAA 14 91 AA 29 124 A 51 127 BBB 90 135 BB 121 141 B and lower 156 147 Unrated 173 150
Corporate bond stresses - financials - unsecured (absolute change in credit spread over risk-free interest rate in bps)
AAA 17 134 AA 36 130 A 82 166 BBB 251 337 BB 359 441 B and lower 498 579 Unrated 560 639
Corporate bond stresses - financials - covered bonds (absolute change in bps to credit spread over risk-free interest rate curve)
AAA 33 123 AA 41 142 A 72 249 BBB 91 313 BB 116 398 B and lower 139 472 Unrated 150 512
Property stresses (percentage change in the value of property)
Global real estate -46% -62%
- EU -55% -36%
- non-EU -44% -67%
Global real estate -46% -62%
- EU -55% -36%
- non-EU -44% -67%
Equity (listed) stresses (percentage change in the value of equities)
Developed markets -43% -13%
- EU -45% -33%
- US -42% -2%
- other developed -43% -13%
Emerging markets -32% -32%
Equity (listed) stresses (percentage change in the value of equities)
Developed markets -43% -13%
- EU -45% -33%
- US -42% -2%
38
Emerging markets -32% -32%
Alternative investment stresses (percentage change in the value of alternatives)
Private equity (unlisted) -42% -38%
Commodities -46% +56%
Hedge funds -27% -8%
Currency stresses
EUR versus USD exchange rate 20% (a) -2% (b)
(a) Corresponds to a depreciation of the US dollar vis-à-vis of the EUR. (b) Corresponds to an appreciation of the US dollar vis-à-vis of the EUR.
-1,0% -0,5% 0,0% 0,5% 1,0% 1,5% 2,0% 2,5% 3,0% 3,5% 10 20 30 40 50 60
Graph 1 - Risk free interest rate curve
Baseline Adverse scenario 1 Adverse scenario 2
-1,0% -0,5% 0,0% 0,5% 1,0% 1,5% 2,0% 2,5% 10 20 30 40 50 60
Graph 2 - Inflation curve
39
Appendix 2
Information on property
Total property (incl. for own use) 478 274
EU 478 274
non-EU 0
Information on equities
Total listed equities 189 197
Europe 125 973
US 43 267
Other developed 7 202
Emerging markets 12 754
Information on other investments
Total other investments 50 347
Commodities 0
Hedge funds 0
Other 50 347
Information on duration of fixed income assets
Fixed income assets Modified
duration
Bonds 3,8
Government bonds 4,3
Corporate bonds 2,7
Loans and mortgages -
Total fixed income (incl. interest rate derivatives) -
Information on currency risk
Currency name Net exposure Assets exposure Liabilities
exposures
Euro EUR 1 677 587 1 677 587 -
British pound GBP 16 996 16 996 -
Danish krona DKK 645 645 -
Norwegian krone NOK 1 831 1 831 -
Swedish krona SEK 2 528 2 528 -
US dollar USD 1 241 1 241 -