A Decision Support System for the Public Transportation Sector: The
SIGGESC Project
Marco Painho 1, Tiago H. Moreira de Oliveira 2, Roberto Henriques 3
1) New Technologies Laboratory (LabNT) Institute for Statistics and Information Management of the New University of Lisbon (ISEGI-UNL), Lisbon, Portugal
2) LabNT ISEGI-UNL, Lisbon, Portugal
3) LabNT ISEGI-UNL, Lisbon, Portugal
Abstract
SIGGESC is a Geographic Information System (GIS) directed towards the public transportation sector. This GIS contributes to a paradigm shift at IMTT in terms of the process of registering and granting concessions to the bus companies, and also increases IMTT’s ability in other supervision tasks. It allows a better coordination and planning of bus lines, and contributes to the dematerialization of the licensing processes.
This project not only brought an added value to IMTT, but also to the Portuguese passenger transportation companies; by setting up an integrated information system that offers an opportunity to automate work processes and routines, greater efficiency in inspection and licensing processes, and the organization of a database on the public passenger road transport service. Such a database allows the compilation of useful references, indicators and parameters for the regulatory process.
Keywords: Spatial Decision Support Systems, Geographic Information Systems (GIS), GIS Web Applications (WebGIS), Public Transportation, Transportation Planning.
1. Introduction
Institutions responsible for transport planning and management at a national level, particularly with regard to regulation of existing means of transport, are struggling with problems connected with both the quantity and the quality of information available [MILLER, H., 2001]. Digital geographic information has been growing in importance as a result of information technology developments that provide new support tools for decision-making and the problem resolution process in the spatial domain [BUTLER, J.A. , 2008].
According to Butler (2008) Geographic information systems for transportation (GIS-T) are interconnected hardware, software, data, people, organizations and institutional arrangements for collecting, storing, analyzing and communicating particular types of information about the earth. The particular types of information are transportation systems and geographic regions that affect or are affected by these systems. Actually, GIS-T represents one of the most important applications of GIS.
As stated by Miller (2001), GIS-T applications cover much of the broad scope of transportation. Transportation analysts and decision makers are using GIS tools in infrastructure planning, design and management, public transit planning and operations, traffic analysis and control, transportation safety analysis, environmental impacts assessment, hazards mitigation, configuring and managing complex logistics systems, just to name a few application domains. Intelligent transportation systems, including services such as intelligent vehicle highway systems and automatic vehicle location systems, are a particularly ambitious integration of GIS and communication technologies to a wide variety of transportation services.
In this context, and with a partnership between IMTT1 and ISEGI-UNL, it was developed a Geographic Information System (GIS) – SIGGESC2 – directed towards the public transportation sector. This GIS contributes to a paradigm shift in the IMTT in terms of the process of register and grant concessions to the bus companies, and also increases the IMTT ability in other supervision tasks, allowing a better coordination and planning of the bus lines [PAINHO, M.et al, 2002].
SIGGESC was the first digital geographic information database containing bus lines for continental Portugal. All documents on bus routes existing were printed or hand-drawn maps. Finally, and due to the SIGGESC Project, there is now a solid and reliable digital spatial database that supports the regulation, supervision, coordination and planning, regarding the public transportation issues. It also contributes to the dematerialization of the licensing processes. Besides, SIGGESC contributed to the construction of a structured, organized and updated database with information concerning public transportation, which resulted in strengthened communication relations and share of information between the bus companies and IMTT.
1
Instituto da Mobilidade e dos Transportes Terrestres, I.P. (Institute for Mobility and Land Transportation)
2 Sistema de Informação Geográfica de Gestão de Carreiras. (Geographic Information System for Bus
2. Background
Spatial decision support systems (SDSS) evolved from the decision support systems (DSS) by including the geospatial context. These systems provide the users with a decision-making environment enabling the analysis of geographical information [DENSHAM, 1991]. There are several technologies that can support spatial decisions, such as the geographic information systems (GIS), the expert systems (ES) the remote sensing (RS) and the DSS [SUGUMARAN, 2010].
This type of framework is characterized by including: (1) analytical modeling capabilities, (2) database management systems, (3) graphical display, (4) reporting tools and (5) decision-makers knowledge [PATEL, 2007].
The most usual applications of SDSS, in the GIS-T field, are in the transportation modeling (Arampatzis, Kuby) or transportation routing problems (Mendoza, Santos, Keenan). The reader interested in an extensive and thorough review of the applications of SDSS is referred to a published book by Sugumaran [2010].
The SIGGESC project started from the need to build a normalized spatial database, with all the bus lines in Portugal, from 133 passenger transportation companies, which represent about 5000 bus lines. The Project consists in the development of a spatial decision support system based on a GIS interface, and was developed in order to aid the regulation, supervision, coordination and planning of the bus lines for the Portuguese institute for mobility and land transportation, the IMTT [HENRIQUES, R.et al, 2004].
The use of this Geographic Information System for the management of bus lines by the bus companies has become mandatory through the publication of the regulatory order Nº 32/2009 by the Ministry of Public Works, Transport and Communications (MOPTC).
The bus companies use the SIGGESC applications (a desktop and a Web/WebGIS application) to create their bus lines, by entering spatial data, for instance, points that represent the bus stops, and lines for the bus routes; they also enter alphanumeric data, such as the attributes of the spatial data and the bus line corresponding schedule. Besides those functionalities, the users can also use SIGGESC to explore the introduced data, create reports and manage their bus lines and networks.
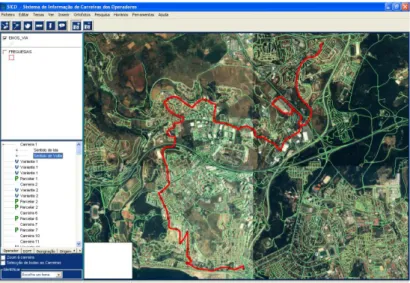
The first version of the desktop application (SICO3) was developed in 2002. This version only allowed the introduction and loading of bus lines by the companies. Before the application was disseminated to all the bus companies, a pilot test was done with two companies, Vimeca and Scotturb, from the municipalities of Oeiras and Cascais, respectively [PAINHO, M.et al, 2003].
Figure 1 – SIGGESC desktop application – SICO – first version interface
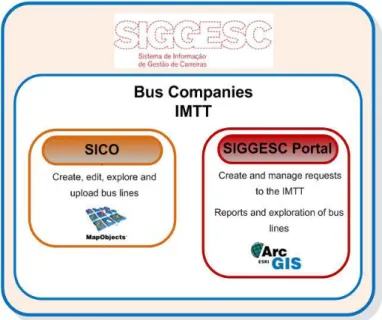
The application has evolved since, and until the year of 2008 it consisted of a set of subsystems, or modular applications, that included the following:
SICO – developed in 2002; SIPI4 – developed in 2003; SAICO5 – developed in 2004; SIAH6 – developed in 2005; SIACC7 – developed in 2006;
Finally, in 2008, the aforementioned five modules were integrated into a single application, SICO v5.0. In 2009 the SIGGESC team started the development of a Web and WebGIS application, with the goal of increasing the efficiency in supervision actions and also in the licensing processes.
Therefore, the SIGGESC currently consists in two application modules: SICO – GIS Desktop Application;
3 Sistema de Informação de Carreiras dos Operadores (Bus lines Information System).
4 Sistema de Informação de Produção de Indicadores (Indicator Production Information System).
5 Sistema de Acesso a Informação de Carreiras e Operadores (Access to Bus lines and Companies
Information Systems.
6 Sistema de Informação de Análise de Horários (Timetable Analysis Information System)
7 Sistema de Informação de Apoio à Concessão de Carreiras (Bus line Licensing Information Support
SIGGESC Portal – Web and WebGIS Application.
Figure 2 – SIGGESC application modules
3. SIGGESC Architecture
With the migration and evolution of SIGGESC to the newest technologies and solutions related with the Web, the current version of the applications support and promote the communication between the bus companies and IMTT, enabling an increased and improved interaction among them, for instance, through the sharing of spatial data by the upload of bus lines to the SIGGESC Portal.
As stated before, the current SIGGESC applications consist of a GIS desktop application (SICO) and a Web/WebGIS application (SIGGESC Portal). SICO allows users to create and edit spatial and alphanumeric data for their bus lines, bus stops, routes and schedules. This application also enables users to automatically and dynamically create reports, and to upload the bus lines to the SIGGESC Portal. On the other hand, the Web/WebGIS application is the preferred interface in the interaction between bus companies and IMTT.
Basically, SICO users (bus companies) have to register their bus lines on this GIS desktop application, which also allows them to explore the entered information, to then send it to IMTT through the upload of the bus lines to the SIGGESC Portal. The SIGGESC users always have the help and guidance of a specialized helpdesk that supports every issue that may occur during the use of these applications. After the upload, the user accesses the SIGGESC Portal, in order to formalize a license request, for instance, to request a new bus line, by sending digital documentation that is necessary to complete the licensing process, such as transitability declaration or proof of tax payments. Also in the SIGGESC Portal the users can create and
explore the spatial and alphanumeric data with automatic reports. Lastly, the IMTT technical staff responsible for inspection and supervision of the bus lines licensing process can either validate or the deny the operator’s request.
Figure 3 – Interaction in the SIGGESC Project
The next two sub sections aim to explore the features available in both of the SIGGESC applications.
3.1 Desktop Application – SICO
The GIS desktop application created for the SIGGESC Project – SICO (figure 4) – was created in 2002 with MapObjects 2.1©, and it has been evolving ever since. The current version of SICO besides the typical navigation and spatial analysis tools that exists in most of the common GIS applications also contains custom-made tools developed exclusively for the public passenger road transport services.
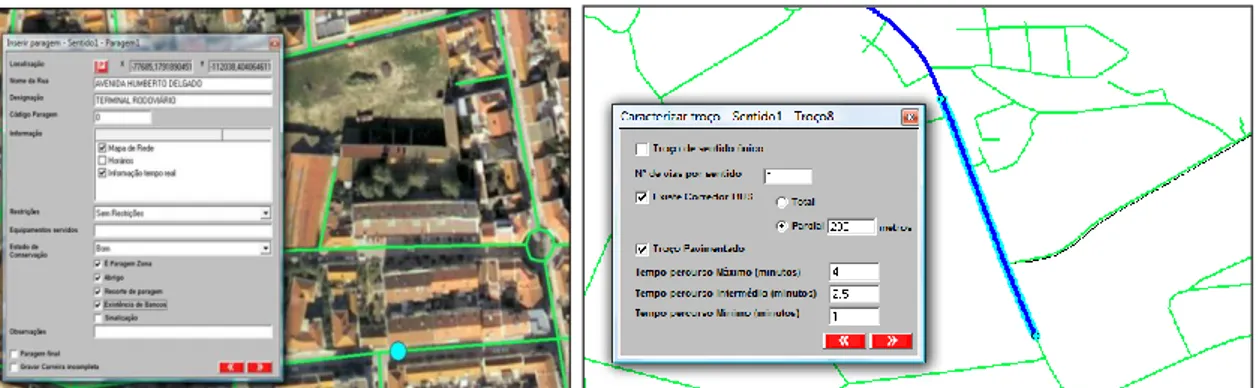
The users have to create and edit both spatial and alphanumeric data regarding their bus lines, and to do so, they have to enter their bus stops and routes (figure 5), with their related attributes (figure 5). In SICO it’s possible to introduce diverse alphanumeric data regarding the bus stops, such as: its physical conditions, if there is a protection in the bus stop, if it’s a main stop, among other attributes. The point features represent the bus stops, while the line features represent the bus route. With SICO it is also possible to enter information regarding the schedules (figure 6).
Figure 5 – Entering bus stops and routes in SICO (spatial and alphanumeric data)
Figure 6 – Entering a schedule
The SICO entered data will be stored in a MS Access database, for the alphanumeric data, while a shapefile records the spatial data (point features for the bus stops, and line features for the routes), in order to ensure interoperability and compatibility with other geographic information systems and applications.
The use of SICO is also an asset for the bus companies in the planning and management of their bus networks, since it’s possible for them to create automatic and dynamic outputs and reports (these reports will be showed later in sub section 4.1).
It also allows users to upload their bus lines directly to the SIGGESC Portal for analysis and validation by the IMTT.
3.2 Web Application – SIGGESC Portal
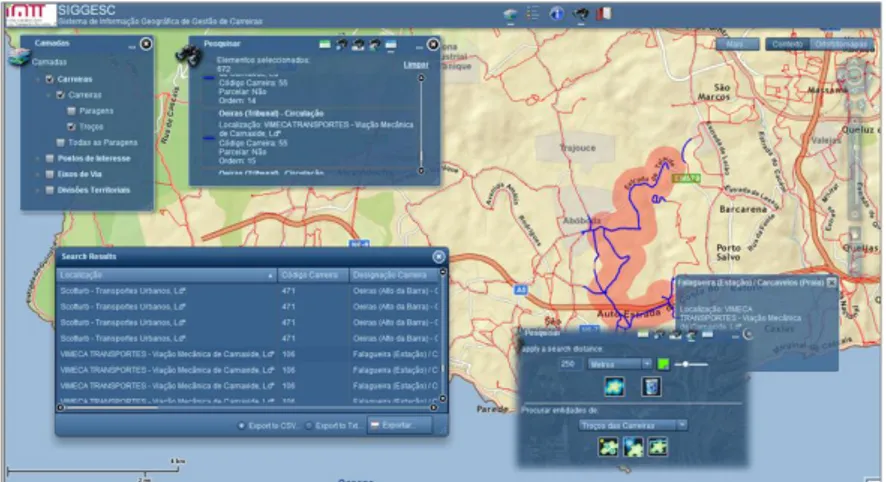
The latest application developed for the SIGGESC Project is the SIGGESC Portal, which is the main application for the interaction between bus companies and IMTT. In this Web/WebGIS application it is possible for users to create dynamic reports in different formats (html, .xls, or .pdf), explore spatial and alphanumeric data regarding the bus lines information, and also download relevant information about the project itself, such as tutorials and applications.
Figure 7 – SIGGESC Portal Interface (Web and WebGIS application)
The Portal also contains specific features for the bus companies’ users, such as the possibility to formalize a license request to the IMTT, in which they can upload and send the necessary documents in order to finish the licensing request process. On the other hand, the IMTT technical staff can analyze and validate the uploaded information.
Figure 8 – Example of a new license request form in the SIGGESC Portal
Embedded in the SIGGESC Portal there’s a WebGIS application that contains all the uploaded bus lines with their complete spatial and alphanumeric data. Besides the typical navigation and
spatial analysis tools, such as zoom in/out, pan, search, among other, there are also some advanced analysis tools such as the possibility to select bus lines contained in a buffer.
Figure 9 – Example of an advanced spatial analysis tool (select bus line by buffer)
As for the SIGGESC Portal system architecture (both the Web and WebGIS components), it is based on the proprietary software, Microsoft© and ESRI© solutions. The database management system its Microsoft SQL Server is the relational database management system (RDBMS) from Microsoft. It is the RDBMS of choice for many scenarios, for its reliability, scalability, and flexibility and included features. For the Spatial Data Management and Interaction, it was used the ArcGIS Server. This software is installed in the application tier of the GIS, and it is responsible for creating spatial web services that will interact with the various GIS applications. In the database component we find the ArcSDE. This software it’s used to enable the storage of spatial information within a multitude of database engines. In the case of Microsoft SQL Server 2008, that already has support for spatial data, it is possible to use the native data types, but ArcSDE is still needed in order to establish connection to the desktop and server components.
The SIGGESC portal system architecture (figure 10) it’s a typical three tier architecture.
In the data tier we suggest the Microsoft SQL Server 2008 providing the data storage, and ESRI ArcSDE managing the spatial information. In the logic tier we have the .NET Framework and the ArcGIS Server providing the web services, both alphanumerical and spatial. This web services will interact with the data stored in the data tier using the .NET features in the alphanumerical data, and ArcGis Server capabilities for the spatial information. Providing the user interface is the Flex API for ArcGIS Server and the ArcGIS Viewer for Flex, communicating and interacting with web services.
Figure 10 – SIGGESC Portal Architecture
4. Results
The use of SIGGESC by most of the Portuguese bus companies has been consolidated and disseminated through several training sessions. So far, the team involved in this project has organized and developed about 40 SIGGESC applications training sessions, resulting in about 90 trained bus companies, in a total universe of 123 companies, which means approximately 73% know to work with the SIGGESC applications. Because most of the companies have more than one technician working in SIGGESC, currently, there are about 200 SIGGESC users.
In addition to the development of the applications and training, the team responsible of the project has also been assuring the maintenance and consolidation of the SIGGESC through specialized and permanent helpdesk that supports the users in every doubts and questions related with the project or its applications. The team has been ensuring a response to any issue in a maximum of 8 hours, and its resolution within 24 hours, with the goal of ensuring a continued a use of the SIGGESC applications by its users.
During a period of two years bus companies have been entering, analyzing and uploading data to the portal. For the Lisbon and Oporto Metropolitan areas (a priority target area for the project), there are about 85% of the bus lines registered in the SIGGESC, which corresponds to 1473 bus lines, 8.3663 Km of bus routes and 34.148 bus stops.
On the following sub sections it will be showing some examples of direct outputs that can be produced directly from SIGGESC applications, and some outputs that were created with the SIGGESC database.
4.1 Reports
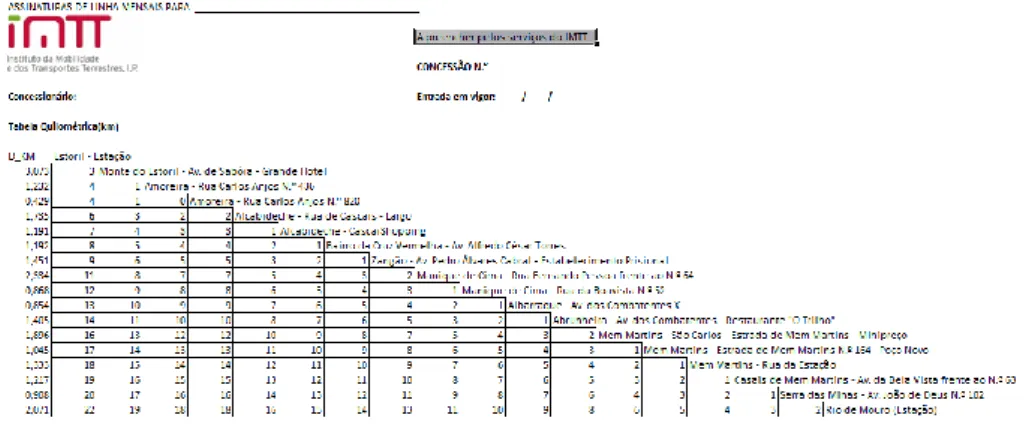
As stated before, both the desktop and Web/WebGIS applications have the ability to create automatic and dynamic reports which is a great value for the bus companies, especially for the ones that don’t have the required technical skills or hardware/software requisites necessary to prosecute and/or calculate some the produced reports. Most of the reports that are produced with the applications correspond to mandatory documents that need to be sent to the IMTT in order to complete the process of a license request, such as the bus line map, the schedule and the fare table (figure 11, 12 and 13). These reports are exported in .pdf, .xls and html (in case of the SIGGESC Portal).
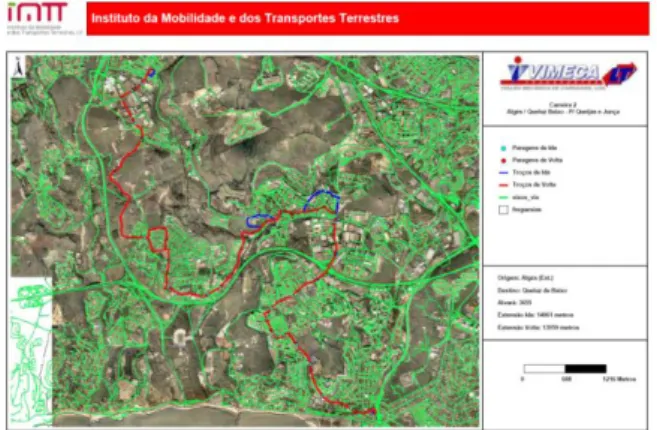
Figure 11 – SICO/SIGGESC Portal Reports: bus line map
Figure 13 – SICO/SIGGESC Portal Reports: fare table
Besides the mandatory reports that the bus companies need to send to the IMTT, there are also other automatic reports that can assist companies in their planning and management daily tasks, such as the bus stop diagram and the bus stop attributes report (figure 14 and 15).
Figure 15 – SICO/SIGGESC Portal Reports: bus stop attributes report
4.2 Outputs created with the SIGGESC database
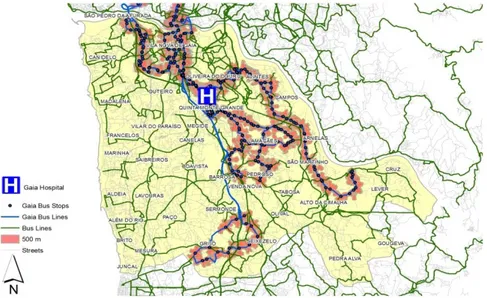
One of the advantages of the SIGGESC database, is its compatibility and interoperability with most of the common GIS applications, which allows and supports the development of studies and analysis of planning and evaluation of investment options, for instance by associating the spatial and alphanumeric data of the bus lines with the occupation of the territory, mobility, census information, etc.
The following maps are an example of what can be produced with the SIGGESC database.
Figure 17 – HospitalPopulation less than 500 meters from a bus stop in Amadora
Figure 18 – Number of bus circulations in Cascais, during the night
5. Conclusions
Currently the SIGGESC is the Portuguese decision support system for the public passenger road transport service sector, and almost every bus company in Portugal, that operate within the IMTT area of jurisdiction, have the applications and use them.
This decision support system supported the dematerialization of the licensing processes in the IMTT, contributing to a more transparent and efficient way of regulate, supervise and plan the bus lines. Other advantage is that finally there is a solid and integrated database with the cadastre of all the bus lines and access to this data could be given to the public in general, trough the SIGGESC Portal or, for instance, with the production of GeoPdf’s.
To disseminate this database and present it to the public in general, in the future, the attributes of the bus lines (bus stops, routes, schedules) contained in the SIGGESC database of each bus company, can also be entered to the Google Maps transit feature, allowing users to plan a trip using public transportation.
The applications could also evolve with the addition of new features, based on the latest technological trends, such as Web 2.0 and public participation, for instance, giving the users the possibility of entering spatial and alphanumeric information in the SIGGESC WebGIS [FU, P., 2011], giving some feedback about some bus stops, routes or schedules, for example, informing that a bus stop no longer exists, or informing that the bus line makes a different route. The SIGGESC database could also be published through Web Map Services (wms), in accordance with the INSPIRE Directive, for access to various public bodies.
According to Butler (2008), GIS-T can play a central role in the new environment for public land-use and transportation decision- making. By allowing a wide-range of information to be integrated based on location, GIS-T fosters (but certainly does not guarantee) a holistic perspective on complex land-use and transportation problems. It also allows analytical and computational tools to be used in conjunction with detailed representations of the local geography, allowing analysis and problem-solving to be tailored to the local context. GIS-T can also greatly reduce the gulf between analysis and communication, allowing greater public input into analytical decisions such as choice of data, modeling assumptions and scenario development.
The SIGGESC project brought an added value to the IMTT and the Portuguese bus companies; by setting up integrated information system that offers an opportunity to automate work processes and routines, greater efficiency in inspection and licensing processes, and the organization of a database on the public passenger road transport service. Such a database allows the compilation of useful references, indicators and parameters for the regulatory process.
6. References
Arampatzis, G. (2004); A GIS-based decision support system for planning urban transportation policies; European Journal of Operational Research; Volume 152, Issue 2, 16 January 2004, Pages 465-475; New Technologies in Transportation Systems
Butler, J.A.; Designing Geodatabases for Transportation. ESRI Press, Redlands California, 2008
Densham, P.J., Spatial decision support systems, In: Maguire, D.J., M.F. Goodchild, and D.W. Rhind, (Eds.), Geographical Information Systems: Principles and Applications, Vol.1, Longmon, Harlow, Essex, England, pp. 403-412, 1991.
DGTT e RISCO; Manual de Planeamento e Gestão de Transportes. Direcção-Geral Transportes Terrestres, Lisboa, 1986
Fu P.; WebGIS Principles and Applications. ESRI Press, Redlands California, 2011
Keenan, Peter B. (1998); Spatial decision support systems for vehicle routing; Decision Support Systems; Volume 22, Issue 1, January 1998, Pages 65-71.
Kuby, Michael (2001); Railway network design with multiple project stages and time sequencing; Journal of Geographical Systems, Volume 3, Issue 1, pp. 25-47 (2001). Henriques, R., Sousa, P., Freitas, M.J.,Seabra,I., Painho, M.; SIGGESC – Sistema de
Informação Geográfica de Gestão de Carreiras, ESIG, 2004
Mendoza, Jorge E. (2009); An evolutionary-based decision support system for vehicle routing: The case of a public utility; Decision Support Systems; Volume 46, Issue 3, February 2009, Pages 730-742
Miller, H.; Shaw, S.; Geographic Information Systems for Transportation – principles and applications. Oxford University Press, New York, USA, 2001
Painho, M.; Henriques, R.; Laginha, C.; A Geo-based information system for transportation planning. Proceedings of the 23rd UDMS Conference, October 1st – 4th Prague, Czech Republic, 2002
Painho, M.; Henriques, R.; Laginha, C.; Sistemas de Indicadores de Transportes: uma abordagem geográfica. Finisterra 38(75): 163-170. Lisboa 2003
Patel, NR (2007). Spatial Decision support System: A Tool for Crop Management. In: Modeling in Resource management and Environment through Geomatics, H. S. Sharma and P. R. Binda (Eds.), Concept Publishers, New Delhi, pp.197-205.
Santos, Luís (2011); A web spatial decision support system for vehicle routing using Google Maps; Decision Support Systems; Volume 51, Issue 1, April 2011, Pages 1-9
Sugumaran, Ramanathan, John Degroote, Vijayan Sugumaran (2010); Spatial Decision Support Systems; CRC Press, Taylor and Francis Group, LLC; Boca Raton, Florida.