Atmospheric Levels of Formaldehyde and Acetaldehyde and their
Relationship with the Vehicular Fleet Composition in
Salvador, Bahia, Brazil
Jailson B. de Andrade*, Marta V. Andrade+, and Heloisa L.C. Pinheiro++
Instituto de Química, UFBA, Campus de Ondina, 40.170.290 Salvador - Ba, Brazil
Received: February 26, 1998
O presente trabalho enfoca os níveis de formaldeído e acetaldeído em fase gasosa e a sua correlação com a frota veicular, em vários locais em Salvador, BA, Brasil. As amostras foram coletadas utilizando cartuchos Sep Pak C18 impregnados com uma solução ácida de 2,4-dinitro-fenilidrazina (DNPH). As hidrazonas resultantes foram separadas e quantificadas através de croma-tografia líquida de alta eficiência. As amostras foram coletadas durante períodos de 1 - 2 h em seis locais na cidade de Salvador, Bahia: em uma estação de ônibus, no interior de um túnel, no estacionamento fechado de um shopping center, no estacionamento fechado de um prédio comercial, em um bairro residencial e em um bairro comercial; e em dois outros locais distantes de Salvador: Cacha Pregos e Lagoa Verde. As concentrações medidas de formaldeído e acetaldeído, estiveram, respectivamente, na faixa de 0,20 - 88 ppbV and 0,40 - 93 ppbV. A relação das concentrações formaldeído/acetaldeído determinadas nesses locais foram: 0,66 (estacionamento do shopping center); 0,65 (estacionamento do prédio comercial); 4,4 (estação de ônibus); 1,2 (túnel); 1,0 (bairro residencial) 1,7 (bairro comercial), 1,1 (Cacha Pregos) e 0,8 (Lagoa Verde). No caso do túnel, este representa a frota total da cidade. Contagens de tráfego, realizadas durante o período de amostragem, revelaram que 82% dos veículos que passaram pelo local eram leves e 18% veículos pesados (diesel). Um cálculo simples utilizando a composição da frota no túnel e a relação formaldeído/acetaldeído na estação de ônibus (como a assinatura dos veículos a diesel) e nos estacionamentos fechados (como a assinatura dos veículos leves), revelou uma relação formaldeído/acetaldeído igual a 1,3 a qual é muito próxima do valor medido 1,2. De forma idêntica, os valores calculados para os bairros comercial e residencial foram, respectivamente 1,7 e 0,62. Isto nos permite concluir que os níveis atmosféricos de formaldeído e acetaldeído em Salvador apresentam uma correlação com a com-posição da frota veicular.
The present work is concerned with the formaldehyde and acetaldehyde content in the gas-phase and their concentrations correlation, with the vehicular fleet, at several sites in Salvador, BA, Brazil. The samples were collected using C-18 Sep Pak cartridges coated with an acidic solution of 2,4-dinitrophenylhydrazine (DNPH). The resulting hydrazones were separated and quantified using HPLC. Samples were collected during 1 - 2 h periods at six sites located in the city of Salvador, Bahia: a bus station, a tunnel, a commercial mall parking lot, a business building parking lot a residential district and a commercial district; and at two other sites far from Salvador: Cacha Pregos and Lagoa Verde. The measured concentrations for formaldehyde and acetaldehyde ranged, respec-tively, from 0.20 to 88 ppbV and from 0.40 to 93 ppbV. The formaldehyde/acetaldehyde concen-tration ratio determined in these sites were: 0.66 (commercial mall parking lot); 0.65 (business building parking lot); 4.4 (bus station); 1.2 (tunnel); 1.0 (residential area), 1.7 (commercial area), 1.1 (Cacha Pregos) and 0.8 (Lagoa Verde). In the case of the tunnel, it represents the hole vehicular fleet of the city. Traffic counts taken during the sampling periods indicated that 82% of the vehicles at that site were light duty engines and 18% were heavy duty vehicles. A simple calculation using the tunnel fleet composition and the ratio formaldehyde/acetaldehyde at the bus station (as a diesel signature) and at the parking (as a light duty vehicles signature) revealed an expected tunnel ratio of 1.3 which is very close to the measured ratio 1.2. Indeed, the expected ratio for both the commercial area and residential area was, respectively, 1.7 and 0.62. It allows us to conclude that
Article
*To whom correspondence should be addressed [email protected] +Present address: Universidade do Estado da Bahia, UNEB, Estrada das Barreiras S/N, 40.000, Salvador, Bahia - Brazil
++Centro Federal de Educação Tecnológica da Bahia- CEFET
the atmospheric level of formaldehyde and acetaldehyde in Salvador has a close relationship with the vehicular fleet composition.
Keywords:formaldehyde, acetaldehyde, carbonyl, alcohol-fueled vehicles
Introduction
Aldehyde sources in the atmosphere include primary emissions from natural vegetation, industrial plants, incin-erators and automobiles, as well as secondary ones via photo-oxidation of methane, isoprene, and other biogenic and anthropogenic hydrocarbons1. The two most abundant
aldehydes in ambient air are formaldehyde and acetalde-hyde1. They are of great significance to atmospheric
chem-istry due to the strong influence these species have on photochemical reactions that lead to the formation of im-portant smog components such as nitric acid, peroxiacetyl-nitrate (PAN), and several others1-3.
In the past decade a substantial amount of information on surface atmospheric levels of formaldehyde and acetal-dehyde has been generated2-14. However, most of the knowledge about formaldehyde and, principally, of acetal-dehyde in the atmosphere comes from measurements in countries where the vehicular fleet is fueled with gasoline and diesel. In this way, information of aldehyde levels, emitted in countries, as is the case in Brazil, where ethanol is used as a fuel and also added to gasoline, as an octane booster (gasohol, gasoline with 18% to 22% v/v ethyl alcohol) are needed for a more complete description of their atmospheric budgets.
The present work is concerned with the determination of formaldehyde and acetaldehyde in closed places and in the atmosphere at a tropical region strongly affected by sea breezes due to the use of ethanol, gasohol and diesel as a fuel.
Experimental
Site description
The metropolitan area of Salvador is located on the Atlantic coast of Brazil at 13°01’S and 38o31’W, with
about 2.2 million inhabitants distributed over a 324 km2
area. Salvador is a tropical city with yearly average maxi-mum and minimaxi-mum temperatures of 32 °C and 19 °C, respectively. The samples were collected at eight sites:
i) at a bus station which corresponds to an area of ca. 13,920 m2. The predominant traffic is diesel fueled buses which could rise the rate of 150 bus/h in rush time. During four days one hour samples, from 8 am to 9 pm, were collected. During the collection period the temperature varied between 27 °C and 30 °C;
ii) at a tunnel which is 300 m long, and carries four lanes of traffic, two in each direction. It is representative of the
vehicle fleet of Salvador because the traffic includes light duty vehicles (average rate 1980 vehicles/hour) which use both hydrous ethanol and gasohol (18-22% ethanol v/v in gasoline) as well as diesel fueled heavy duty vehicles (average rate 420 vehicles/hour). During the collection period the vehicular fleet of Salvador was composed by 41.2% of ethanol fueled vehicles, 49.8% of gasohol fueled vehicles, 8.3% of diesel fueled vehicles and 0.7% of other fuels and the temperature varied between 29 °C and 31 °C; iii) at a commercial mall parking lot (indoor), in which the predominant traffic is light duty vehicles fueled with gasohol or ethanol;
iv) at a business building parking lot (indoor), in which the predominant traffic is light duty vehicles fueled with gasohol or ethanol. The ventilation system in this place was worse than that at a commercial mall parking lot
v) Rio Vermelho district, typical of many in Salvador, is located in a residential neighborhood, at a beach site, where the predominant traffic is light duty vehicles;
vi) Baixa dos Sapateiros district, is located in a com-mercial neighborhood, where the predominant traffic is diesel fueled buses;
vii) Cacha Pregos site, is located on Itaparica Island, 20 km from Salvador, it is a fishing village; and
viii) Lagoa Verde site, is located in a rural area, 250 km from Salvador
Reagent preparation
The DNPH solution was prepared initially 0.1% in acetonitrile/CCl4/H3PO4 85/14/1 (v/v/v). The solution was
then purified by one back extraction with water and diluted to be 0.05% DNPH in acetonitrile/H2O/H3PO4 30/69/1
(v/v/v). It was stored in a 2.5L amber glass bottle containing 200 mL of CCl4 and a Teflon coated magnetic stirring bar.
The blank levels of formaldehyde and acetaldehyde were under 20 nmol/L. A more detailed account of reagent preparation can be found elsewhere2,15.
Preparation of the SEP PAK C18 cartridges
Sampling and analytical methods
Ambient air was pulled through the coated cartridges at 1.0 L/min, during 1 - 2 h. The cartridge samplers were located approximately 1.7 m above the ground. Whilst, at the Rio Vermelho site it was located approximately 9 m above the ground (outside the third floor of a residential building) and at Baixa dos Sapateiros site it was located approximately 4 m above the ground (outside the first floor of a commercial building). After sampling the cartridges were eluted with 5 mL of acetonitrile and aliquots of 10 µL of the liquid phase were injected directly into the HPLC system.
A Varian liquid chromatograph (model 2510) equipped with a Rheodyne injector and a variable UV/VIS detector (model 2550) at 365 nm and 0.02 - 1.28 AUFS was used. The analytical column used was Econosphere C18 5 µm, 250 mm x 4.6 mm i.d. (Alltech). The mobile phase was acetonitrile:water (57:43 v/v) at 1.0 mL/min. A more de-tailed account of the analytical procedures can be found elsewhere16. The detection limit of the HPLC method (S/N = 3 based on peak height) was 0.1 ppbV and 0.05 ppbV for formaldehyde and acetaldehyde, respec-tively, in 120 L of air sampled.
Results and Discussion
In metropolitan areas, vehicular emissions are impor-tant and possibly, at times, the predominant contributors to aldehydes, hydrocarbons and aerosols1,17,18. The aldehyde concentrations in exhaust funes of various automobiles fueled with gasoline have been reported by the NRC1 and formaldehyde is almost always the predominant aldehyde emitted by automobiles powered by gasoline with and without catalytic converters1. In the case of ethanol fueled vehicles the acetaldehyde concentrations emitted are sig-nificantly higher than formaldehyde19,20. The four enclosed
sites: bus station; commercial mall parking lot; business building parking lot and tunnel were affected, mainly, by primary sources where the vehicular emissions are pre-dominant. In the bus station the bus fleet, fueled by diesel, was predominant; at the commercial mall parking lot and at the business building parking lot the light duty vehicles, fueled by both ethanol and gasohol were prevalent; the tunnel is representative of the fleet of Salvador city.
At the bus station the formaldehyde concentrations are significantly higher than acetaldehyde (Figure 1). On aver-age, for eleven samples collected on two different days, the ratio formaldehyde / acetaldehyde was 4.40 ± 0.89 (Table 1). The highest formaldehyde and acetaldehyde concentra-tions measured were, respectively 76 ppbV and 16 ppbV.
At the commercial mall parking lot acetaldehyde con-centrations are higher than formaldehyde (Fig. 1). On av-erage, for five samples collected, the ratio formaldehyde /
Figure 1. Formaldehyde and acetaldehyde concentrations at four closed sites: bus station; commercial mall parking lot; business building parking lot and tunnel.
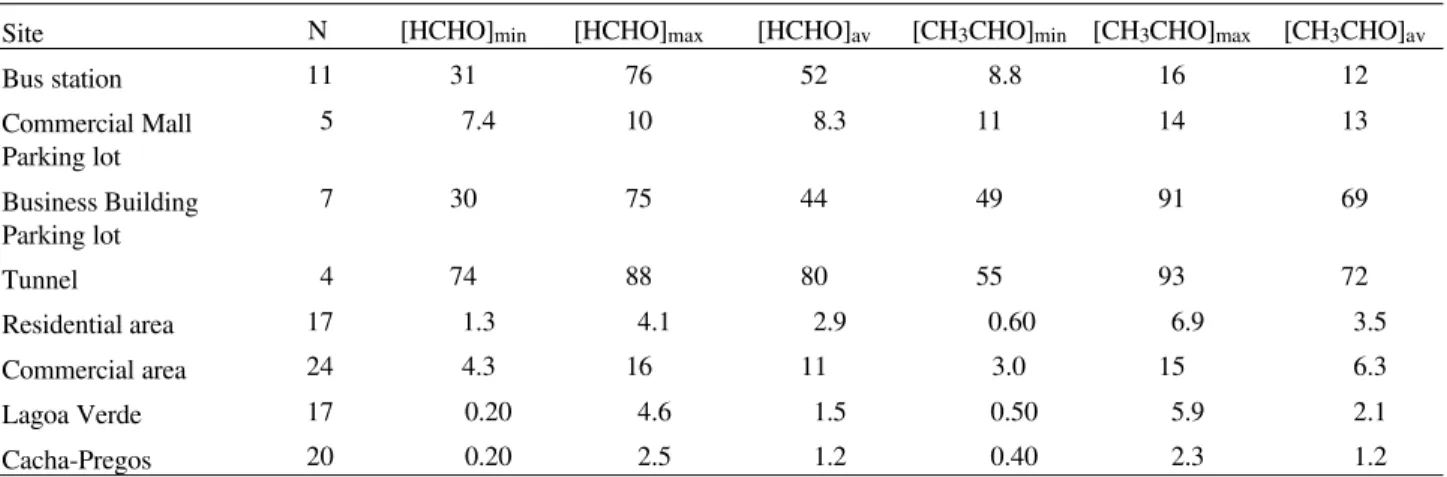
Table 1. Formaldehyde and Acetaldehyde concentrations at several sites.
Site N [HCHO]min [HCHO]max [HCHO]av [CH3CHO]min [CH3CHO]max [CH3CHO]av
Bus station 11 31 76 52 8.8 16 12
Commercial Mall Parking lot
5 7.4 10 8.3 11 14 13
Business Building Parking lot
7 30 75 44 49 91 69
Tunnel 4 74 88 80 55 93 72
Residential area 17 1.3 4.1 2.9 0.60 6.9 3.5
Commercial area 24 4.3 16 11 3.0 15 6.3
Lagoa Verde 17 0.20 4.6 1.5 0.50 5.9 2.1
Cacha-Pregos 20 0.20 2.5 1.2 0.40 2.3 1.2
N = number of samples
acetaldehyde was 0.66 ± 0.07 (Table 1). The highest for-maldehyde and acetaldehyde concentrations measured were, respectively 10 ppbV and 14 ppbV. At the business building parking lot the aldehyde concentrations were about five times higher (Fig. 1) but, on average, for seven samples collected, the ratio formaldehyde / acetaldehyde were close (0.65 ± 0.12) to that measured at the commercial mall parking lot.
In the case of the tunnel (Fig. 1), on average, for four samples collected, the ratio formaldehyde / acetaldehyde was 1.2 ± 0.24. The highest formaldehyde and acetalde-hyde (Table 1) concentrations measured were, respectively 88 ppbV and 93 ppbV. Traffic counts taken during the sampling periods indicated that 82% of the vehicles at the site were light duty engines and 18% were heavy duty vehicles. A simple calculation (see appendix A) using the tunnel fleet composition and the ratio formaldehyde/acet-aldehyde at the bus station (as a diesel signature) and at the parking (as a light duty vehicles signature) revealed an expected tunnel ratio of 1.3 which is very closed to the measured ratio 1.2 (Table 1).
In the case of the commercial area, in which the pre-dominant traffic is diesel fueled buses, formaldehyde, in all samples collected, was the major carbonyl compound ob-served (Fig. 2). On average, for twenty four samples col-lected during five days, the ratio formaldehyde / acetaldehyde was 1.8 ± 0.48 (Table 1). Indeed, using traffic counts done during the sampling period, the expected ratio for this site was 1.7. For the residential area, in which the predominant traffic is light duty vehicles the predominant carbonyl was acetaldehyde (Fig. 2). On average, for seven-teen samples collected during four days, the ratio formal-dehyde / acetalformal-dehyde was 1.0 ± 0.51 (Table 1). In the same way, the calculations revealed an expected formalde-hyde/acetaldehyde ratio of 0.62 to this site. For compari-son, formaldehyde and acetaldehyde were measured in two other sites far from Salvador, Cacha Pregos and Lagoa Verde, where the atmosphere is not subject to influences from traffic. No relationship between the formaldehyde /
acetaldehyde ratios was observed (Fig. 3). It allows us to conclude that the atmospheric level of formaldehyde and acetaldehyde in Salvador has a close relationship to the vehicular fleet composition, as by using traffic counts and the signatures for both diesel and light duty vehicles it is possible to estimate the local formaldehyde/acetaldehyde ratio.
Conclusions
The atmospheric levels of formaldehyde and acetalde-hyde in Salvador have a close relationship with the vehicu-lar fleet composition. We do not have data for ambient levels of carbonyl compounds prior to the introduction of ethanol and gasohol as a vehicle fuel in Brazil. Meanwhile, our study suggests a close relationship between ambient acetaldehyde levels and ethanol use as a vehicle fuel.
Acknowledgments
This work was supported by the National Research Council of Brazil (CNPq). The authors thank Anselmo Elcana de Oliveira and Dr. José Oscar Nogueira Reis for useful discussions. H.L.C.P is supported by a CAPES fel-lowship and M.V.A. is supported by a CNPq felfel-lowship
Appendix A
Traffic counts taken during the sampling periods, into the tunnel, indicated that 82% of the vehicles at that site were light duty engines and 18% were heavy duty vehicles. The formaldehyde/acetaldehyde ratio at the parking, which was used as a light duty vehicles signature, was 0.65. On the other hand, the formaldehyde/acetaldehyde ratio at the bus station, which was used as a diesel signature, was 4.4. Then, the expected formaldehyde/acetaldehyde ratio (ER) inside the tunnel is: ER = 0.82 x 0.65 + 0.18 x 4.4 = 1.3.
References
1. Formaldehyde and Other Aldehydes, National Re-search Council, Committee on Aldehydes, Chapter 5, Figure 2. Formaldehyde and acetaldehyde concentrations at two urban
sites: a commercial district and a residential district.
National Academy of Science Press, Washington, DC.
1981.
2. de Andrade, J.B.; Pinheiro, H.L.C.; Andrade, M.V. J. Braz. Chem. Soc.1995, 3,287.
3. Tanner, R.L.; Miguel, A.H.; de Andrade, J.B.; Gaffney, J.S.; Streit, G.E. Environ. Sci. Technol.1988,
22, 1026.
4. Grosjean, D. Environ. Sci. Technol.1982, 16, 254. 5. Tanner, R.L.; Meng, Z. Environ. Sci. Technol. 1984,
18, 723.
6. Salas, L.J.; Singh, L.J. Atmos. Environ. 1986, 20, 1301.
7. Carlier, P.; Hannachi, H.; Mouvier, G. Atmos. Envi-ron.1986, 20, 2079.
8. Harris, G.W.; MacKay, G.I.; Iguchi, T.; Mayne, G.I.; Schiff, H.I. J. Atmos. Chem. 1989, 8, 119.
9. Grosjean, D.; Miguel A.H.; Tavares, T.M. Atmos. Environ. 1990, 24, 106.
10. Stasumabayashi, H.; Kurita, H.; Chang, Y.; Car-michael, G.R.; Ueda, H. Atmos. Environ. 1995, 29, 255.
11. Yokouchi, Y.; Mukai, H.; Nakajima, K.; Ambe, Y.
Atmos. Environ. 1990, 24A, 439.
12. Schulam, P.; Newbold, R.; Hull, L. A. Atmos. Environ. 1985, 19, 623.
13. Grosjean, E.; Williams II, E.L.; Grosjean, D. J. Air Waste Manage. Assoc. 1993, 43, 469.
14. de Andrade, J.B.; Tanner, R.L. Atmos. Environ. 1992,
26A, 825.
15. de Andrade, J.B.; Pinheiro, H.L.C.; Andrade, M.V.
Quím. Anal. 1996, 15, 144.
16. de Andrade, J.B.; Pinheiro, H.L.C.; Andrade, M.V.
Intern. J. Environ. Anal. Chem.1993, 52, 56. 17. de Andrade, J.B.; Macedo, M.A.; Korn, M.; Oliveira,
E.; Gennari, M.A. Toxicol. and Envir. Chem. 1996,
54, 23.
18. Miguel, A.H. Environ. Sci. Technol.1991, 25, 590. 19. de Andrade, J.B.; Miguel, A.H. Intern. J. Environ.
Anal. Chem. 1985, 21, 229.