ACPD
11, 29407–29439, 2011Bannerclouds at Mount Zugspitze
V. Wirth et al.
Title Page
Abstract Introduction
Conclusions References
Tables Figures
◭ ◮
◭ ◮
Back Close
Full Screen / Esc
Printer-friendly Version Interactive Discussion
Discussion
P
a
per
|
Dis
cussion
P
a
per
|
Discussion
P
a
per
|
Discussio
n
P
a
per
|
Atmos. Chem. Phys. Discuss., 11, 29407–29439, 2011 www.atmos-chem-phys-discuss.net/11/29407/2011/ doi:10.5194/acpd-11-29407-2011
© Author(s) 2011. CC Attribution 3.0 License.
Atmospheric Chemistry and Physics Discussions
This discussion paper is/has been under review for the journal Atmospheric Chemistry and Physics (ACP). Please refer to the corresponding final paper in ACP if available.
Bannerclouds observed at
Mount Zugspitze
V. Wirth1, M. Kristen2, M. Leschner1, J. Reuder3, and J. H. Schween4
1
Institute for Atmospheric Physics, Johannes Gutenberg-University, Mainz, Germany
2
Wetterwarte Garmisch-Partenkirchen/Zugspitze, Garmisch-Partenkirchen, Germany
3
Geophysical Institute, University of Bergen, Bergen, Norway
4
Institute for Geophysics and Meteorology, University of Cologne, Cologne, Germany
We dedicate this paper to the memory of the late Joachim Kuettner, who was our mentor throughout the project.
Received: 19 September 2011 – Accepted: 17 October 2011 – Published: 31 October 2011 Correspondence to: V. Wirth (vwirth@uni-mainz.de)
ACPD
11, 29407–29439, 2011Bannerclouds at Mount Zugspitze
V. Wirth et al.
Title Page
Abstract Introduction
Conclusions References
Tables Figures
◭ ◮
◭ ◮
Back Close
Full Screen / Esc
Printer-friendly Version Interactive Discussion
Discussion
P
a
per
|
Dis
cussion
P
a
per
|
Discussion
P
a
per
|
Discussio
n
P
a
per
|
Abstract
Systematic observations of banner clouds at Mount Zugspitze in the Bavarian Alps are presented and discussed. One set of observations draws on daily time lapse movies, which were taken over several years at this mountain. Identifying banner clouds with the help of these movies and using simultaneous observations of standard variables 5
at the summit of the mountain provides climatological information regarding the ban-ner clouds. In addition, a week-long measurement campaign with an entire suite of instruments was carried through yielding a comprehensive set of data for two specific banner cloud events.
The duration of banner cloud events has a long-tailed distribution with a mean of 10
about 40 min. The probability of occurrence has both a distinct diurnal and seasonal cycle, with a maximum in the afternoon and in the warm season, respectively. These cycles appear to correspond closely to analogous cycles of relative humidity, which maximizes in the late afternoon and during the warm season. In addition, the depen-dence of banner cloud occurrence on wind speed is weak. Both results suggest that 15
moisture conditions are a key factor for banner cloud occurrence. The distribution of wind direction during banner cloud events slightly deviates from climatology, suggest-ing an influence from the specific Zugspitz orography.
The two banner cloud events during the campaign have a number of common fea-tures: the windward and the leeward side are characterized by a different wind regime, 20
however, with mean upward flow on both sides; the leeward air is both moister and warmer than the windward air; the background atmosphere has an inversion just above the summit of Mt. Zugspitze; the lifting condensation level is an increasing function with altitude. The results are discussed, and it is argued that they are consistent with previ-ous Large Eddy Simulations using idealized orography.
ACPD
11, 29407–29439, 2011Bannerclouds at Mount Zugspitze
V. Wirth et al.
Title Page
Abstract Introduction
Conclusions References
Tables Figures
◭ ◮
◭ ◮
Back Close
Full Screen / Esc
Printer-friendly Version Interactive Discussion
Discussion
P
a
per
|
Dis
cussion
P
a
per
|
Discussion
P
a
per
|
Discussio
n
P
a
per
|
1 Introduction
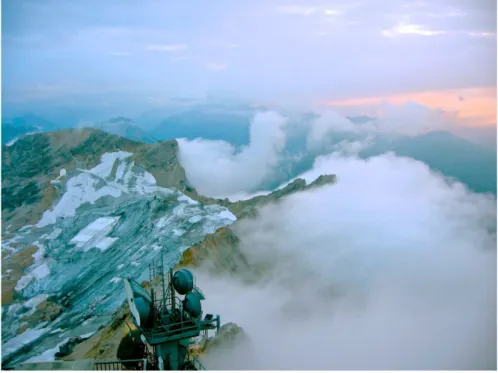
Banner clouds are cloud plumes which extend downwind of steep mountains or sharp ridges even on otherwise cloudfree days (Glickman, 2000). Examples are the banner clouds at Matterhorn in the Swiss Alps or at Mount Zugspitze in the Bavarian Alps (see figure 1). Although this beautiful phenomenon is generally well known, only very few 5
observational reports can be found in the scientific literature (Peppler 1927; K ¨uttner 2000). Based on a set of time lapse movies taken on Mount Zugspitze, Schween et al. (2007) provided a detailed definition of what should (and what should not) be consid-ered a banner cloud. According to their analysis, a banner cloud must simultaneously satisfy four criteria: (1) the cloud should be in a fixed relation to the mountain and occur 10
only on its leeward side; (2) the cloud should not be composed of snow crystals blown offthe mountain by the wind; (3) the cloud should be persistent; (4) the cloud should not be primarily of convective character. The last criterion is meant to distinguish banner clouds from purely convective clouds on days with vanishing mean wind.
Several authors attempted to uncover the key physical ingredients of a banner 15
clouds. Essentially three hypotheses have emerged, explaining banner clouds as due to either the Bernoulli effect (Humphreys 1920; Grant 1944; Huschke 1959; Beer 1974); due to mixing fog (Humphreys 1920), or due to a lee vortex (Hann 1896; Douglas 1928; Hindman and Wick 1990; Geerts 1992a, 1992b). The observations of Schween et al. (2007) favor the latter theory, but their conclusions are merely based on time lapse 20
movies of a few selected banner cloud events. Also, the idealized numerical sim-ulations of Reinert and Wirth (2009) indicate that lee vortices on pyramidal shaped mountains are likely to give rise to banner clouds.
Clearly, progress in the past has been limited by the shortage of systematic observa-tions. A few years ago we, therefore, decided to improve the situation by installing an 25
ACPD
11, 29407–29439, 2011Bannerclouds at Mount Zugspitze
V. Wirth et al.
Title Page
Abstract Introduction
Conclusions References
Tables Figures
◭ ◮
◭ ◮
Back Close
Full Screen / Esc
Printer-friendly Version Interactive Discussion
Discussion
P
a
per
|
Dis
cussion
P
a
per
|
Discussion
P
a
per
|
Discussio
n
P
a
per
|
carried through a measurement campaign during one week in October 2005. There were two banner cloud events during this week, and we carried home a large number of additional data for these two events. It is the goal of the current paper to present the highlights derived from both the long-term observations and the measurement cam-paign.
5
The plan of the paper is as follows. In the next section we give an overview over the various instruments and describe their mode of operation. We proceed in Sect. 3 to quantitatively evaluate our time lapse movies providing statistics regarding the occur-rence of banner clouds at Mount Zugspitze. Section 4 then presents the main results from the campaign, providing a comprehensive set of data for two specific banner cloud 10
events. Finally, we discuss the results in Sect. 5 and draw our conclusions.
2 Observation methodology
Figure 2 gives an overview over the topography of Mount Zugspitze with its main land-marks. In particular, the ridge connecting the summit of Mt. Zugspitze (ZZ) and the Zugspitzeck (ZE) will be refered to as “the ridge” in the following. Banner clouds 15
are usually observed on either side of “the ridge” or in front of the ridge connecting Zugspitzeck and Schneefernerkopf. Altitudes are given in meters above sea level (un-less specified otherwise); local time is given in Central European Time (CET), corre-sponding to UTC+1 (where UTC is Universal Time Coordinated).
The following subsections describe the different observation systems which were 20
used for our study.
2.1 Digital camera
ACPD
11, 29407–29439, 2011Bannerclouds at Mount Zugspitze
V. Wirth et al.
Title Page
Abstract Introduction
Conclusions References
Tables Figures
◭ ◮
◭ ◮
Back Close
Full Screen / Esc
Printer-friendly Version Interactive Discussion
Discussion
P
a
per
|
Dis
cussion
P
a
per
|
Discussion
P
a
per
|
Discussio
n
P
a
per
|
details and sample movies see Schween et al. 2007). The camera was connected to a Linux computer, which recorded one image (640×480 pixels) every 5 s during daylight hours, i.e. from approximately 30 min before sunrise until approximately 30 min after sunset. The images where converted into standard mpeg-1 time lapse movies during the following night. The camera was operational between December 2002 and October 5
2006. Altogether we obtained time lapse movies for 797 days from 38 different months. The corresponding statistics are summarized in Table 1.
2.2 Meteorological data from the summit of Mt. Zugspitze
The German weather service operates a weather station at the summit of Mt. Zugspitze, providing a wealth of in-situ observations. In this work we used hourly 10
data (with only very few gaps) of wind and relative humidity spanning the range 1 Jan-uary 2002–31 December 2006. Based on these data we computed climatologies of the respective variables.
2.3 Masts at the ridge
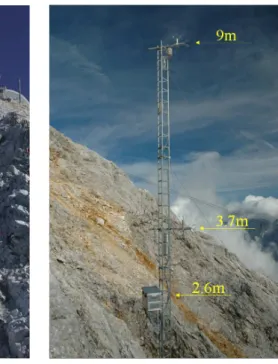
Two 9 m masts were installed, one on either side of the ridge at roughly the same 15
altitude, located approximately 120 m southwest of the observatory on the summit of Mt. Zugspitze (see Fig. 2). Two photographs are shown in Fig. 3. The masts are about 15 m apart, one on the northern and the other one on the southern side of the ridge. Instruments were mounted at 3.7 m and 9 m above mast foot, such that the lower position was well below the ridge and the upper position was slightly above the ridge. 20
At both measurement heights the masts were equipped with sensors for wind, tem-perature, and humidity. Wind was measured using 2D heated sonic anemometers (Windobserver II, Gill, UK). They were chosen for their robustness and a heating op-tion, which proved to be very useful during cloud episodes at temperatures below 0◦C. Two anemometers were mounted at each height, one horizontally and one vertically, 25
ACPD
11, 29407–29439, 2011Bannerclouds at Mount Zugspitze
V. Wirth et al.
Title Page
Abstract Introduction
Conclusions References
Tables Figures
◭ ◮
◭ ◮
Back Close
Full Screen / Esc
Printer-friendly Version Interactive Discussion
Discussion
P
a
per
|
Dis
cussion
P
a
per
|
Discussion
P
a
per
|
Discussio
n
P
a
per
|
Temperature and humidity was measured with combined temperature and humidity sensors (Fischer, Germany). The latter were installed in ventilated radiation shields. At the upper position we installed additional, more robust sensors for both temperature and humidity (HMP243, Vaislala, Finland). The Vaisala humidity sensor is a heated Humicap®KC sensor also used in the Vaisala RS90 radiosondes. Heating the sen-5
sor provides accurate humidity readings especially under fast changing conditions at high relative humidity, when condensation on the sensor renders measurements diffi -cult. Fischer uses a standard capacitive humidity sensor (HIH-3605, Honeywell, USA) which delivers voltages proportional to relative humidity. This signal has to be corrected for a slight temperature dependence of the sensor. Prior to installation the temperature 10
sensors were calibrated in a climate chamber (relative to a calibrated reference pt100), resulting in an accuracy better than 0.05 K within the range−30◦C to+30◦C.
A box mounted at 2.6 m above the foot of each mast housed power supply, data logger and a pressure sensor (Fischer, Germany). Data were measured every 2 s and stored as 5 min averages by electronic data loggers (Combilog, Theodor Friedrichs, 15
Germany). They were transferred via mobile phone around midnight every day. The masts were installed in September 2005. In December 2005 the north mast collapsed in a storm. The southern mast remained in operation until November 2006 and stood until September 2008, when it was dismounted.
2.4 Measurement campaign 20
In order to complement the information from the long-term measurements, an inten-sive observation campaign was conducted in Autumn 2005. Measurements took place during 6–7 and 11–13 October. Two occurrences of a banner cloud were sampled with all instruments up and running: one on 6 October and a second one on 11 October.
Radiosondes (RS90, Vaisala, Finland) were launched three times a day (in the morn-25
ACPD
11, 29407–29439, 2011Bannerclouds at Mount Zugspitze
V. Wirth et al.
Title Page
Abstract Introduction
Conclusions References
Tables Figures
◭ ◮
◭ ◮
Back Close
Full Screen / Esc
Printer-friendly Version Interactive Discussion
Discussion
P
a
per
|
Dis
cussion
P
a
per
|
Discussion
P
a
per
|
Discussio
n
P
a
per
|
obtained through θ=T(p0/p)
R/cp
, where p is pressure, p0=1000 hPa, R is the gas constant for dry air, andcpis the specific heat a constant pressure.
A remote controlled miniature airplane called “Kali” was launched from Zugspitzplatt at 2575 m altitude to provide profiles of temperature and humidity. In total 14 flights were performed, reaching heights between 550 m and 1280 m above the starting alti-5
tude. Details about this measurement system can be found in Egger et al. (2002). A total of 42 pilot balloons were started on an hourly basis and tracked typically sev-eral 100 m above the starting point. They provided wind profiles above the Zugspitz-platt. A detailed description of the pilot balloon tracking system can be found in Egger (1999).
10
3 Banner cloud statistics
Each occurrence of a banner cloud according to the definition in Schween et al. (2007) is called abanner cloud event. In ambigous cases we decided to be conservative in the sense that only those events were taken into account which clearly satisfied our criteria. Ambiguous cases included cases with blowing snow, clouds which were at 15
least partly of convective character, or cases with only brief occurrences of a cloud in the lee and otherwise lots of clouds around the ridge. For each banner cloud event we noted the time of onset and decay of the banner cloud. Each day on which at least one banner cloud event was detected is called abanner cloud day. The numbersNbc of observed banner cloud days are given in the second column of Table 1. The total 20
number of banner cloud days during the four-year period was 170. On some of these days we observed more than one banner cloud event, yielding a total of 221 banner cloud events.
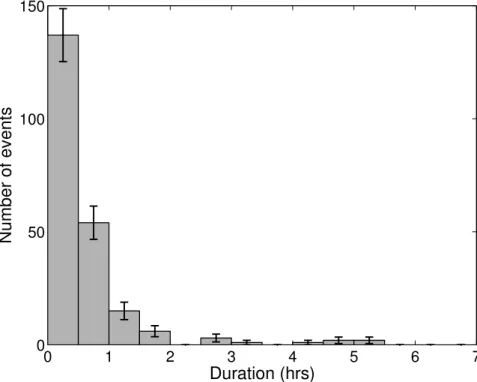
The mean duration of a banner cloud event was 40 min. The distribution of the duration is shown in Fig. 4. It is highly skewed with a dominance of short events of less 25
ACPD
11, 29407–29439, 2011Bannerclouds at Mount Zugspitze
V. Wirth et al.
Title Page
Abstract Introduction
Conclusions References
Tables Figures
◭ ◮
◭ ◮
Back Close
Full Screen / Esc
Printer-friendly Version Interactive Discussion
Discussion
P
a
per
|
Dis
cussion
P
a
per
|
Discussion
P
a
per
|
Discussio
n
P
a
per
|
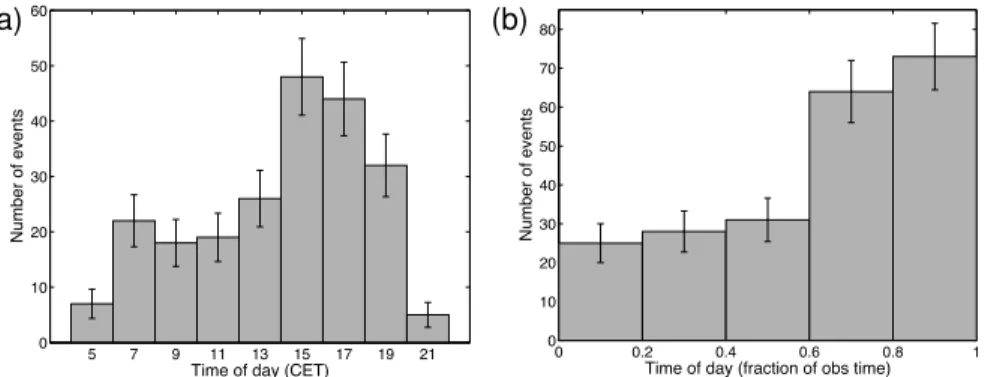
Banner clouds were observed throughout the day. Figure 5a shows the distribution of the banner cloud events as a function of the time of day. The most frequent occurrence of a banner cloud event is in the afternoon between 14:00 and 18:00 CET. However, care needs to be exercised when interpreting this histogram, since a summer day has more hours of daylight than a winter day. As mentioned before, our digital camera 5
was operational each day approximately from 30 min before sunrise until 30 min after sunset. Here, we define the “daily operation time”Td as the time interval from 30 min before sunrise to 30 min after sunset (see the third column of Table 1). The boundaries of this interval were determined for the 15th of each month and interpolated to each day of the year. We then calibrated the time of occurrence of each banner cloud event 10
with respect to the daily observation time. The corresponding histogram is provided in Fig. 5b. Apparently, the chance of occurrence of a banner cloud event on a given day has a distinct diurnal cycle, starting with low values in the morning and increasing to much larger values in the late afternoon; the maximum rate of occurrence during the late afternoon is almost three times as large as the minimum rate of occurrence in the 15
morning. Analyzing the different seasons separately (no plots shown), we found ap-proximately the same qualitative behavior for all seasons except winter, but the number of available observations slightly too limited in order to provide statistically significant diurnal cycles for the individual seasons.
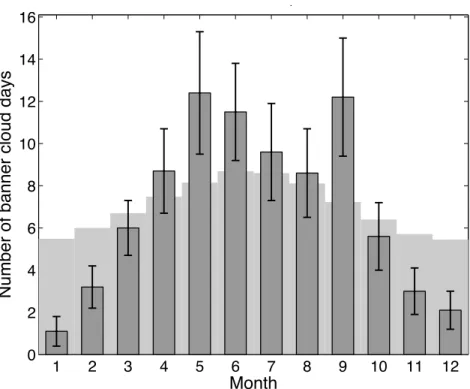
Banner clouds were observed to occur throughout the year, although not with the 20
same frequency in all seasons. The dark bars in Fig. 6 represent the climatology for the number of banner cloud days per month, computed from the numbers in Table 1 asNbc/Nd×(number of days per month). Apparently, there is a clear seasonal cycle
with much larger numbers in summer (approx. 10 per month) than in winter (approx. 2 per month). However, interpreting these numbers requires care because, again, the 25
seasonal cycle of the daylight time needs to be accounted for: at winter solstice the daily observation time Td is around 10 h, while at summer solstice it is around 17 h
ACPD
11, 29407–29439, 2011Bannerclouds at Mount Zugspitze
V. Wirth et al.
Title Page
Abstract Introduction
Conclusions References
Tables Figures
◭ ◮
◭ ◮
Back Close
Full Screen / Esc
Printer-friendly Version Interactive Discussion
Discussion
P
a
per
|
Dis
cussion
P
a
per
|
Discussion
P
a
per
|
Discussio
n
P
a
per
|
the total number of observed banner cloud days is distributed according the length of the daily observation time. Comparing these two distributions reveals that the seasonal cycle of observed banner cloud days is significantly stronger than the seasonal cycle of the daily observation time. We conclude that the probability of occurrence of a banner cloud day has a distinct seasonal cycle: it is significantly larger during the warm season 5
than during the cold season.
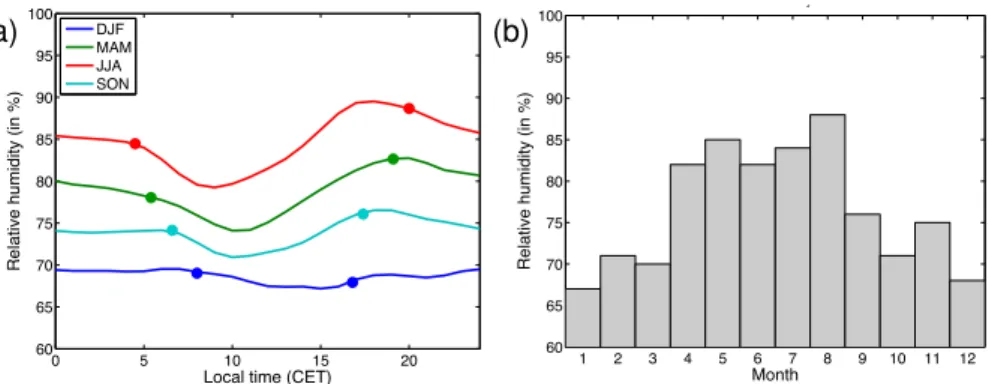
What is the underlying reason for these distinct diurnal and seasonal cycles of ban-ner cloud occurrence? In this context, the availability of moisture is expected to play an important role. For this reason we used the humidity data from the summit (see Sect. 2.2) in order to compute a climatology of the diurnal and the seasonal cycles of 10
relative humidity. The results are shown in Fig. 7a and b, respectively. Except in the winter season, the diurnal cycle shows a pronounced minimum few hours after sun-rise, followed by a monotonic increase, reaching a maximum in the late afternoon or early evening; at night the values are intermediate. Restricting attention to the daylight hours, the rise of relative humidity during the day is similar to the increase of banner 15
cloud occurrence in Fig. 5b. Presumably, the decrease in relative humidity during the morning hours results from a temperature increase due to solar radiation, which heats the ground and the air adjacent to the ground. The increase in relative humidity during the day is likely to result from – on average – the onset of thermal circulations, which advect moister air from below up to the summit level.
20
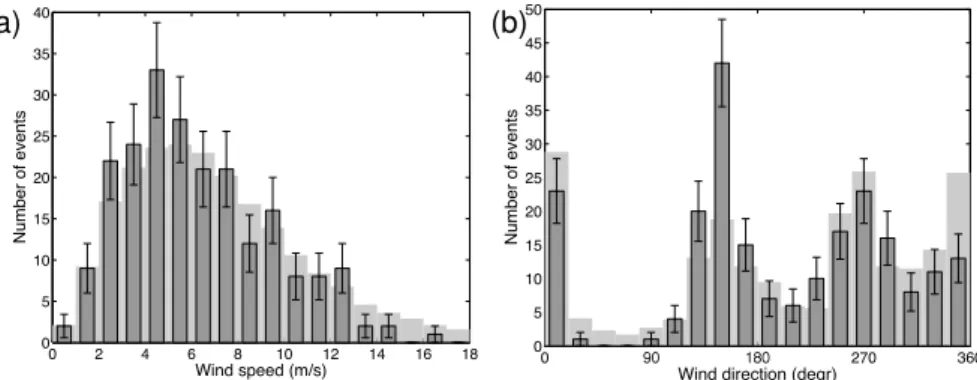
Do the banner clouds have a preference for a certain wind speed or wind direc-tion? In order to address this question, we analyzed wind data from the summit (see Sect. 2.2). Climatological information is obtained by using the full data set. In addition, wind characteristics during the presence of a banner cloud are obtained by selecting only those data which coincide with a banner cloud event.
25
ACPD
11, 29407–29439, 2011Bannerclouds at Mount Zugspitze
V. Wirth et al.
Title Page
Abstract Introduction
Conclusions References
Tables Figures
◭ ◮
◭ ◮
Back Close
Full Screen / Esc
Printer-friendly Version Interactive Discussion
Discussion
P
a
per
|
Dis
cussion
P
a
per
|
Discussion
P
a
per
|
Discussio
n
P
a
per
|
13 ms−1 there is hardly any significant difference. This suggests that the existence of a banner cloud is essentially independent of wind speed.
The histogram for wind direction is shown in Fig. 8b (dark bars). There are three maxima: two of these (approximately northerly and southeasterly) correspond to flow which is approximately perpendicular to the ridge, from opposing directions. The third 5
maximum is for westerly flow; in this case the respective banner clouds occur along the ridge connecting Zugspitzeck and Schneefernerkopf (see Fig. 2); the latter runs roughly north-south such that westerly flow corresponds to flow at right angles to that ridge. The angle distribution in 8b broadly reflects the climatology (light grey background histogram), except that the banner cloud sample seems to slightly avoid the northerly 10
direction and slightly prefer the southeasterly direction.
4 Results from the measurement campaign
There were two banner cloud events during our intensive observation period in October 2005: the first on 6 October, and the second on 11 October. The banner cloud on October 6 persisted for over five hours and was clearly identifiable throughout this 15
time. The event on 11 October, by comparison, was shorter and more intermittent.
4.1 6 October 2005
The banner cloud on 6 October was clearly visible between 12:30 and 18:00 CET. Wind conditions on the ridge throughout the day are displayed in Fig. 9. Denoting the three-dimensional wind vector byu=(u,v,w), the wind speed (panels a and b) is given 20
by |u|=pu2+v2+w2, the angle α with respect to the horizontal (panels e and f) is computed asα=arctan(w/pu2+v2), and the horizontal wind direction (panels c and d) is obtained similarly fromuandv.
ACPD
11, 29407–29439, 2011Bannerclouds at Mount Zugspitze
V. Wirth et al.
Title Page
Abstract Introduction
Conclusions References
Tables Figures
◭ ◮
◭ ◮
Back Close
Full Screen / Esc
Printer-friendly Version Interactive Discussion
Discussion
P
a
per
|
Dis
cussion
P
a
per
|
Discussion
P
a
per
|
Discussio
n
P
a
per
|
the banner cloud event was between 3 and 5 ms−1atz=3.7 m and between 4 and 6 ms−1atz=9 m, indicating a distinct vertical shear. By contrast, on the leeward side of the ridge the wind direction had large scatter and was not at right angle towards the ridge; the wind speed was between 1 and 1.5 ms−1at both z=3.7 m andz=9 m (Fig. 9b) with large fluctuations in direction (Fig. 9d). The angle α is close to 45◦ on 5
the southern side throughout the day (Fig. 9e), while is features a broad distribution on the northern side (Fig. 9f). Note, however, that on average the vertical component on the leeward side is upward, too. Interestingly, the termination of the banner cloud event around 18:00 CET is accompanied by an increase in wind speed on both the windward and the leeward side (panels a and b) and a change in direction on the leeward side 10
(panels d and f). This suggests that the termination of this banner cloud may be at least partly due to a change in the dynamical conditions.
In addition to the measurements on the ridge, we obtained wind profiles above the Zugspitzplatt from the pilot balloon ascents in the late morning and early afternoon (not shown). They indicated flow from east to southeast with large fluctuations of wind 15
speed (both in time and space), increasing – on average – from about 3–4 ms−1right above the surface (at 2575 m altitude) to 6–8 ms−1some 300 m above the surface.
Thermodynamic conditions during 6 October 2005 are summarized in figure 10. Panel d shows time series of temperature on both sides of the ridge. Interestingly, during the period of the banner cloud event (gray shading) the temperature on the lee-20
ward side (blue) is up to 2 degrees higher than on the windward side (red). On the other hand, the temperature difference between both sides is significantly less during the rest of the day. Regarding moisture (not shown), the leeward air mass is saturated throughout most of the day, while the windward airmass has a relative humidity varying between 90 and 100 %. During the period of the banner cloud, both sides are close 25
to saturation, but again the leeward air mass is somewhat moister than the windward airmass.
ACPD
11, 29407–29439, 2011Bannerclouds at Mount Zugspitze
V. Wirth et al.
Title Page
Abstract Introduction
Conclusions References
Tables Figures
◭ ◮
◭ ◮
Back Close
Full Screen / Esc
Printer-friendly Version Interactive Discussion
Discussion
P
a
per
|
Dis
cussion
P
a
per
|
Discussion
P
a
per
|
Discussio
n
P
a
per
|
There is an increase of potential temperature (solid) and a decrease in specific humid-ity (dashed) with increasing altitude. There is a strong inversion at z=1400 m, and an indication for a second weak inversion at aroundz=3400 m above sea level. Com-puting equivalent potential temperatureθe (not shown) we obtained a profile which is rather close to a constant, with values varying between 315 K in the lowest part of the 5
atmosphere and 313 K atz=3000 m (i.e. at the level of the summit of Mt. Zugspitze). Analysing the radiosonde data we found essentially two layers with absolute stability, i.e. where the lapse rateγ=−∂T/∂zis smaller than the moist adiabatic lapse rate (grey shading in Fig. 10a): one in the lower troposphere and a second one for 3300 m< z < 3700 m. Combining the temperature and moisture information from the radiosonde 10
we computed the lifting condensation level (zLCL) associated with each altitude level (Fig. 10b). Overall, these profiles turn out to represent increasing functions with alti-tude, indicating that the air is not well mixed in the vertical. In order to reach saturation at the summit level during the banner cloud event (solid line), a parcel would have to come from below 1850 m altitude. Earlier at 11:25 CET (dotted line), when there was 15
no banner cloud, a parcel would have to come from below 1500 m, which is unlikely as it would have had to cross the strong inversion.
The radiosonde ascent shown in Fig. 10a was downwind of the banner cloud event, and we take it as a rough indication for the typical environmental atmospheric con-ditions. In contrast, the Kali measurements shown in Fig. 10c were taken upwind of 20
the banner cloud event; the corresponding potential temperature profiles are broadly consistent with the measurements from the radiosonde.
4.2 11 October 2005
The banner cloud on 11 October was visible between 16:20 and 18:10 CET, but it showed a rather intermittent behavior at the measurement site on the ridge. The back-25
ACPD
11, 29407–29439, 2011Bannerclouds at Mount Zugspitze
V. Wirth et al.
Title Page
Abstract Introduction
Conclusions References
Tables Figures
◭ ◮
◭ ◮
Back Close
Full Screen / Esc
Printer-friendly Version Interactive Discussion
Discussion
P
a
per
|
Dis
cussion
P
a
per
|
Discussion
P
a
per
|
Discussio
n
P
a
per
|
change in wind speed (Fig. 11a and b) resulting from the change in wind direction in combination with the steep orography.
Like on October 6, we obtained wind profiles above the Zugspitzplatt from pilot bal-loon ascents in the late morning and early afternoon of October 11 (not shown). Here, the direction was southerly to southeasterly. The wind speed indicated, again, large 5
fluctuations in time and space, increasing on average from about 2–3 ms−1right above the surface (at 2550 m altitude) to about 3 ms−1some 300 m above the surface. This is weaker than on October 6, consistent with the generally weaker wind on the ridge (cf. Figs. 9a and 11a).
Time series of temperature on the ridge are shown in fig 12d. The temperature 10
on the leeward side (blue) exceeds that on the windward side (red) during most of the banner cloud event. This is qualitatively like on 6 October, but on 11 October the temperature excess is less than 1 K and does not stand out as clearly as on 6 October (cf. fig 10d). Incidentally, there is a reversed temperature difference during the morning hours in figure 12d with temperatures on the southern side exceeding 15
those on the northern side by one to two degrees. Such a temperature difference was repeatedly observed on other days, too. It is almost certainly due to the influence of solar radiation leading to higher temperatures on the southern side of the ridge (which is exposed to the sun) than on its northern side (which lies in the shade). Although both 6 and 11 October were sunny during the morning hours, the effect of insolation on 20
the temperature measurement in not noticeable on October 6 (as opposed to October 11, compare Fig 10d and 12d), because on October 6 a strong wind was blowing from a southeasterly direction (see Fig. 9). On the other hand, on October 11 the southern side was in the lee until about 9 CET (see Fig. 11) and the wind speed was very small until that time, leading to higher temperatures owing to unventilated insolation
25
ACPD
11, 29407–29439, 2011Bannerclouds at Mount Zugspitze
V. Wirth et al.
Title Page
Abstract Introduction
Conclusions References
Tables Figures
◭ ◮
◭ ◮
Back Close
Full Screen / Esc
Printer-friendly Version Interactive Discussion
Discussion
P
a
per
|
Dis
cussion
P
a
per
|
Discussion
P
a
per
|
Discussio
n
P
a
per
|
In distinct contrast to October 6, the profiles from the radiosonde on 11 October (Fig. 12a) reveal a clear separation between the boundary layer and the free atmo-sphere, with the transition occurring some 250 m above the summit of the mountain. The profile of potential temperature (solid) shows an overall stable atmosphere with three pronounced inversions, the first aroundz=1000 m, the second above the summit 5
of Mt. Zugspitze atz=3300 m, and the third aroundz=4000 m. The profile of specific humidity (dashed) indicates that the atmosphere below z=1200 m is very moist, de-creasing to somewhat smaller values up toz=3300 m, and then d ecreasing to much smaller values above. This clearly suggests the existence of a well defined boundary layer
10
5 Conclusions
This paper reports about comprehensive observations which were taken in order to investigate banner clouds at Mount Zugspitze. The observations are partly comple-mentary providing both climatological information regarding the general occurrence of banner clouds as well as detailed measurements from two specific banner cloud 15
events.
From our climatological analysis, we obtained the following results for the banner clouds at Mount Zugspitze:
– They typically last for less than an hour (40 min on average), but the distribution has a long tail with rare events extending over several hours.
20
– They have a distinct diurnal cycle with a significantly higher chance of occurrence in the afternoon than in the morning. For this result it turned out essential to account for the change in daylight time as the seasonal cycle progresses.
– The frequency of occurrence has a distinct seasonal cycle (even when calibrated with respect to the varying length of the day), with an increased frequency during 25
ACPD
11, 29407–29439, 2011Bannerclouds at Mount Zugspitze
V. Wirth et al.
Title Page
Abstract Introduction
Conclusions References
Tables Figures
◭ ◮
◭ ◮
Back Close
Full Screen / Esc
Printer-friendly Version Interactive Discussion
Discussion
P
a
per
|
Dis
cussion
P
a
per
|
Discussion
P
a
per
|
Discussio
n
P
a
per
|
– Both the diurnal and the seasonal cycle of banner cloud occurrence have close analogs in similar behavior of climatological relative humidity. This suggests that the moisture availability is a key ingredient with higher moisture conditions favor-ing banner cloud occurrence on average.
– The banner clouds do not have any significant preference regarding wind speed. 5
However, there is a slight preference regarding wind direction, favoring southeast-erly flow and avoiding northsoutheast-erly flow.
Our observations do not allow to make any statement about the occurrence of ban-ner clouds at night. The basic dynamical processes which are believed to be important for banner cloud occurrence are independent of the presence of daylight. However, 10
thermodynamic conditions, in particular the availability of moisture, changes both with season and with the time of day; this is reflected in the pronounced diurnal and sea-sonal cycles of banner cloud occurrence that we obtained. Accordingly, we suggest that banner clouds can also occur at night; however, the rate of occurrence may differ from that during the day.
15
The slight preference of banner clouds for southeasterly wind direction, which is con-sistent with the report of Hauer (1949), may be associated with the complex orography of Mount Zugspitze. In particular, a vertical section cutting at right angles through the ridge, where measurements were taken, indicates a rather precipitous drop in altitude on the northern side, while the southern side is characterized by the “Zugspitzplatt”, 20
which is sort of a high plateau that only gradually leads to lower altitudes. This pro-vokes the hypothesis that the asymmetry in terrain is responsible for the observed sensitivity regarding wind direction. We are currently planning to test this hypothesis using simulations with both idealized and realistic orography.
We were surprised to find banner clouds for virtually any wind speed, with no sig-25
ACPD
11, 29407–29439, 2011Bannerclouds at Mount Zugspitze
V. Wirth et al.
Title Page
Abstract Introduction
Conclusions References
Tables Figures
◭ ◮
◭ ◮
Back Close
Full Screen / Esc
Printer-friendly Version Interactive Discussion
Discussion
P
a
per
|
Dis
cussion
P
a
per
|
Discussion
P
a
per
|
Discussio
n
P
a
per
|
preference for stronger wind speed renders the Bernoulli hypothesis (see introduction) implausible. That hypothesis posits that the pressure decrease along quasi-horizontal trajectories dictated by conservation of the Bernoulli function, and the associated adi-abatic cooling, may lead to banner cloud formation. If that hypothesis were to be true, banner clouds should have a preference for stronger wind speeds, because in that 5
case the pressure drop would be larger thus increasing the likelihood for cloud forma-tion. Our observations do not provide any indication for such a dependence, and we conclude that the Bernoulli hypothesis does probably not describe the major mecha-nisms for banner cloud formation.
The detailed observations of two specific banner cloud events in October 2005 fea-10
tured the following results:
– The windward and the leeward side of the ridge are characterized by different wind regimes. On the windward side the wind was strong, its direction was steady, and it had vertical shear; on the leeward side the wind was much weaker with large scatter in wind direction and no vertical shear on average. This is consistent with 15
Scorer (1955), who mentions “sheltered regions with almost stagnant air” in the lee of obstacles. We also found that the wind was upward on both sides of the ridge, corresponding to flow towards the ridge following the local terrain.
– The banner cloud episodes – most of the time – did not show signs of significantly changed wind regime compared to the time just before and after the banner cloud 20
event. This suggests that it is mostly the thermodynamic conditions (especially moisture) that were subtly different during the banner cloud event compared with before and afterwards. However, at one of the two banner cloud occurrences the termination coincided with a slight change in wind conditions, indicating that occasionally the dynamics may play a role for the onset or the termination of a 25
banner cloud.
ACPD
11, 29407–29439, 2011Bannerclouds at Mount Zugspitze
V. Wirth et al.
Title Page
Abstract Introduction
Conclusions References
Tables Figures
◭ ◮
◭ ◮
Back Close
Full Screen / Esc
Printer-friendly Version Interactive Discussion
Discussion
P
a
per
|
Dis
cussion
P
a
per
|
Discussion
P
a
per
|
Discussio
n
P
a
per
|
windward side was around 85–99 %. Of course this is not surprising; rather, it is a simple consequence of our definition of a banner cloud, requiring that the cloud should occur on one side of the mountain (or ridge) only. More interesting was the observation that the banner cloud episodes were characterized by higher temper-atures (by some 1 to 2◦) on the leeward (cloudy) side compared to the windward 5
(cloudfree) side. As a consequence, specific humidity was significantly higher on the leeward (cloudy) side compared to the windward (cloudfree) side
– The background atmosphere in both cases indicated an inversion several hundred meters above the summit of Mount Zugspitze associated with a layer of absolute stability. This clearly prevents convection to extend beyond the summit altitude. 10
Without such a stable layer the cloud on the leeward side might easily develop a more convective character; the latter, however, would exclude the cloud from being categorized as a banner cloud (see the definition of Schween et al. 2007).
Our observations indicating both moister and warmer air in the lee are consistent with the idealized Large Eddy Simulations of a banner cloud made by Reinert and 15
Wirth (2009). The authors assumed a horizontally homogeneous reference (initial) atmosphere. In their simulations the pronounced asymmetry in Lagrangian vertical displacement resulted in much larger uplift on the leeward side in comparison with the windward side. The temperature excess in the cloudy air could be traced back essentially to the release of latent heat within the cloud. This view is also supported 20
by our observations of the thermodynamic properties of the background atmosphere: in both cases higher levels were associated with higher lifting condensation levels than lower levels. It follows that a cloudy parcel at summit level must have suffered a larger uplift than a cloud-free parcel. Again, this is consistent with a significant difference in Lagrangian vertical displacement on the two sides of the ridge.
25
dynam-ACPD
11, 29407–29439, 2011Bannerclouds at Mount Zugspitze
V. Wirth et al.
Title Page
Abstract Introduction
Conclusions References
Tables Figures
◭ ◮
◭ ◮
Back Close
Full Screen / Esc
Printer-friendly Version Interactive Discussion
Discussion
P
a
per
|
Dis
cussion
P
a
per
|
Discussion
P
a
per
|
Discussio
n
P
a
per
|
ical conditions are rather easy to satisfy. In addition, however, the moisture conditions, too, must be just right, and this seems to be the harder to satisfy. In particular, the free atmosphere at Mount Zugpitze in winter is often rather dry on otherwise cloud-free days, which prevents banner cloud formation; in summer, on the other hand, the atmo-spheric boundary layer is likely to be much deeper, thus bringing moist air from below 5
close to the summit of the mountain and increasing the likelihood for banner cloud formation. Overall, this view renders it plausible why banner clouds, albeit regularly occurring, are not a very frequent phenomenon.
We caution that some of our results may be specific to the conditions at Mount Zugspitze. For instance, it is unclear to what extent the correlations between ban-10
ner cloud occurrence and relative humidity regarding the diurnal and seasonal cycle apply to other mountains. Similarly, the preference of banner clouds for certain wind directions is believed to depend, at least to some extent, on the specific orography of the mountain under consideration.
In summary, this paper provided, for the first time, comprehensive observations of 15
banner clouds at Mount Zugspitze. The observations are consistent with the notion that banner clouds essentially form in the upwelling part of a lee vortex like in the simulations of Reinert and Wirth (2009). The next steps would be to investigate to what extent the conditions at Mount Zugspitze are generic and apply to other sites of banner cloud occurrences. Progress in this direction can be made through similar 20
observations at other sites, or through numerical simulations. The latter should benefit from the results presented in this paper.
Acknowledgements. This work involved substantial help from numerous people. The
instal-lation of the masts in the rugged terrain on the ridge would not have been possible without the support of Andreas Oppenrieder, Sonja St ¨angl, and Markus Garhammer. We thank the
25
Austrian Telekom for giving us access to the power supply at their relay mast. Service of the cable car equipment and preliminary data analysis was done by Alexandra Mittermeyer. Es-sential help during the measurement campaign was provided by Markus Ablinger, Matthias Zink, Claudia Schmidt, Lars Wiegand, Hilbert Wendt, Heinz L ¨osslein and Robert Goler. The Kali airplane was operated by Hans Aschenbrenner and Phillip Kolb. We thank Julia Schreiber
ACPD
11, 29407–29439, 2011Bannerclouds at Mount Zugspitze
V. Wirth et al.
Title Page
Abstract Introduction
Conclusions References
Tables Figures
◭ ◮
◭ ◮
Back Close
Full Screen / Esc
Printer-friendly Version Interactive Discussion
Discussion
P
a
per
|
Dis
cussion
P
a
per
|
Discussion
P
a
per
|
Discussio
n
P
a
per
|
for evaluating the banner cloud movies. The German Weather Service kindly provided the data from the summit of Mount Zugspitze. This work was supported by the German Science Foundation grant Wi 1685/5-1, Wi 1685/5-4, and RE 1710/1-1.
References
Beer, T.: Atmospheric Waves. Adam Hilger Ltd., London, 315 pp., 1974. 29409
5
Douglas, C.: Some alpine cloud forms, Quart. J. Roy. Met. Soc., 54, 175–178, 1928. 29409, 29421
Egger, J., Bajrachaya, S., Egger, U., Heinrich, R., Reuder, J., Shakya, P., Wendt, H., and Wirth, V.: Diurnal winds in the Himalayan Kali Gandaki valley. Part I: Observations, Mon. Wea. Rev., 128, 1106–1122, 1999. 29413
10
Egger, J., Heinrich, R., Kolb, P., Mech, M., Reuder, J., Schween, J., Wendt, H., Bajrachaya, S., Shakya, P., L ¨ammlein, S., and Sch ¨aper, W.: Diurnal Winds in the Himalayan Kali Gandaki Valley, Part III: Remotely Piloted Aircraft Soundings, Mon. Wea. Rev., 130, 2042–2058, 2002. 29413
Geerts, B.: The origin of banner clouds: a case of scientific amnesia?, Bull Austr. Meteorol.
15
Ocean. Soc., 5, 6–9, 1992a. 29409, 29421
Geerts, B.: The origin of banner clouds: a potential vorticity perspective. Preprint volume, Sixth Conference on Mountain Meteorology, American Meteorological Society, Portland, Oregon (USA), 97–98, 29 Sept–2 Oct, 1992,.
Glickman, T. S.: Glossary of Meteorology, American Meteorological Society, 855 pp., Boston,
20
Massachusetts, USA, 2nd edn., 2000. 29409
Grant, H. D.: Clouds and Weather Atlas, Cowand-McCann, 294 pp., New York, USA, 1944. 29409
Hann, J.: Allgemeine Erdkunde, Druck von Gebr ¨uder Stiepel, Reichenberg, 1896. 29409, 29421
25
Hauer, H.: Ein schauerausl ¨osender Sogeffekt auf der Zugspitze. Met. Rundschau, 2, 326–327, 1949. 29421
ACPD
11, 29407–29439, 2011Bannerclouds at Mount Zugspitze
V. Wirth et al.
Title Page
Abstract Introduction
Conclusions References
Tables Figures
◭ ◮
◭ ◮
Back Close
Full Screen / Esc
Printer-friendly Version Interactive Discussion
Discussion
P
a
per
|
Dis
cussion
P
a
per
|
Discussion
P
a
per
|
Discussio
n
P
a
per
|
Humphreys, W. J.: Physics of the air, McGraw-Hill, 1st edn., 702 pp., The Franklin Institute
30
Press of J. B. Lippincott Company, Philadelphia, 1920. 29409
Huschke, R. E. (ed.): Glossary of Meteorology. American Meteorological Society, Boston, Mas-sachusetts (USA), viii+638 pp., 1959. 29409
K ¨uttner, J.: Erinnerungen 1945–1948, in: Die Geschichte der Wetterstation Zugspitze; Geschichte der Meteorologie, edited by: Wege, K., 4, 70–75, Selbstverlag des Deutschen
5
Wetterdienstes, Offenbach/Main, Germany, 2000. 29409
Peppler, W.: Hinderniswolken am S ¨antisgipfel, Das Wetter, 44, 212–213, 1927. 29409 Reinert, D. and Wirth, V.: A new LES model for simulating air flow and warm clouds above
highly complex terrain, Part II: The moist model, Bound.-Lay. Meteorol., 133, 113–136, 2009. 29409, 29423, 29424
10
Schween, J. H., Kuettner, J., Reinert, D., Reuder, J., and Wirth, V.: Definition of “banner clouds” based on time lapse movies, Atmos. Chem. Phys., 7, 2047–2055, doi:10.5194/acp-7-2047-2007, 2007. 29409, 29411, 29413, 29423
510
ACPD
11, 29407–29439, 2011Bannerclouds at Mount Zugspitze
V. Wirth et al.
Title Page
Abstract Introduction
Conclusions References
Tables Figures
◭ ◮
◭ ◮
Back Close
Full Screen / Esc
Printer-friendly Version Interactive Discussion
Discussion
P
a
per
|
Dis
cussion
P
a
per
|
Discussion
P
a
per
|
Discussio
n
P
a
per
|
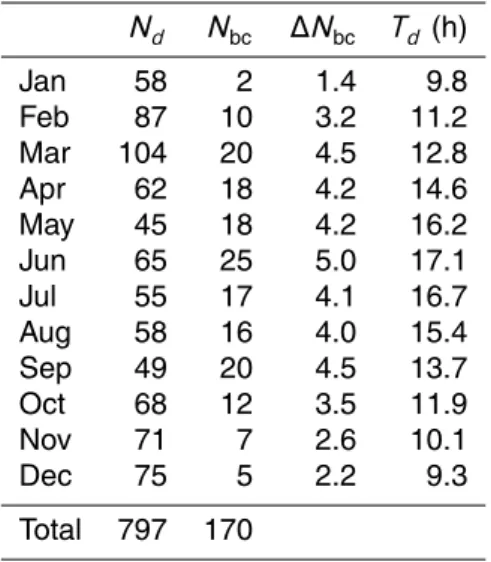
Table 1. Overview over the time lapse movies: each row represents a climatological month, the number of days with available data (i.e. with the digital camera operating) is denoted byNd, the number of observed banner cloud days is denoted byNbc, the length of the “daily operation time” is denoted byTd. As an estimate for the statistical error we use∆Nbc=p
Nbc.
Nd Nbc ∆Nbc Td (h)
Jan 58 2 1.4 9.8 Feb 87 10 3.2 11.2 Mar 104 20 4.5 12.8 Apr 62 18 4.2 14.6 May 45 18 4.2 16.2 Jun 65 25 5.0 17.1 Jul 55 17 4.1 16.7 Aug 58 16 4.0 15.4 Sep 49 20 4.5 13.7 Oct 68 12 3.5 11.9 Nov 71 7 2.6 10.1 Dec 75 5 2.2 9.3
ACPD
11, 29407–29439, 2011Bannerclouds at Mount Zugspitze
V. Wirth et al.
Title Page
Abstract Introduction
Conclusions References
Tables Figures
◭ ◮
◭ ◮
Back Close
Full Screen / Esc
Printer-friendly Version Interactive Discussion
Discussion
P
a
per
|
Dis
cussion
P
a
per
|
Discussion
P
a
per
|
Discussio
n
P
a
per
|
10˚59' 11˚00' 11˚01'
47˚24' 47˚25'
2000 2250
2250
2250
2500
2500
2500
2500
2500
2750
2750
!!"
!#"
$%"
!&"
500 m
ACPD
11, 29407–29439, 2011Bannerclouds at Mount Zugspitze
V. Wirth et al.
Title Page
Abstract Introduction
Conclusions References
Tables Figures
◭ ◮
◭ ◮
Back Close
Full Screen / Esc
Printer-friendly Version Interactive Discussion
Discussion
P
a
per
|
Dis
cussion
P
a
per
|
Discussion
P
a
per
|
Discussio
n
P
a
per
|
5 7 9 11 13 15 17 19 21
0 10 20 30 40 50 60
all months
Time of day (CET)
Number of events
0 0.2 0.4 0.6 0.8 1
0 10 20 30 40 50 60 70 80
all months
Time of day (fraction of obs time)
Number of events
(a) (b)
Fig. 5. Distribution of the time of occurrence of the observed banner cloud events. Panel(a)
ACPD
11, 29407–29439, 2011Bannerclouds at Mount Zugspitze
V. Wirth et al.
Title Page
Abstract Introduction
Conclusions References
Tables Figures
◭ ◮
◭ ◮
Back Close
Full Screen / Esc
Printer-friendly Version Interactive Discussion
Discussion
P
a
per
|
Dis
cussion
P
a
per
|
Discussion
P
a
per
|
Discussio
n
P
a
per
|
1 2 3 4 5 6 7 8 9 10 11 12
0 2 4 6
8 10 12 14 16
Number of BC events per month
Month
Number of banner cloud days
Fig. 6. Seasonal cycle of banner cloud occurrence. The dark bars indicate the average number of observed banner cloud days as a function of climatological month (with the error bars quantifying the statistical error). The light grey background histogram represents a hypothetical distribution for which the same total number of events is distributed according to the length of daylight.
ACPD
11, 29407–29439, 2011Bannerclouds at Mount Zugspitze
V. Wirth et al.
Title Page
Abstract Introduction
Conclusions References
Tables Figures
◭ ◮
◭ ◮
Back Close
Full Screen / Esc
Printer-friendly Version Interactive Discussion
Discussion
P
a
per
|
Dis
cussion
P
a
per
|
Discussion
P
a
per
|
Discussio
n
P
a
per
|
0 5 10 15 20
60 65 70 75 80 85 90 95 100
Local time (CET)
Relative humidity (in %)
RH four seasons
DJF MAM JJA SON
1 2 3 4 5 6 7 8 9 10 11 12
60 65 70 75 80 85 90 95 100
RH seasonal cycle
Month
Relative humidity (in %)
(a) (b)
Fig. 7. Climatology of relative humidity at the summit of Mt. Zugspitze: (a)diurnal cycle, and
ACPD
11, 29407–29439, 2011Bannerclouds at Mount Zugspitze
V. Wirth et al.
Title Page
Abstract Introduction
Conclusions References
Tables Figures
◭ ◮
◭ ◮
Back Close
Full Screen / Esc
Printer-friendly Version Interactive Discussion
Discussion
P
a
per
|
Dis
cussion
P
a
per
|
Discussion
P
a
per
|
Discussio
n
P
a
per
|
0 2 4 6 8 10 12 14 16 18
0 5 10 15 20 25 30 35 40
all months
Wind speed (m/s)
Number of events
0 9 1 270 360
0 5 10 15 20 25 30 35 40 45 50
all months
Wind direction (degr)
Number of events
(a) (b)
ACPD
11, 29407–29439, 2011Bannerclouds at Mount Zugspitze
V. Wirth et al.
Title Page
Abstract Introduction
Conclusions References
Tables Figures
◭ ◮
◭ ◮
Back Close
Full Screen / Esc
Printer-friendly Version Interactive Discussion
Discussion
P
a
per
|
Dis
cussion
P
a
per
|
Discussion
P
a
per
|
Discussio
n
P
a
per
|
(a) (b)
(c) (d)
(e) (f)
Fig. 9. Wind observations from the masts on both sides of the ridge on 6 October 2005. The left column represents the southern side, the right column represents the northern side of the ridge. (a) and (b): wind speed (in m s−1), (c) and (d): wind direction (in degrees), (e) and
ACPD
11, 29407–29439, 2011Bannerclouds at Mount Zugspitze
V. Wirth et al.
Title Page
Abstract Introduction
Conclusions References
Tables Figures
◭ ◮
◭ ◮
Back Close
Full Screen / Esc
Printer-friendly Version Interactive Discussion
Discussion
P
a
per
|
Dis
cussion
P
a
per
|
Discussion
P
a
per
|
Discussio
n
P
a
per
|
(a) (b)
(c) (d)
Fig. 10. Observations of thermodynamic conditions on 6 October 2006. (a)Profiles of potential temperatureθ
(solid) and specific humidityqv(dashed) from a radiosonde ascent made at the foot of Mount Zugspitze in Garmisch-Partenkirchen at 16:44 CET (start time). Layers which are absolutely stable are indicated by grey shading.(b)Profiles of lifting condensation levelzLCL as a function of altitude, computed from two radiosonde ascents: no. 1 (dashed)
ACPD
11, 29407–29439, 2011Bannerclouds at Mount Zugspitze
V. Wirth et al.
Title Page
Abstract Introduction
Conclusions References
Tables Figures
◭ ◮
◭ ◮
Back Close
Full Screen / Esc
Printer-friendly Version Interactive Discussion
Discussion
P
a
per
|
Dis
cussion
P
a
per
|
Discussion
P
a
per
|
Discussio
n
P
a
per
|
(a) (b)
(c) (d)
(e) (f)
ACPD
11, 29407–29439, 2011Bannerclouds at Mount Zugspitze
V. Wirth et al.
Title Page
Abstract Introduction
Conclusions References
Tables Figures
◭ ◮
◭ ◮
Back Close
Full Screen / Esc
Printer-friendly Version Interactive Discussion
Discussion
P
a
per
|
Dis
cussion
P
a
per
|
Discussion
P
a
per
|
Discussio
n
P
a
per
|
(a) (b)
(c) (d)