SPEECH RECOGNITION IN STUDENTS FROM SEVEN
TO TEN YEARS OLD FROM TWO DIFFERENT
SOCIOECONOMIC-CULTURAL LEVELS
Reconhecimento de fala em escolares de 7 a 10 anos
de dois distintos níveis socioeconômico-culturais
Karine Thaís Becker (1), Maristela Julio Costa (2), Alexandre Hundertmarck Lessa (3)
(1) Speech Therapist; Master in Human Communication Disor-ders by Universidade Federal de Santa Maria – UFSM, Santa Maria, RS, Brazil.
(2) Speech Therapist; Adjunct Professor of Speech The-rapy Department in Universidade Federal de Santa Maria – UFSM, Santa Maria, RS, Brazil; Doctor in Science of Human Communication Disorders by Universidade Federal de São Paulo.
(3) Speech Therapist of “Projeto Promoção da Saúde Audi-tiva” promoted by Universidade Federal de Santa Maria; Undertaking Master degreein Science of Human Commu-nication Disorders by Universidade Federal de Santa Maria – UFSM, Santa Maria, RS, Brazil.
Conlict of interest: non-existent
acoustic sounds is necessary to associate
informa-tion and experiences previously acquired1.
Children that develop themselves in a lower socioeconomically pattern may present not well improved listening competences2. The sooner chil-dren get involved in social relations, more beneits
they will obtain in a short or long term, considering
experiences acquired and learning that results from
such interactions3.
That happens because in a not favored cultural and socioeconomically environment, the poor
condi-tions to which several families are exposed contri
-bute to not constructive and stimulating contexts to
the childish development, besides the precarious health assistance and the lack of social and
educa-tional resources or disinterest to ind it 4.
Furthermore, a lot of children with normal
peri-pheral audition may present dificulties on their
hearing perception skills, mainly in which concerns
INTRODUCTION
Listening is an ability that depends on the innate biological competence and mainly from the
indivi-dual environment experience. To give meaning to
ABSTRACT
Purpose: to research and compare the speech recognition of 7 to 10 years-old normal-hearing scholars from different socioeconomic-cultural levels, through a test that uses sentences as stimulus (silence and competitive noise). Method: 51 children, from seven to ten years and 11 months, divided into two groups according to the socioeconomic-cultural level participated of the study. Thus, the Group 1 (G1) – middle high level – was comprised of 23 children and the Group 2 (G2) – middle lower level – of 28 children. Realized procedures: anamnesis; meatoscopy; to obtain hearing thresholds, measures of acoustic impedance and Recognition Sentence in the Silence Thresholds (RSST) and in
the Noise (RSNT), expressed by the signal/noise ratio (S/N). These Recognition Sentence Thresholds
were obtained using the Portuguese Sentence Lists test (PSL). The data were statistically analyzed.
Results: there was no statistically signiicant difference between right and left ears for the analyzed
variables in both groups. The average for the RSST for the G1 was 9.3 dB HL and for the G2, 10.7 dB
HL. The S/N average in the G1 was -5.9 dB HL and in the G2, -1.7 dB HL. Statistical analysis showed signiicant difference between groups only for the S/N. Conclusions: when the auditory processing is
more required, the middle lower level children demonstrated reduced performance, comparing to the
upper middle level children.
information about audiological complaints veriied in the moment of the evaluation, students level, extra -curricular activities and living habits. Then, there
was a visual inspection of the external ear channel
and the auditory thresholds were obtained, the SRT and acoustic ersatz measures.
The evaluations were performed in a sound--treated cabin, using a digital two-channel audio-meter, Fonix brand – Hearing Evaluator – model FA – 12, type I and earphones type TDH-39P,
Tele-phonics brand. To obtain the acoustic immittance
measures, it was resorted a Telephonics middle ear
analyzer, model TDH-39P and coxim MX-41 and a
probe of 220 Hz to 70 dB SPL.
The 51 children were divided into two groups according to the socioeconomic-cultural level, based
in the Criterion of Economic Classiication of Brazil
made by the Brazilian Association of Research Companies (in Portuguese, Associação Brasileira
de Empresas de Pesquisa – ABEP (2008))9, which
estimates the level and capacity of the families to purchase material goods. These criteria proceeds
with a questionnaire application composed by two general questions: the irst one refers to items disposed in the house of a speciic family and the
second one to the educational degree of the respon-sible for the family’s economy.
For the analysis of the questionnaire, it was
used a scoring system for the items in each issue, described by ABEP. Then, an addition calculus was made to demonstrate the socioeconomic status of
each child. The ratings of the questionnaire are:
class A1, A2, B1, B2, C1, C2, D and E.
The classiication suggested by ABEP does not
use any kind of nomenclature for each class. In
order to assist in textual clarity and to denominate
groups 1 and 2, the terms socioeconomic
medium--high level and socioeconomic low-medium level
were used, respectively.
The extra-curricular activities performed by chil -dren were also considered, besides the leisure acti-vities of the family, as well as running courses in foreign language, music (playing a musical
instru-ment) and access to computer and / or Internet.
After that, it was performed a research of Recognition Sentences in the Silence Thresholds (RSST) and in the Noise (RSNT). These Recog-nition Sentences Thresholds were obtained using the Portuguese Sentences Lists test – PSL10. The
sentences were presented using a Compact Disc
(CD) Player Digital Toshiba – 4149, linked to an
audiometer already described.
Portuguese Sentence Lists Test - PSL
The test was developed by Costa (1998) and it is recorded on CD. The test consists on eight
to their speech comprehension ability. The complex
sentences comprehension depends on the percep-tual processes and the attention that the individual
will acquire throughout life and its origin depends of
the changes presented on their development 5.
The speech recognition must be considered as the most important aspect to be measured on human hearing functions, because it allows an evaluation of the receptive communicative func-tion. Due the challenge that this task represents, its evaluation provides relevant information about the individual ability concerning hearing skills in noisy environments 6.
Tests in which sentences are used as stimulus, mainly with competitive noise application, consist in an essential tool to the hearing abilities evaluation
that represents daily hearing experiences 6.
Considering all the information mentioned above, the aim of this study is to research and compare the speech recognition of normal-hearing students from different socioeconomic-cultural levels, through a test that uses sentences as stimulus, presented in
silence and with competitive noise context.
METHOD
This research presents a quantitative aspect,
transversal, prospective and contemporary.
51 children from seven to ten years and 11
months old, from private and public schools and/or
philanthropist institutions, which assist children in need, from the city of Santa Maria, Rio Grande do Sul, were evaluated. The schools permission was demanded by an Institutional Authorization Term.
The individuals, as well as their parents or people in charge of them, were informed about the aims,
procedures, risks and beneits of this study and the Free and Clariied Permission Term was signed by
the children’s parents or people in charge.
In order to participate of the study, children had to have tonal hearing thresholds to air conducted until
25 dB in the frequencies of 500 to 4000 Hz on both
ears7; Speech Recognition Threshold (SRT) Agree
to ± 6 dB with the average hearing thresholds at 500, 1000 and 2000 Hz8; Tympanogram Type A and present acoustic relexes. Moreover, the absence
of neurological, cognitive, psychological and hype-ractivity problems known and articulatory or phono-logical changes that might interfere in the hearing stimulus repetition. The articulatory or phonological changes absence was analyzed by observational evaluation during the child spontaneous speech before the beginning of the evaluations.
intervals of stimulus presentation of 2 dB between each other until the end of the list. However, due to
the technical possibilities of the equipment available
to perform this study, it has been used presentation intervals of 5 dB and 2.5 dB, respectively.
It is noted that after recording the CD, it was found
by spectrographic analysis computed as requested
by the author of the material to a technician, a diffe-rence of 7 dB between the recording volume of the two signals (speech and noise) in which it was found out that the sentences were recorded at an average intensity of 7 dB below the noise intensity. For this reason, in the evaluations using earphones, it must be subtracted from 7 dB of the average values
observed and presented on the dial of the equip -ment; procedure adopted in this research as well as
in all research with earphones, since conirmed this
observation13.
The sentences presentation levels were recorded
for subsequent calculation of the average score
from the values where there was a change in the type of response. After obtaining the average value, it was subtracted from the 7 dB above, resulting in the RSST and RSNT.
Finally, it was calculated the ratio signal/noise (S / R) by subtracting the value of RSST in the level of
noise intensity (65 dB NA).
The variables considered in the study were the
RSST and RSNT (expressed as the ratio S / R).
It was performed at the Audiology Clinic of the Speech and Hearing Service from Universidade Federal de Santa Maria (in the period between November 2009 and October 2010, considering
the project “Pesquisa e Base de Dados em Saúde
Auditiva”, registered at Projects Cabinet under number 019731 and approved by Research Ethics
Committee with certiicate number
0138.0.243.246-06, on May, 12th, 2006.
Data Analysis
Firstly, the Wilcoxon not parametric test was
applied in order to compare the results obtained between the right and the left ear of the tested indi-viduals on each group.
Then, there it was made a descriptive analysis of the values which used the arithmetic average,
a standard deviation and minimum and maximum points coming from the evaluation of RSST and S/R.
For comparison between the RSST and S/R
ratios means of the subjects of the two groups, it was used the nonparametric Mann-Whitney U, considering two independent groups.
It was considered the signiicant statistic level of
p < 0,05 (5%).
Statistically signiicant results were marked with
an asterisk (*) in the following tables. lists of sentences and a speech spectrum noise,
recorded in separate channels, allowing the presen-tation of sentences in noise, with different levels of presentation.
Before starting the test with each subject, the output of each channel of the CD was calibrated using the VU meter of the audiometer. The 1 kHz tone in this CD on the same channel in which the sentences were recorded, as well as masking noise present in the other channel, was placed at zero.
The lists of sentences and the competing noise were presented monaurally and ipsilaterally through earphones, allowing the evaluation of the ears separately. Different lists of sentences were used, one for each test condition in order to eliminate the possibility of better performance due to the memo-rization of sentences. The use of different lists was not considered a variable, because the lists applied
were equivalent 11.
The sentences were applied in the following order:
• Silence Measures Obtainment:
– Training: Presentation of the sentences from 1 to 5 of the list 1A in the right ear (RE) and from 6 to10 in the left ear (LE).
– Research of RSST: presentation of the lists 1B and 2B in the RE and LE, respectively.
• Noise Measures Obtainment:
– Training: Presentation of the sentences from 11 to 15 of the list 1A in the RE and from 16 to 20 in the LE.
– Research of RSNT: presentation of the lists 3B and 4B in the RE and in the LE, respectively.
The initial intensity of transmission of the irst
sentence of each list - the necessary intensity for
each subject’s success in the irst sentence of each
list of the test - was based on the results described above when training, and on the research with
competitive noise, it was ixed at a constant inten -sity of 65 dB HL.
The strategy used to research the RSST and
RSNT was sequential or adaptive, or ascen -ding-descending12. This one allows measuring the required intensity for the individual to iden -tify, correctly, about 50% of the speech stimulus
presented in a certain ratio S / R.
Considering this strategy, when the child correctly recognizes speech stimulus presented, the intensity was decreased, otherwise increased. A response was considered correct only when the child repeated, without any error or omission, the whole sentence presented.
their development, so the more diversiied activi -ties and the access to different technologies those
children has been exposed to, enables a positive
progress of such individuals.
Thus, the groups were rated and constituted by this way:
• G1 – socioeconomic medium-high level: 23 children.
• G2 – socioeconomic low-medium level: 28 children.
Statistically, no signiicant difference was found
between the results of right and left ears of children of different ages in both groups for both measures obtained in silence and in noise. Therefore, the results of the both ears were grouped and analyzed together. Thus, we analyzed 46 ears of G1 and 56 of G2.
In Table 1 are shown the mean, standard
devia-tion, maximum and minimum values of RSST and S/R ratio in groups 1 and 2.
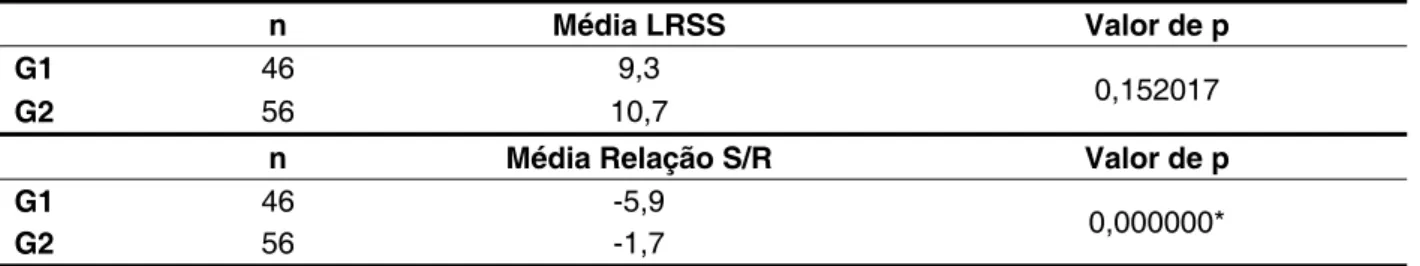
In Table 2 are shown the data obtained by
compa-rative analysis of RSST and S/R ratio founded for
each group (Mann-Whitney U test).
RESULTS
There were no children in this study rated on class A1, neither on class E. All the children from
private schools were classiied as class A2, B1 and
B2, and were gathered on Group 1 (G1). The public school and philanthropical institution’s children were rated as class C1, C2 and D, and were grouped on Group 2 (G2).
After data results of the anamnesis had been
exposed, it was noted that children rated in G1 showed a large number and variety of extracur -ricular activities and entertainment, held foreign
language courses and / or music and had computer access and / or Internet . The children classiied in
G2 showed activities that were summed up to the tours and activities offered by the school itself, with no foreign language classes, and just one student that have played a musical instrument; those who
had computer access and / or the Internet did so at
relatives’ houses.
Considering all the analysis that has been made, it seems important to include the term cultural when rating the groups. It can be observed that different activities performed by children may interfere with
Variáveis n Média Mínimo Máximo DP
G1 LRSS S/R 46 46 -5,9 9,3 -2,00 3,35 18,50 -9,50 3,60 2,22
G2 LRSS S/R 56 56 10,7 -1,7 +5,20 4,80 21,30 -5,80 4,25 2,50
Table 1 – Mean, standard deviation (SD), maximum and minimum values of RSST and S/R ratio in groups 1 and 2, in decibel (dB NA)
Legend: RSST – Recognition Sentence in the Silence Thresholds; S/R – signal to noise ratio; SD – standard deviation
n Média LRSS Valor de p
G1 46 9,3
0,152017
G2 56 10,7
n Média Relação S/R Valor de p
G1 46 -5,9
0,000000*
G2 56 -1,7
Table 2 – Results of Mann-Whitney U test for RSST and S/N ratio of both groupsU de Mann-Whitney test
* Statistically signiicant difference (p < 0,05)
1 and 2 kHz can be used as a benchmark for the analysis and interpretation of the results obtained on the RSST research19.
Therefore, as the normal hearing was one of the criteria for inclusion in this study and all
chil-dren were literate, it was expected that the subjects
evaluated in both groups had good performance
in silence, which was conirmed by analyzing the
results of this variable.
Recognition Sentences in the Noise Thresholds – RSNT
When the measurements were obtained in the presence of competitive noise, the values were
found for the ratio S/R of -5.9 dB HL in G1 and G2
-1.7 dB HL (Table 1).
There is a study that evaluated normal-hearing children, aged 9-12 years, with and without history of
otitis media. Values of -5.55 dB HL for RE and -5.61
dB HL for LE in the group without otitis and -4.61 dB HL for RE and -4.35 dB HL for the LE group with
otitis media were found14. A second study evaluated
normal-hearing children from 9 to 11 years with and without any kind of education failure. The values obtained were -6.02 dB HL and -5.83 dB HL to the right and left ears, respectively, for the group without complaint, and -2.81 dB HL for the RE and -3.34 dB HL for LE in the group with the complaint15.
For students with and without musical prac-tice and from different socio-cultural levels, aged between 7-13 years, the researchers found values
of -3.94 dB HL for children with musical experience
from upper-middle class; -4.61 dB HL for children
with no musical experience from upper-middle class
and -1.54 dB HL for children from lower class16.
In addition, it was found other studies about chil-dren concerning speech recognition, but with data
expressed in different forms of measurements5, 6, 20. Those studies also veriied differences between
control and study groups, with better performances in the control groups, demonstrating perceptual and cognitive factors that directly interfere with this task.
Thus, the values found here to the ratio S/R in G1
are similar to those in control groups of the resear-ches mentioned above. For its part, when compared with study groups, we could verify that the values for G2 are below those found by these researches, only agreeing with the results of one of them for children from lower class16. It demonstrates that children of
socioeconomic-cultural low-medium level had lower performance comparing with children with otitis
media history and learning dificulties, but similar
to the children from lower class found by Gambini (2004).
When the performance of children from G1 and G2 for this variable was compared, the analysis found
DISCUSSION
The aim of this study was to research and compare the speech recognition of students between 7 to 10 years old from different socioe-conomic-cultural levels, through a test that uses sentences as stimulus.
In order to elucidate the explanation of the results,
as well as reading and understanding of them, the discussion is divided into two parts, related to (1) recognition sentences in the silence thresholds (RSST) and (2) recognition sentences in the noise thresholds (RSNT).
Recognition Sentences in the Silence Thresholds – RSST
The average values for the RSST were 9.3 dB NA in G1 and 10.7 dB NA in G2 (Table 1). The
analysis found no statistically signiicant difference
for this measure when compared to the both groups (Table 2). That is, when evaluated in the silence, the children of socioeconomic medium-high level and socioeconomic low-medium level has demonstrated similar performance.
Studies using the PSL found values of 6.81 dB NA for RE and 8.14 dB NA for LE in normal-hearing children, aged between 9 to 12 years old with no history of otitis media14; and 5.95 dB NA and 6.79 dB
NA for RE and LE, respectively, in normal-hearing children, ages 9 and 11 years with no history of school failure15. A study in children with and without
musical practice and from different socio-cultural levels, aged between 7 and 13 years old, found values of 6.60 dB NA to the children of
upper--middle class with musical experience; 7.75 dB NA
for children of upper-middle class with no musical
experience and 10.43 dB NA for children from lower
social class16.
As a consequence, the results show that the
average values of RSST gathered here for both groups are close to those found in the literature.
Several studies with normal hearing15, 17 has demonstrated excellent results when subjects are
evaluated in silence, though when evaluated in
noise, the performance drops signiicantly. Accor -ding to these authors, it happens because when the evaluation is performed in silent places, few
liste-ning skills channels are required for the auditory
information processing occurrence.
To obtain a good speech recognition in silence is necessary that the individual present previous know-ledge of the language (familiarity with the words) and hearing threshold within normal limits, conside-ring that these variables are closely related18.
engrams for the speech recognition sounds24, 27. The environments and childhood experiences in different
socioeconomic classes are, at least, partly respon-sible for the different neurocognitive outcomes in these children28.
D’Angiulli et al. (2008)29, demonstrated, through neuroi-maging techniques, that it was how is expressed
the selective attention ability in children of different socioeconomic levels. The subjects had to attend to two target sounds and ignore the other two that were irrelevant ones. They concluded that, although chil-dren studied carried out the proposed task similarly, children of low socioeconomic class used additional resources to meet also the irrelevant information.
Stevens, Lauinger & Neville (2009)2 demonstrated that
children aged 3 to 8 years old, from low-medium socioeconomic level have a limited effect of selec-tive attention on neural processing. The differences
were speciically related to a reduced ability to ilter
out irrelevant information. These data provide direct evidence for differences in the stages of processing within the neural systems mediating selective atten-tion in children of different social classes.
Therefore, it appears that a higher stimulation
during the child’s development is extremely impor -tant for the necessary connections that have to be established on the auditory development.
Whereas most of the low-medium socioeco-nomic level children have lack of stimulation, the performance of several skills involved in speech recognition, compared to competitive noise, is at
disadvantage, which relects in a worst performance
on this task, as observed in this study.
Thus, we can infer that the children of G2, when in learning situations in noisy environments, which are very common, especially in classrooms where the noise level is higher 30, may consequently have more dificulty on required tasks and this may inter -fere on their learning process.
CONCLUSIONS
Considering the results obtained it is veriied that
there is no difference in the sentence recognition in silence between children of different socioeconomic and cultural levels, nevertheless whenever they were evaluated with competitive noise the lower socioeconomic and cultural level children presented
a signiicantly worse performance. a statistically signiicant difference between both
groups (Table 2). In other words, when measured in noise, the groups behaved differently; the children of low-medium socioeconomic-cultural level (G2)
had signiicantly lower performance comparing to
children of medium-high socioeconomic level (G1).
It proves that children of G2 required a ratio S/N
more favorable to recognize around 50% of the speech stimuli presented in noise. It is noticeble
that the largest negative value of ratio S/R means
a worst situation and better subject’s performance. Children of low-medium socioeconomic-cultural
level required a ratio S/N of 4.2 dB HL average more
favorable to perform the same task as the children of medium-high socioeconomic-cultural level.
To measure the importance of this difference in speech recognition in noise, according to litera-ture21, 22, the variation of 1 dB in ratio S/R in normal --hearing subjects represents signiicant changes in
speech recognition.
Thus, for example, is used a study found a varia -tion of 13.2%21 in speech recognition for each varia-tion of 1 dB in S / N ratio, we could predict that the
children of G2 present speech recognition in noise about 50% worse compared to the children of G1.
These results agree with other studies15, 17 and
corroborate the importance of tests in noise, since individuals with the same abilities of speech recog-nition in silence may have results considerably different in noisy environments. According to these authors, when the evaluation occurs in the noise, instead of silence, several audio channels are
required to achieve the same level of speech recog -nition, indicating that more detailed sensory
infor-mation are necessary in dificult listening conditions. This task requires a complex set of cognitive
and perceptual skills, including auditory working memory, detection and processing of spectral and temporal aspects23, 24, and auditory skills of igure
--ground25, auditory closure and selective attention26.
The speech comprehension in noisy
environ-ments is a challenge for any listener. This dificulty
is related, in part, to the negative effects of noise on neural synchrony, resulting in a degraded represen-tation of speech in cortical and subcortical levels20.
REFERENCES
1. Pereira LD. Avaliação do processamento auditivo central. In: Lopes Filho, O. et al. (org). Tratado de Fonoaudiologia. 2ª ed. São Paulo: Tecmedd; 2005. p.111-30.
2. Stevens C, Lauinger B, Neville H. Differences in the neural mechanisms of selective attention in children from different socioeconomic backgrounds: an event-related brain potential study. Developmental Science. 2009; 12(4): 634–46.
3. Hackman DA, Farah MJ, Meaney MJ. Socioeconomic status and the brain: mechanistic insights from human and animal research. Nature Reviews Neuroscience. 2010; 11: 651-9.
4. Halpern R, Giugliani ERJ, Victora CG, Barros FC, Horta, BL. Fatores de risco para suspeita de atraso no desenvolvimento neuropsicomotor aos 12 meses de vida. J Pediatr. 2000; 76: 421-8.
5. Leech R, Aydelott J, Symons G, Carnevale J, Dick F. The development of sentence interpretation: effects of perceptual, attentional and semantic interference. Developmental Science. 2007; 10(6): 794-813.
6. Theunissen M, Swanepoel DW, Hanekom J. Sentence recognition in noise: Variables in compilation and interpretation of tests. Int J Audiol. 2009; 48: 743-57.
7. Davis H, Silverman SR. Hearing and deafness. New York: Holt, Rinehart & Winston, 1970.
8. Wilson RH, Strouse, AL. Audiometria com estímulos de fala. In: Musiek FE, Rintelmann WF. Perspectivas atuais em avaliação auditiva. 1ª Ed. Brasileira, 2001, 21-62 p.
9. ABEP: Associação Brasileira de Empresas
de Pesquisa (2008). Critérios de Classiicação
Econômica Brasil. [Acesso em: 26 maio 2009].
Disponível em: http://www.abep.org/
10. Costa MJ. Lista de sentenças em português:
apresentação e estratégias de aplicação na
audiologia. Santa Maria: Pallotti; 1998. p. 44.
11. Santos SN, Daniel RC, Costa JC. Estudo
da equivalência entre as listas de sentenças em
português. Rev. CEFAC. 2009; 11(4): 673-80.
12. Levitt H, Rabniner LR. Use of a sequencial
strategy in intelligibility testing. J Acoust Soc Am. 1967; 42: 609-12.
13. Cóser PL, Costa MJ, Cóser MJS, Fukuda Y. Reconhecimento de sentenças no silêncio e no ruído em indivíduos portadores de perda induzida pelo ruído. Rev Bras de Otorrinolaringol. 2000; 66:(4):362-70.
14. Machado MS. Reconhecimento de Sentenças no Silêncio e no Ruído em Escolares com e sem
Histórico de Otite Média Recorrente. [Dissertação].
Santa Maria (RS): Universidade Federal de Santa Maria; 2002.
15. Daniel RC, Costa MJ, Oliveira TMT. Reconhecimento de sentenças no silêncio e no
RESUMO
Objetivo: pesquisar e comparar o reconhecimento de fala em escolares de 7 a 10 anos de diferentes
níveis socioeconômico-culturais, por meio de teste que utiliza sentenças como estímulo apresentadas
no silêncio e com ruído competitivo. Método: 51 crianças, de 7 anos a 10 anos e 11 meses, foram avaliadas e divididas em dois grupos de acordo com o nível socioeconômico-cultural. Assim, o Grupo
1 (G1) – nível médio-alto – icou constituído por 23 crianças e o Grupo 2 (nível médio-baixo) por 28.
Procedimentos realizados: anamnese, meatoscopia, obtenção dos limiares auditivos, das medidas de imitância acústica e dos Limiares de Reconhecimento de Sentenças no Silêncio (LRSS) e no Ruído
(LRSR), expresso na relação sinal-ruído (S/R). Para a obtenção dos LRSS e LRSR foi utilizado o
teste Listas de Sentenças em Português - LSP (Costa, 1998). Os dados foram analisados estatisti-camente. Resultados: não houve diferença estatisticamente signiicante entre as orelhas direita e
esquerda para as variáveis analisadas em ambos os grupos, dessa forma os resultados foram agru
-pados e analisados conjuntamente. A média obtida para os LRSS no G1 foi de 9,3 dB NA e no G2 de 10,7 dB NA. A média da relação S/R no G1 foi de -5,9 dB NA e no G2 de -1,7 dB NA. A análise estatística veriicou diferença signiicante entre os grupos apenas para a relação S/R. Conclusões:
quando a tarefa exigiu maiores demandas do processamento auditivo (ruído competitivo), as crianças com nível médio-baixo demonstraram desempenho reduzido, em comparação com crianças de nível médio-alto.
23. Houtgast T, Festen JM. On the auditory and
cognitive functions that may explain an individual’s
elevation of the speech reception threshold in noise. Int J Audio. 2008; 47: 287-95.
24. Parbery-Clark A, Skoe E, Lam C, Kraus N. Musician enhancement for speech in noise. Ear & Hearing. 2009; 30(6): 653-61.
25. Schochat E. Percepção da fala. In: Schochat E. Processamento auditivo: atualidades em fonoaudiologia. São Paulo: Lovise; 1996. p. 15-42. 26. Pereira LD. Processamento auditivo: abordagem passo a passo. In: Pereira LD, Schochat E. Processamento auditivo central: manual de avaliação. São Paulo: Lovise; 1997. p.49-59.
27. Colella-Santos MF, Bragato GR, Martins PMF, Dias AB. Triagem auditiva em escolares de 5 a 10 anos. Rev. CEFAC. 2009; 11(4): 644-53.
28. Hackman DA, Farah MJ. Socioeconomic status and the developing brain. Trends in Cognitive Sciences. 2008; 13(2): 65-73.
29. D’angiulli A, Herdman A, Stapells D, Hertzman C. Children’s event-related potentials of auditory selective attention vary with their socioeconomic status. Neuropsychology. 2008; 22: 293–300. 30. Gonçalves VSB, Silva LB. Coutinho AS. Ruído como agente comprometedor da inteligibilidade de fala dos professores. Produção. 2009; 19(3): 466-76.
ruído de crianças com e sem histórico de repetência escolar. Fono Atual. 2003; 26(4): 35-41.
16. Gambini C. Reconhecimento de fala em
escolares com e sem prática musical e diferentes níveis sócio-culturais. [Monograia]. Santa Maria
(RS): Universidade Federal de Santa Maria; 2006. 17. Ziegler JS, Pech-Georgel C, George F, Lorenzi
C. Speech perception in noise déicits in dyslexia.
Dev Sci. 2009; 12: 732–45.
18. Plomp R. Auditory handicap of hearing
impairment and the limited beneit of hearing aid. J
Acoust Soc Am. 1978; 63: 533-49.
19. Aurélio NHS, Becker KB, Padilha CB, Santos
SN, Petry T, Costa MJ. Limiares de reconhecimento de sentenças no silêncio em campo livre versus limiares tonais em fone em indivíduos com perda auditiva coclear. Rev CEFAC. 2008; 10(3): 378-84. 20. Anderson S, Skoe E, Chandrasekaran B, Kraus N. Neural Timing is Linked to Speech Perception in Noise. The Journal of Neuroscience. 2010; 30(14): 4922-6.
21. Wagener KC. Factors inluencing sentence
intelligibility in noise. Bibliotheks- und Information System der Universität Oldenburg, 2004.
22. Henriques MO, Costa MJ. Limiares de
reconhecimento de sentenças no ruído, em campo livre: valores de referência para adultos normo-ouvintes. Rev Bras Otorrinolaringol. 2008; 74(2): 188-92.
Received on: November 24, 2011 Accepted on: February 06, 2012 Mailing address:
Karine Thaís Becker
Rua Pedro Santini, 177/109-C,
Nossa Senhora de Lourdes Santa Maria – RS
CEP: 97060-480